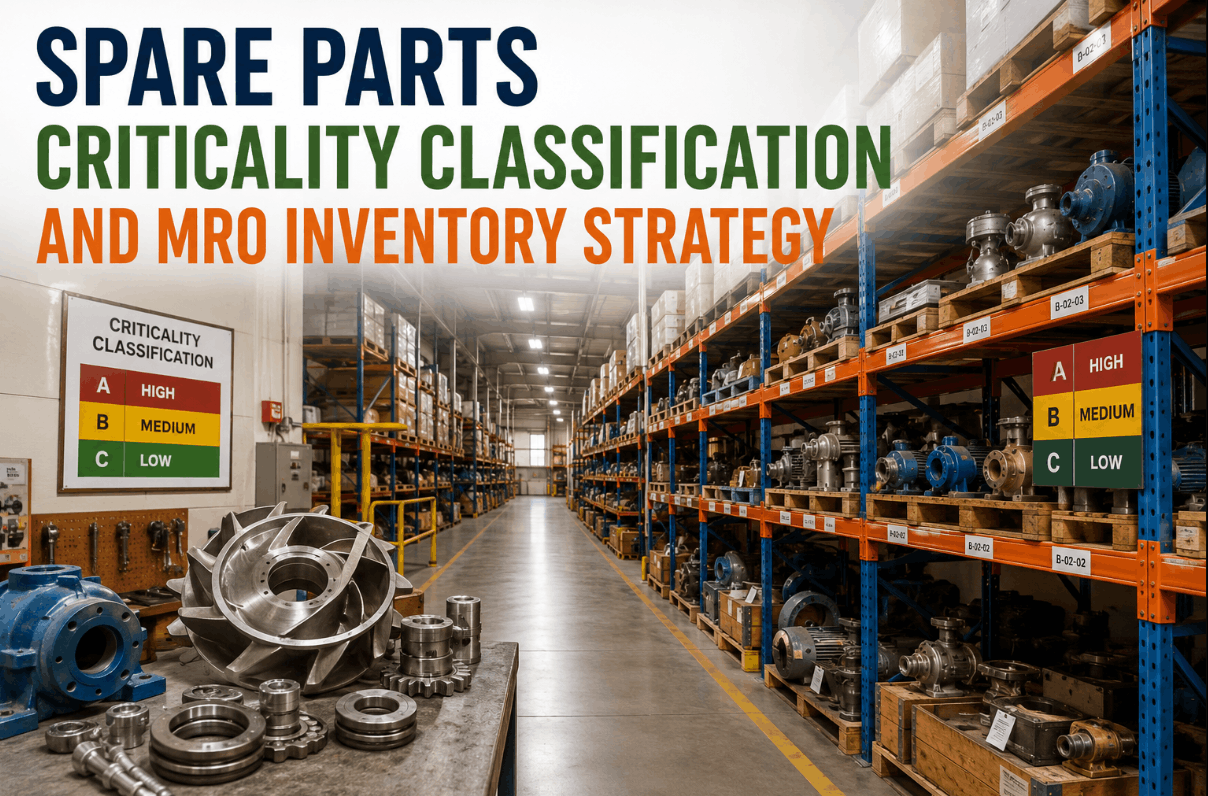
Somewhere in your warehouse is a shelf of spare parts nobody has touched in six years, sitting next to a critical seal that's been on backorder twice this quarter because nobody flagged it as high-risk. Across the industry, operators are holding more than $500 million collectively in spare parts inventory, and a meaningful share of it is capital sitting in the wrong place. iFactory's spare parts optimization tells you which parts deserve that shelf space and which ones are quietly trapping your working capital.
$500M+ in Spare Parts Inventory Across the Industry. Most of It Isn't Sized to Actual Risk.
AI-driven spare parts optimization sizes stock levels against criticality, lead time, and failure prediction — not last year's purchase history repeated on autopilot.
Two Failure Modes, One Warehouse
Every spare parts inventory carries two opposite failure modes simultaneously, and most stocking policies address neither one deliberately. Somewhere on the shelves, capital is trapped in slow-moving parts that will sit for years before they're needed, if they're ever needed at all. Somewhere else, a genuinely critical component — one whose failure would stop production — is stocked at a level, or a lead time, that doesn't match how consequential it actually is. Both problems usually trace back to the same root cause: stocking decisions made once, based on generic reorder-point rules, and never revisited against how the equipment is actually performing today.
Overstocked & Trapped
Slow-moving, low-criticality parts held at quantities and durations that tie up capital with no corresponding reduction in operational risk. Often the result of a one-time bulk purchase or a supplier minimum order quantity nobody revisited.
Underprotected & Exposed
Critical components — long lead time, high failure consequence, single point of supply — stocked below the level their risk profile actually justifies, often because their criticality was never formally assessed in the first place.
How AI Reprices Every Part Against Its Actual Risk
Score criticality per part, not per category
Rather than applying a blanket policy by part type, each SKU is scored against the specific equipment it serves, the production impact of that equipment failing, and whether redundancy exists elsewhere in the process.
Model lead time risk realistically
Supplier lead time is tracked against actual historical delivery performance, not the catalog-quoted lead time, since a part with a chronically unreliable supplier needs a different safety stock policy than one quoted the same nominal lead time from a reliable source.
Predict failure probability from asset condition
Where condition monitoring data exists on the parent equipment, predicted failure timing feeds directly into stocking decisions — a bearing showing early degradation signs shifts its spare from "reorder eventually" to "confirm in stock now."
Analyze consumption patterns across the fleet
Actual usage history across similar assets and sites reveals which parts are consumed more or less predictably than a generic reorder point assumes, refining stock levels toward real demand rather than a static formula.
Recommend a rebalanced stocking policy
The output is a per-part recommendation — increase, decrease, or hold — ranked by both risk reduction and capital freed, so the highest-impact changes can be actioned first rather than reviewing the entire catalog at once.
| Stocking Factor | Generic Reorder-Point Approach | AI-Optimized Approach |
|---|---|---|
| Criticality | Same policy across a part category | Scored per part against equipment-specific impact |
| Lead time | Catalog-quoted lead time assumed reliable | Actual historical supplier delivery performance |
| Failure timing | Not factored into stock level | Predicted from condition monitoring where available |
| Demand pattern | Static reorder point and quantity | Refined against fleet-wide consumption history |
| Review frequency | Annual or ad hoc | Continuous, updated as conditions change |
Your Warehouse Isn't Undersized or Oversized. It's Mis-Sized, Part by Part.
iFactory shows you exactly which SKUs are trapping capital and which ones are quietly under-protected — ranked by impact, not alphabetically.
A Composite Scenario: The Part That Was Never Flagged
Consider a mid-size upstream operator with a spare parts catalog running into the tens of thousands of SKUs across multiple field locations. A specific control valve actuator, used on a handful of wellhead systems, has always been stocked at one unit per field, following a generic rule applied to that entire actuator category years earlier. It has never been formally scored for criticality, because it was never involved in an incident and nobody had a reason to look at it specifically.
An AI-driven criticality review surfaces something the generic rule missed: this particular actuator model has a nine-week lead time from a single overseas supplier, and its failure would shut in a well responsible for a meaningful share of that field's daily production — a combination that puts it well above the stocking level a one-per-field default provides. At the same time, the same review flags a different, more expensive valve type stocked at three units across the same fields that has had zero failures in five years and sits on redundant equipment, meaning its actual risk profile justifies holding one, not three. Rebalancing both — increasing the actuator stock, decreasing the redundant valve stock — reduces overall inventory risk while roughly netting out the capital tied up, without a single new dollar spent on the total spare parts budget.
Where the Freed Capital Actually Goes
Spare parts optimization is often framed purely as a cost-cutting exercise, but the more useful framing is capital reallocation. Every dollar trapped in an overstocked, low-criticality part is a dollar not available to properly protect a genuinely critical one, or not available for anything else the business needs it for. The goal isn't a smaller warehouse for its own sake — it's a warehouse where the size of every position on the shelf actually reflects the risk it's protecting against.
Total capital held in parts flagged as overstocked relative to their criticality score — the clearest single number for how much capital reallocation opportunity exists in the current catalog.
The count and value of high-criticality parts currently stocked below their risk-adjusted recommended level, tracked as the primary exposure metric leadership should watch.
Production or maintenance delays specifically attributable to a part being unavailable when needed, tracked over time to show whether rebalancing is reducing real operational impact.
The share of total inventory value in parts with no consumption over a defined lookback period, tracked as the counter-metric to make sure freed capital isn't simply re-trapped elsewhere.
Building the Program: Roles, Cadence, and Common Mistakes
Who Should Own It
Spare parts optimization works best as a joint effort between maintenance and reliability, who understand failure risk and criticality, and supply chain or procurement, who own lead time relationships and carrying cost. Assigning it solely to procurement produces cost-driven decisions that under-protect critical equipment; assigning it solely to maintenance produces conservative overstocking without visibility into the capital cost.
Realistic Review Cadence
A quarterly rebalancing review, rather than an annual one, keeps stocking levels aligned with changing equipment condition and consumption patterns without creating constant procurement churn. Critical-part coverage gaps should be reviewed more frequently, as soon as they're flagged.
Common Mistake: Optimizing by Part Category
Treating all valves, all bearings, or all seals under one blanket policy ignores that two parts in the same category can carry completely different criticality and lead time profiles depending on which specific equipment they serve.
Common Mistake: Chasing Cost Reduction Alone
A program measured purely on inventory value reduction will eventually starve a critical part to hit a savings target. Pairing every reduction recommendation with its corresponding risk-coverage recommendation keeps the program balanced rather than one-directional.
How This Connects to Predictive Maintenance
Spare parts optimization delivers more value the closer it sits to condition monitoring and predictive maintenance data, because failure prediction is what turns a static criticality score into a dynamic, time-sensitive stocking signal. A part scored as moderately critical under a generic model can become urgently critical the moment vibration or thermal data on its parent equipment shows early degradation — and a stocking system that only updates annually has no way to react to that shift before the part is actually needed.
This is where a unified platform has a structural advantage over separate point solutions for inventory and condition monitoring. When failure prediction and spare parts recommendations run on the same data and the same asset hierarchy, a degrading bearing doesn't just trigger a maintenance work order — it simultaneously checks whether the replacement bearing is in stock, at the right location, with enough lead time margin before the predicted failure window, and flags a gap immediately if it isn't.
Fleet-Wide Visibility Changes the Math Entirely
A single-site view of spare parts inventory treats each warehouse as its own closed system, which is rarely how the underlying risk actually works. An operator running several field locations with similar equipment often has redundant safety stock scattered across multiple sites for the same part, each individually justified by that site's own conservative default, while a shared regional stocking position covering the same equipment fleet could carry meaningfully less total capital at an equivalent risk level — provided lead time between sites is short enough to make sharing practical.
The reverse pattern shows up just as often: a part that looks adequately stocked when reviewed site by site turns out, at the fleet level, to have every unit concentrated at locations with the lowest actual usage, while the sites running the equipment hardest carry none. Fleet-wide consumption and criticality analysis surfaces both patterns in the same pass, which is difficult to do manually across more than a handful of locations but straightforward once the data from every site feeds the same model.
Frequently Asked Questions
How does this integrate with our existing ERP or inventory management system?
iFactory connects to standard ERP and CMMS inventory data — part master records, consumption history, purchase orders, and lead time data — to build the criticality and demand models without requiring a separate inventory system. Recommendations are surfaced as a ranked action list that flows back into your existing procurement and stocking workflow rather than replacing it. Visit support for details on specific ERP integrations.
Do we need condition monitoring data on our equipment for this to work?
No — criticality scoring, lead time risk, and consumption pattern analysis all work from procurement and maintenance history alone and provide meaningful optimization on their own. Where condition monitoring data exists on parent equipment, it sharpens the failure-timing component of the recommendation further, but it's an enhancement rather than a prerequisite for getting started.
How long does an initial spare parts assessment take?
An initial criticality and stocking review across an existing catalog typically surfaces the highest-impact rebalancing opportunities within the first few weeks, since the analysis works from data already sitting in your ERP and maintenance systems rather than requiring new data collection. Ongoing continuous optimization then keeps recommendations current as consumption patterns, supplier performance, and equipment condition evolve. Book a demo to see a sample assessment timeline.
Will this recommend cutting stock on parts we consider critical for a reason not in the data?
The model surfaces recommendations, ranked by risk and capital impact, for review by the people who own the stocking decision — it does not automatically execute changes. Where field or engineering judgment identifies a risk factor not captured in the historical data, such as a known upcoming equipment change, that context feeds back into the criticality score so the model's future recommendations reflect it.
Does this work across multiple field locations with separate warehouses?
Yes — consumption and criticality patterns are analyzed across the full multi-site fleet, which often reveals opportunities a single-site view would miss, such as a part overstocked at one location while genuinely under-protected at another with similar equipment. Fleet-wide visibility is one of the more consistently high-value findings in a first assessment.
Every SKU in Your Catalog Deserves a Stocking Level Sized to Its Actual Risk — Not Its History
iFactory shows you exactly where capital is trapped and exactly where risk is exposed, ranked by impact so you know where to start.