Every missed medication round, every unlogged fall incident, every understaffed shift — these are not just operational gaps. They are the building blocks of a CMS survey failure, a deficiency citation, and ultimately, a 1-star rating that costs your facility thousands in lost referrals and heightened regulatory scrutiny every single month.
Is Your Nursing Home Chain Leaving Star Ratings on the Table?
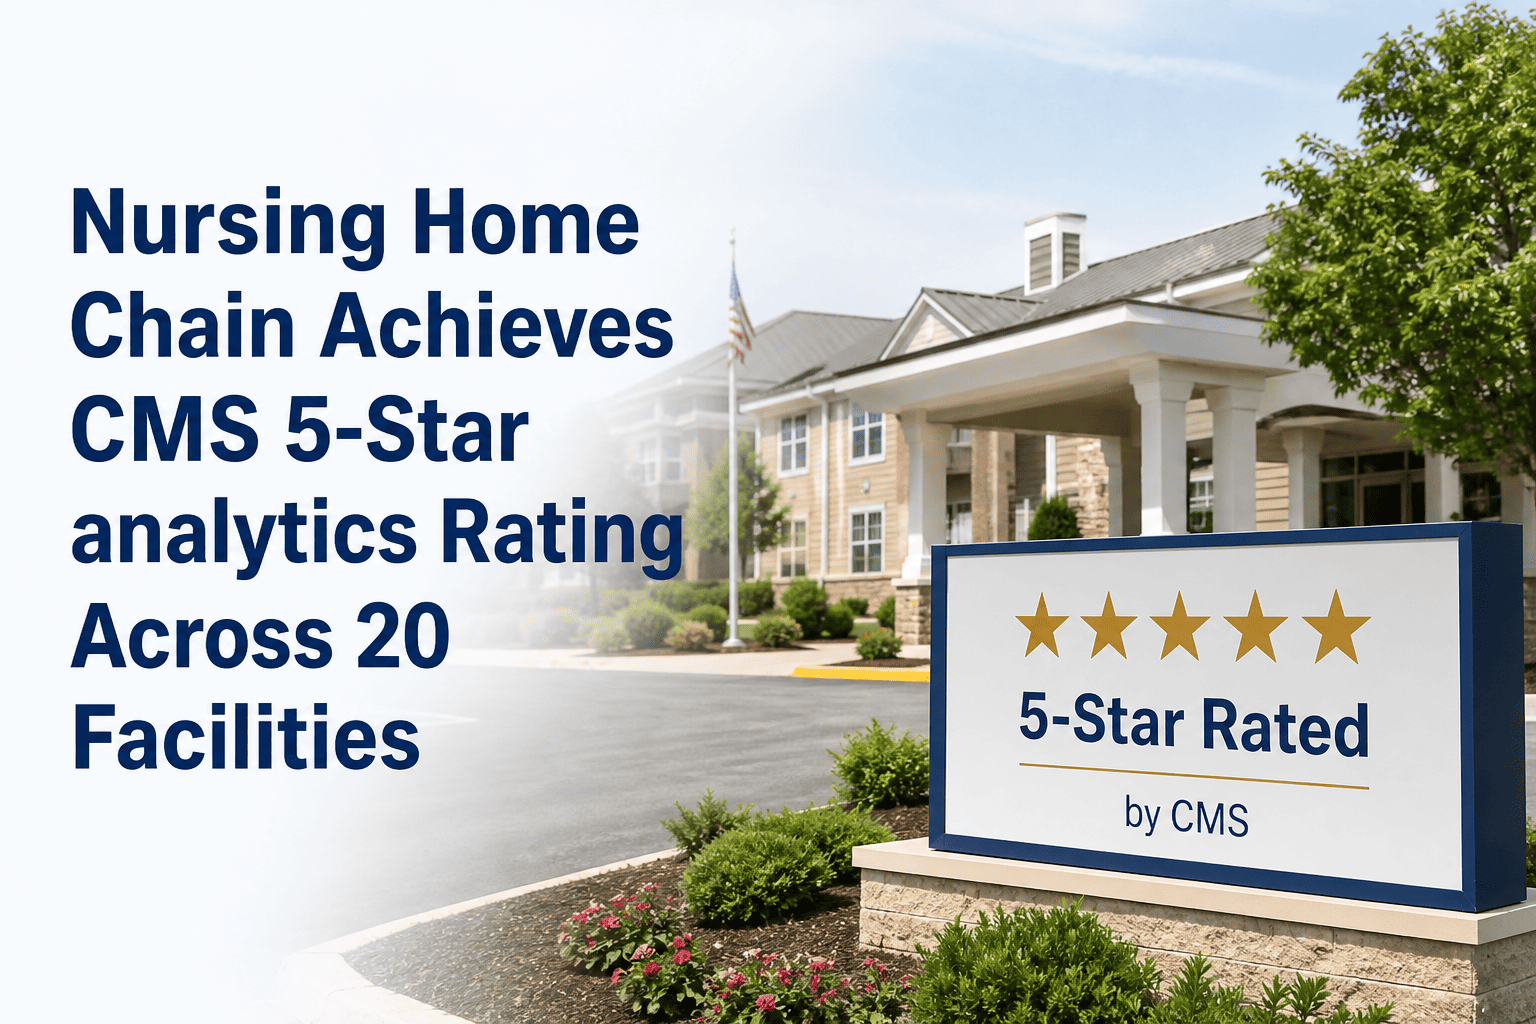
iFactory unified analytics helped one 20-facility chain achieve CMS 5-star ratings across every site — and measurably reduced compliance risk, staff burnout, and operational leakage.
From Fragmented Data to 5-Star Performance Across 20 Sites
A regional nursing home operator managing 20 long-term care facilities faced a crisis familiar to multi-site LTC leaders: no unified view of clinical quality, compliance gaps surfacing only during surveys, and administrator burnout from manually chasing metrics. Here is what iFactory's Multi-Site Management platform delivered:
The Hidden Cost of Siloed Long-Term Care Operations
Multi-facility nursing home operators consistently suffer from what iFactory clinical architects call "Invisible Hemorrhage" — revenue, quality scores, and staff capacity draining through operational gaps that no single dashboard was ever tracking. The warning signs are universal:
Lagging Quality Metrics
QM scores reported weeks after the measurement window — leaving no time for clinical course correction before a CMS survey window opens.
Manual Compliance Burdens
DONs and administrators spending 12–18 hours per week compiling MDS submissions, QAPI reports, and staffing disclosures from disconnected systems.
No Chain-Wide Visibility
Regional VPs flying blind across sites, unable to identify which facility's fall rate or antipsychotic usage would trigger the next CMS deficiency flag.
Reactive Survey Preparation
Survey prep activated only after receiving notice — missing the 12-month window of clinical trend data that separates a D-level citation from a clean survey.
Legacy Friction vs. iFactory Optimized Excellence
The operational gap is not abstract — it is measurable, and it is costing your chain star ratings today.
| Operational Area | Legacy Friction State | iFactory Optimized State | Clinical & Financial Impact |
|---|---|---|---|
| QM Score Visibility | Retroactive, 30–60 day lag | Real-time dashboard per facility | High ROI |
| MDS Submission Compliance | Manual, error-prone workflows | Automated validation and submission | High ROI |
| Staffing Level Reporting | Spreadsheet aggregation by hand | Auto-populated PBJ payroll data | Medium ROI |
| Fall & Incident Trending | Per-facility, no cross-chain view | Unified chain-wide risk heatmap | High ROI |
| Survey Deficiency Tracking | Post-survey spreadsheet entry | Predictive deficiency risk scoring | High ROI |
| QAPI Reporting Cycles | Monthly, manual compilation | Continuous, automated QAPI feeds | Medium ROI |
How iFactory Solves the Three Critical Pressure Points in LTC
Staff Burnout Reduction
- Eliminates 14+ hours/week of manual reporting per administrator
- Auto-generates compliance documentation from clinical workflows
- Reduces duplicated data entry across EHR and CMS portals
- Frees DONs to focus on clinical leadership, not spreadsheets
Resident Safety Analytics
- Real-time fall risk stratification across all 20 facilities
- Automated antipsychotic usage flagging for QM compliance
- Pressure injury trend analysis with early intervention alerts
- Hospitalization pattern detection to reduce avoidable transfers
Patient Throughput & Census
- 5-star rating directly improves referral pipeline from hospitals
- Bed utilization analytics optimize payer mix and occupancy rates
- Discharge planning visibility reduces length-of-stay variances
- Rehospitalization reduction tied directly to star domain scores
The iFactory 5-Star Activation Pathway
Operational Gap Audit
iFactory architects baseline your current QM scores, staffing levels, and compliance posture across all facilities to identify highest-priority improvement levers.
Data Integration & Unification
Connect existing EHR, PCC, PointClickCare, and MDS submission systems into the iFactory unified analytics layer — no rip-and-replace required.
Real-Time Dashboard Activation
Deploy chain-wide and facility-level dashboards surfacing live QM domain scores, staffing hours, and incident trends to regional leadership and site administrators.
Predictive Survey Readiness
AI-driven deficiency risk scoring flags clinical patterns associated with CMS citation history — giving your team a 90-day early warning window before surveys open.
Continuous QAPI Optimization
Automated QAPI cycle reporting and performance benchmarking against peer facilities ensures every site maintains and improves its star rating quarter over quarter.
CMS 5-Star Analytics for Nursing Home Chains — Key Questions
Does iFactory integrate with PointClickCare and other major LTC EHRs?
Yes. iFactory connects with PointClickCare, MatrixCare, American HealthTech, and all major MDS submission platforms via vendor-neutral API architecture — no system replacement required.
How quickly can a 20-facility chain go live on the iFactory platform?
Most multi-site deployments achieve full dashboard activation within 6–8 weeks. The Operational Gap Audit in week one identifies quick-win QM improvements that deliver measurable results before full rollout completes.
Is iFactory compliant with HIPAA and CMS data security requirements?
Absolutely. iFactory operates on HIPAA-compliant infrastructure with AES-256 encryption, role-based access controls, and full audit trail logging for every data action across all facilities. Book a Demo to review our security architecture.
What is the typical ROI timeline for a nursing home chain?
Chains typically see a measurable reduction in deficiency citations within the first survey cycle. Financial ROI — from reduced citation penalties, improved census from higher star ratings, and eliminated manual reporting labor — typically reaches positive within 90 days of full deployment.
Stop Losing Star Ratings to Data You Already Have
iFactory turns your existing clinical data into a real-time CMS 5-star engine — across every facility, every shift, every survey cycle.