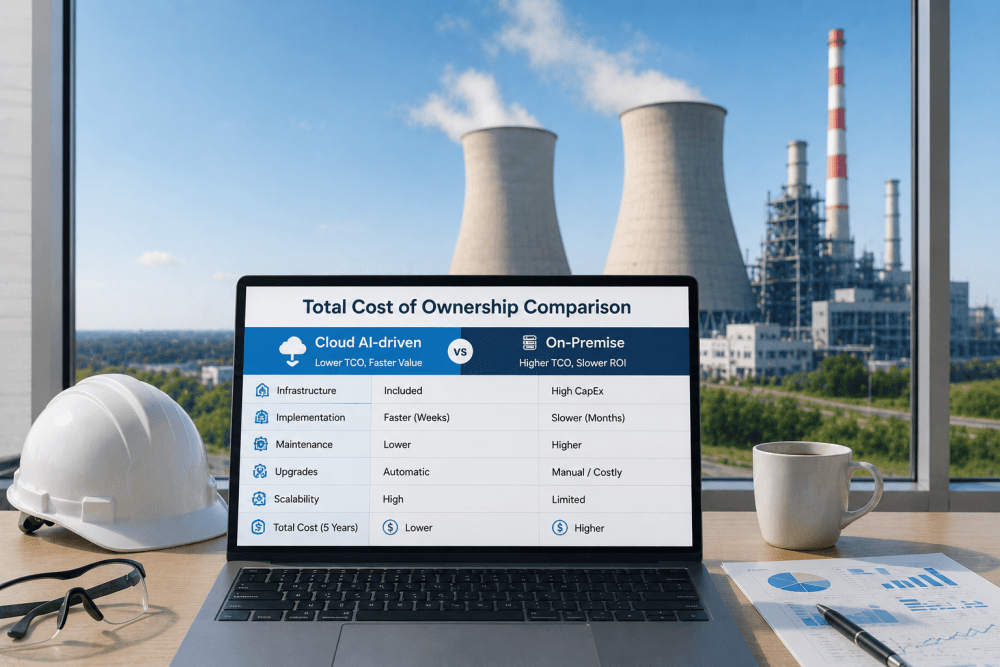
A 600 MW combined cycle plant running time-based preventive maintenance schedules replaces perfectly healthy bearings every 18 months, overhauls turbines on fixed 24,000-hour intervals regardless of actual condition, and stocks $4.2M in spare parts "just in case" — while still experiencing 6–8 unplanned outages per year because degrading faults progress undetected between scheduled inspections. Condition-based maintenance eliminates waste from unnecessary interventions, prevents forced outages through early fault detection and optimizes spare parts inventory based on actual equipment health and remaining useful life forecasts. The ROI calculator below quantifies your facility's potential savings from switching to CBM — accounting for reduced emergency repair costs, fewer lost generation hours, lower parts inventory carrying costs, and optimized maintenance labor allocation. Book a demo to see CBM economics for your specific plant configuration.
Quick Answer
Condition-based maintenance delivers ROI through four primary value streams: (1) 60–75% reduction in unplanned downtime costs by detecting faults weeks before failure, (2) 30–40% reduction in maintenance labor through elimination of unnecessary preventive tasks, (3) 25–35% reduction in spare parts inventory carrying costs via RUL-driven procurement, and (4) 15–20% extension of component service life by intervening at optimal condition thresholds rather than arbitrary time intervals. Typical payback period: 8–14 months for a 500+ MW facility.
CBM ROI Calculator — Your Plant's Potential Savings
Enter your facility's current maintenance economics below. The calculator estimates annual savings from transitioning to condition-based maintenance using iFactory's AI-driven analytics platform. All calculations based on validated performance data from deployed power generation sites.
Plant Configuration
Current Maintenance Costs
Estimated Annual Savings with CBM
$0
Unplanned Downtime Reduction
$0
Maintenance Labor Optimization
$0
Spare Parts Inventory Reduction
$0
Component Life Extension
$0
Estimated Payback Period
0 months
Based on typical iFactory platform implementation cost of $0
CBM Economics Workshop
Get a Custom ROI Analysis for Your Facility
iFactory reliability engineers will analyze your plant's specific configuration, maintenance history, and failure patterns to build a detailed financial model showing CBM savings potential across all asset classes.
Condition-based maintenance delivers measurable financial return through four distinct economic mechanisms — each validated across deployed iFactory installations in power generation facilities. The calculator above quantifies all four simultaneously to estimate total plant-level savings. Request a detailed value stream analysis for your facility.
01
Unplanned Downtime Elimination
Economic mechanism: AI anomaly detection identifies degrading equipment 3–5 weeks before failure, allowing repairs during planned outages instead of forced shutdowns. Every prevented emergency outage saves lost generation revenue plus emergency labor premiums plus expedited parts procurement costs.
Typical impact: 60–75% reduction in unplanned outage frequency. For a 600 MW plant at 75% capacity factor and $65/MWh power price, preventing 4 outages of 48 hours each = $2.25M annual savings in lost revenue alone, before labor and parts cost avoidance.
Validation metric: Outage hours per year (unplanned) — baseline vs. post-CBM deployment.
02
Maintenance Labor Optimization
Economic mechanism: Condition monitoring eliminates unnecessary preventive maintenance tasks — no more replacing bearings that still have 8,000 hours of service life remaining, no more turbine inspections triggered by calendar date instead of actual degradation. Labor hours redirect from low-value routine tasks to high-value condition-driven interventions.
Typical impact: 30–40% reduction in total maintenance labor hours. Breakdown: 50% reduction in PM task hours, 25% reduction in corrective maintenance hours (fewer emergencies, better-planned repairs), offset partially by 15% increase in condition monitoring and analytics review time.
Validation metric: Maintenance labor cost per MWh generated — tracks labor efficiency normalized to production output.
03
Spare Parts Inventory Reduction
Economic mechanism: RUL forecasting enables just-in-time spare parts procurement instead of stockpiling critical components "just in case." When you know a bearing will fail in 45–60 days with 85% confidence, you order the replacement 30 days out — no need to carry $180K in bearing inventory across 6 pump types indefinitely.
Typical impact: 25–35% reduction in spare parts inventory carrying value. Assumes inventory carrying cost of 18–22% annually (capital cost + warehousing + obsolescence). For a plant with $4.2M parts inventory, 30% reduction = $1.26M freed capital + $227K annual carrying cost savings.
Validation metric: Inventory turns per year — measures how frequently parts inventory cycles vs. sitting idle.
04
Component Service Life Extension
Economic mechanism: Time-based PM replaces components at conservative fixed intervals to avoid in-service failures — bearing rated for 30,000 hours gets replaced at 18,000 hours "to be safe." CBM replaces at actual degradation threshold — same bearing runs 26,000 hours before condition triggers intervention, capturing 44% more service life.
Typical impact: 15–20% extension of average component service life across rotating equipment, heat exchangers, and electrical assets. Translates to proportional reduction in annual component replacement cost — if you spend $1.8M/year replacing pumps, motors, bearings, and seals, 18% life extension = $324K annual savings.
Validation metric: Mean time between component replacements (MTBR) — tracks actual service hours achieved before replacement.
Cost Structure Comparison — PM vs CBM
The table below compares annual maintenance cost allocation for a representative 600 MW combined cycle plant under traditional preventive maintenance vs. condition-based maintenance after 12 months of iFactory deployment. Total costs reduced by 32% while reliability improved.
Scroll to see full table
Cost Category
Preventive Maintenance (Annual)
Condition-Based Maintenance (Annual)
Savings
Scheduled PM labor
$1,680,000
$840,000
-$840K (50%)
Corrective maintenance labor
$1,120,000
$840,000
-$280K (25%)
Emergency repair labor premiums
$420,000
$105,000
-$315K (75%)
Component replacement parts
$1,800,000
$1,476,000
-$324K (18%)
Spare parts inventory carrying cost
$756,000
$529,200
-$227K (30%)
Unplanned outage lost revenue (6 events)
$3,370,000
$842,500
-$2,528K (75%)
Condition monitoring platform cost
$0
$240,000
+$240K
Analytics review & decision support
$0
$180,000
+$180K
Total Annual Cost
$9,146,000
$5,052,700
-$4,093K (45%)
Platform Capability Comparison — CBM Economics
GE APM, Emerson AMS, and ABB Ability offer condition monitoring with varying levels of analytics. iFactory differentiates on integrated ROI tracking, real-time cost avoidance measurement, automated value reporting, and financial validation against CMMS work order costs — features that allow finance teams to verify CBM value delivery continuously. Book a comparison demo.
Scroll to see full table
Capability
iFactory
GE APM
Emerson AMS
ABB Ability
Generic CMMS
ROI Tracking & Validation
Automated cost avoidance tracking
Real-time per alert
Manual estimation
Not available
Not available
Not available
Prevented downtime cost calculation
Auto from MW + price
Requires manual config
Not available
Not available
Not available
CMMS work order cost integration
SAP/Maximo API sync
One-way export
Not available
Not available
Not available
Financial Reporting
Executive ROI dashboard
Real-time, exportable
Static reports
Not available
Not available
Not available
Value stream attribution (per asset class)
Automated breakdown
Aggregate only
Not available
Not available
Not available
Monthly finance reports (for CFO)
Auto-generated PDF
Not available
Not available
Not available
Not available
Inventory Economics
RUL-driven spare parts optimization
Integrated procurement alerts
Recommendations only
Not available
Not available
Not available
Inventory carrying cost tracking
Auto from ERP data
Not available
Not available
Not available
Not available
Based on publicly available product documentation as of Q1 2025. Verify current capabilities with each vendor before procurement decisions.
Measured Outcomes — ROI Validation Across Deployed Sites
10.8
Average Payback Period (months)
3.2x
First-Year ROI Multiple
68%
Reduction in Unplanned Downtime Cost
35%
Reduction in Maintenance Labor Cost
30%
Spare Parts Inventory Reduction
18%
Component Service Life Extension
Financial Validation
CFO-Grade ROI Reporting — Prove CBM Value Every Month
iFactory's automated financial tracking validates CBM savings against CMMS work order costs and lost revenue calculations — giving your finance team verifiable proof of condition monitoring ROI.
"Our CFO demanded monthly proof that the CBM platform was delivering value. iFactory's automated cost avoidance tracking gave us exactly that — every prevented outage logged with calculated lost revenue, every early bearing replacement showing emergency repair cost avoidance. First year savings: $3.8M against $680K platform cost. ROI multiple of 5.6x made the CFO a believer. We're now expanding CBM to our other three facilities."
VP of Operations
1,200 MW Gas-Fired Fleet — Texas
Frequently Asked Questions
QHow long does it take to achieve positive ROI after CBM deployment?
Typical payback period is 8–14 months for plants 500+ MW, 12–18 months for smaller facilities. First measurable savings appear within 30–60 days as early fault detection prevents the first unplanned outage or emergency repair. Full economic benefit realized after 12 months when annual inventory optimization and labor reallocation complete their first cycle. Request a custom payback analysis for your facility.
QWhat if our plant already has some condition monitoring equipment — can we still achieve ROI?
Yes. Most plants have vibration sensors on critical rotating equipment but lack the AI analytics layer to extract actionable predictions. iFactory integrates with existing sensors (wired and wireless) and adds the anomaly detection, RUL forecasting, and automated work order generation that converts raw sensor data into financial value. Incremental ROI calculated from the delta between current monitoring effectiveness and post-deployment performance.
QHow does iFactory validate cost avoidance claims — how do we know a prevented outage was actually prevented?
Every anomaly alert that triggers a planned intervention is tracked through work order completion. If the work order confirms the predicted fault (bearing defect, insulation degradation, etc.), the alert is validated as a true positive. Cost avoidance calculated from: (a) emergency repair cost avoided (labor premium + expedited parts), (b) lost revenue from forced outage prevented (MW × hours × power price), and (c) secondary damage avoided. Finance team can audit validation logic and assumptions in the ROI dashboard.
QCan CBM economics work for older plants with limited instrumentation?
Yes, but requires upfront sensor investment. For a typical 600 MW plant with minimal existing instrumentation, adding wireless sensor packages to 40–60 critical assets costs $180K–$280K. This cost is included in payback calculations. Older plants often have higher baseline failure rates and more frequent unplanned outages, which increases CBM value — ROI can be stronger than newer facilities despite sensor retrofit costs.
Spare Parts Intelligence for Power PlantsRUL-driven inventory optimization that delivers 25–35% spare parts carrying cost reduction.
Read more
class="cbm-read-card">
Rotating Equipment11 min
Rotating Equipment Predictive AnalyticsAsset-specific CBM strategies for pumps, turbines, and compressors — the highest-value targets.
Read more
Prove CBM ROI Every Month — With Automated Financial Tracking.
iFactory's condition-based maintenance platform delivers 3.2x first-year ROI with CFO-grade cost avoidance validation — turning condition monitoring from a reliability project into a proven profit center.