Electrostatic precipitators and baghouse fabric filters are the last mechanical barrier between combustion flue gas and the stack, and when either system loses collection efficiency, the consequence is not a gradual drift but an opacity spike that a continuous opacity monitor reports to regulators within minutes. A single failed transformer-rectifier set, a stuck rapper, or a handful of torn filter bags can push particulate emissions past a permit limit before a process engineer even receives an alarm worth acting on. The difficulty is that ESPs and baghouses fail through completely different mechanisms, corona discharge and rapping cycles on one side, differential pressure and bag integrity on the other, so a single fixed maintenance calendar rarely catches either system's real condition. iFactory AI Particulate Control Analytics reads rapper timing, transformer-rectifier performance, and bag differential pressure together, correlating each against opacity in real time. Book a Demo to see how iFactory keeps your particulate control system inside its collection efficiency design margin.
Particulate Control Failures Show Up on the Stack Before They Show Up on a Maintenance Ticket
AI analytics for ESP and baghouse systems that track collection efficiency, rapper timing, bag condition, and pressure drop so particulate emissions stay below permit limits.
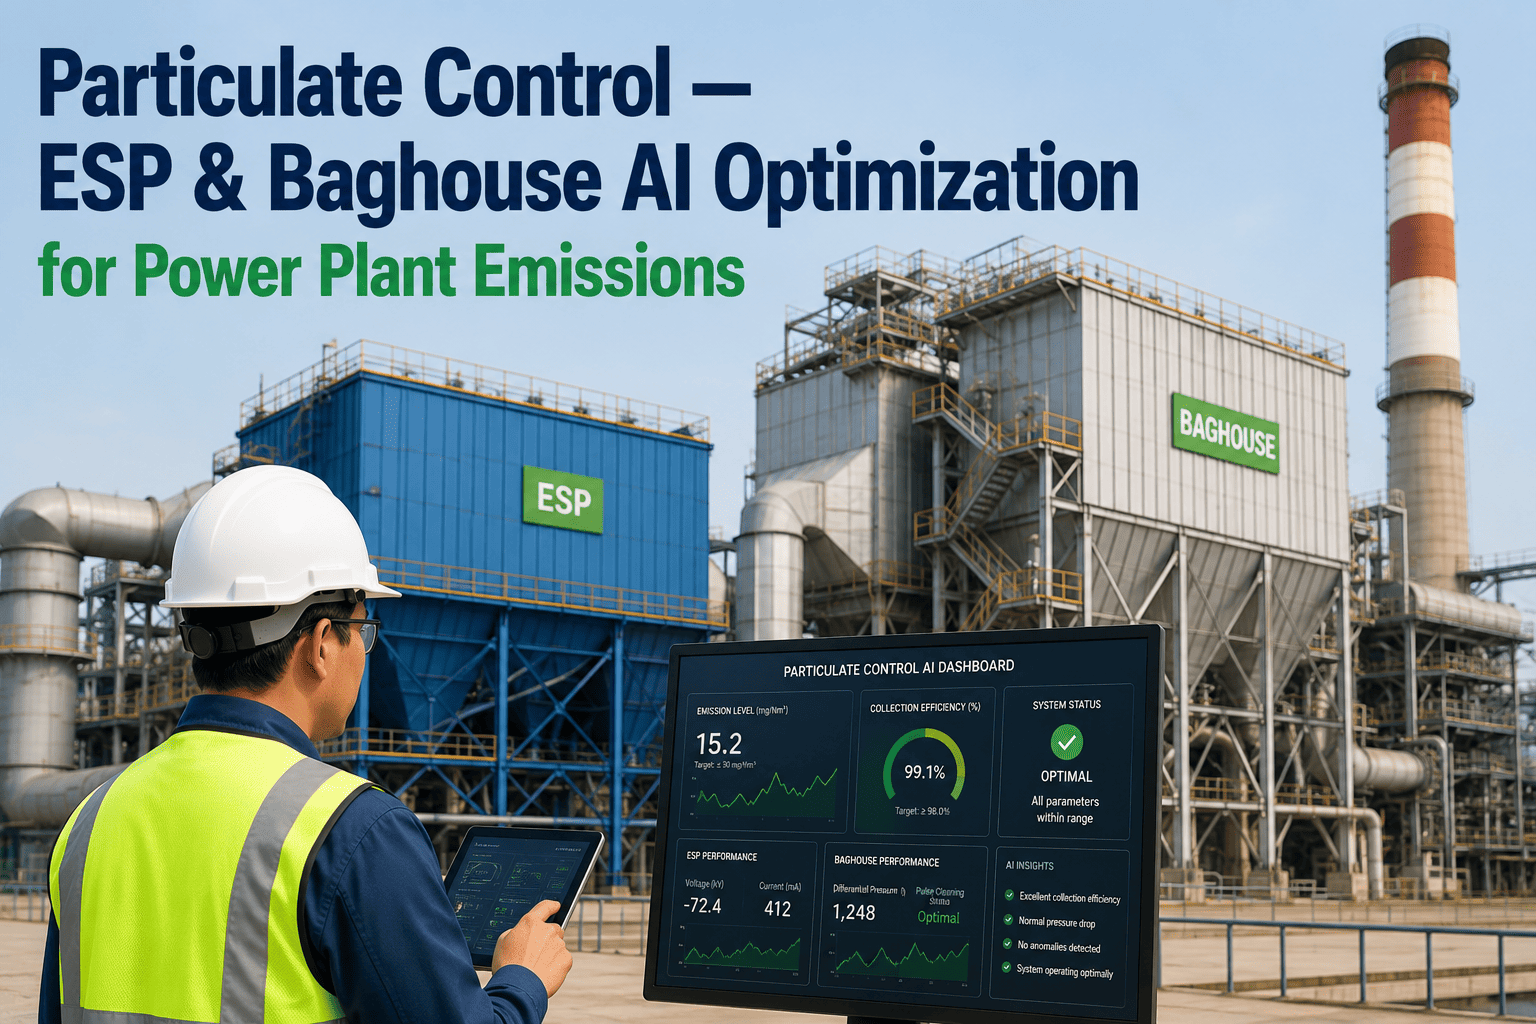
ESP vs. Baghouse: Two Systems, Two Failure Patterns
Process engineers running either technology, or a hybrid configuration, need visibility tuned to how that specific system actually degrades.
Electrostatic Precipitator
99.5%+
Collection efficiency when operating correctly
Charges particles with a corona discharge and collects them on grounded plates, then dislodges the collected dust with timed mechanical rappers. Transformer-rectifier set failures, rapper malfunctions, and hopper overflows each produce a measurable opacity spike within minutes.
Baghouse Fabric Filter
99.9%+
Collection efficiency when bags are intact
Captures particulate on woven or felted filter bags cleaned by periodic pulse-jet or reverse-air cycles. A single torn bag causes an immediate opacity increase, while rising differential pressure across the bank reduces airflow and can force a load reduction if left unmanaged.
The Signals That Actually Predict a Collection Efficiency Drop
Rapper Sequence Timing
Deviation from optimized rapper intensity and timing per section flags either under-rapping, which lets dust cake build and reduce field efficiency, or over-rapping, which re-entrains collected particulate into the gas stream.
TR Set Spark Rate
Transformer-rectifier spark rate and secondary current trends reveal field-by-field corona performance, catching a weakening TR set before its section's collection efficiency visibly declines.
Bag Differential Pressure
Compartment-level differential pressure trending distinguishes normal dust cake loading from abnormal blinding, guiding cleaning cycles based on actual condition rather than a fixed schedule.
Hopper Level and Evacuation
Hopper fill trends flag evacuation system slowdowns before an overflow re-entrains collected dust back into the gas stream and drives an avoidable opacity event.
Opacity Correlation
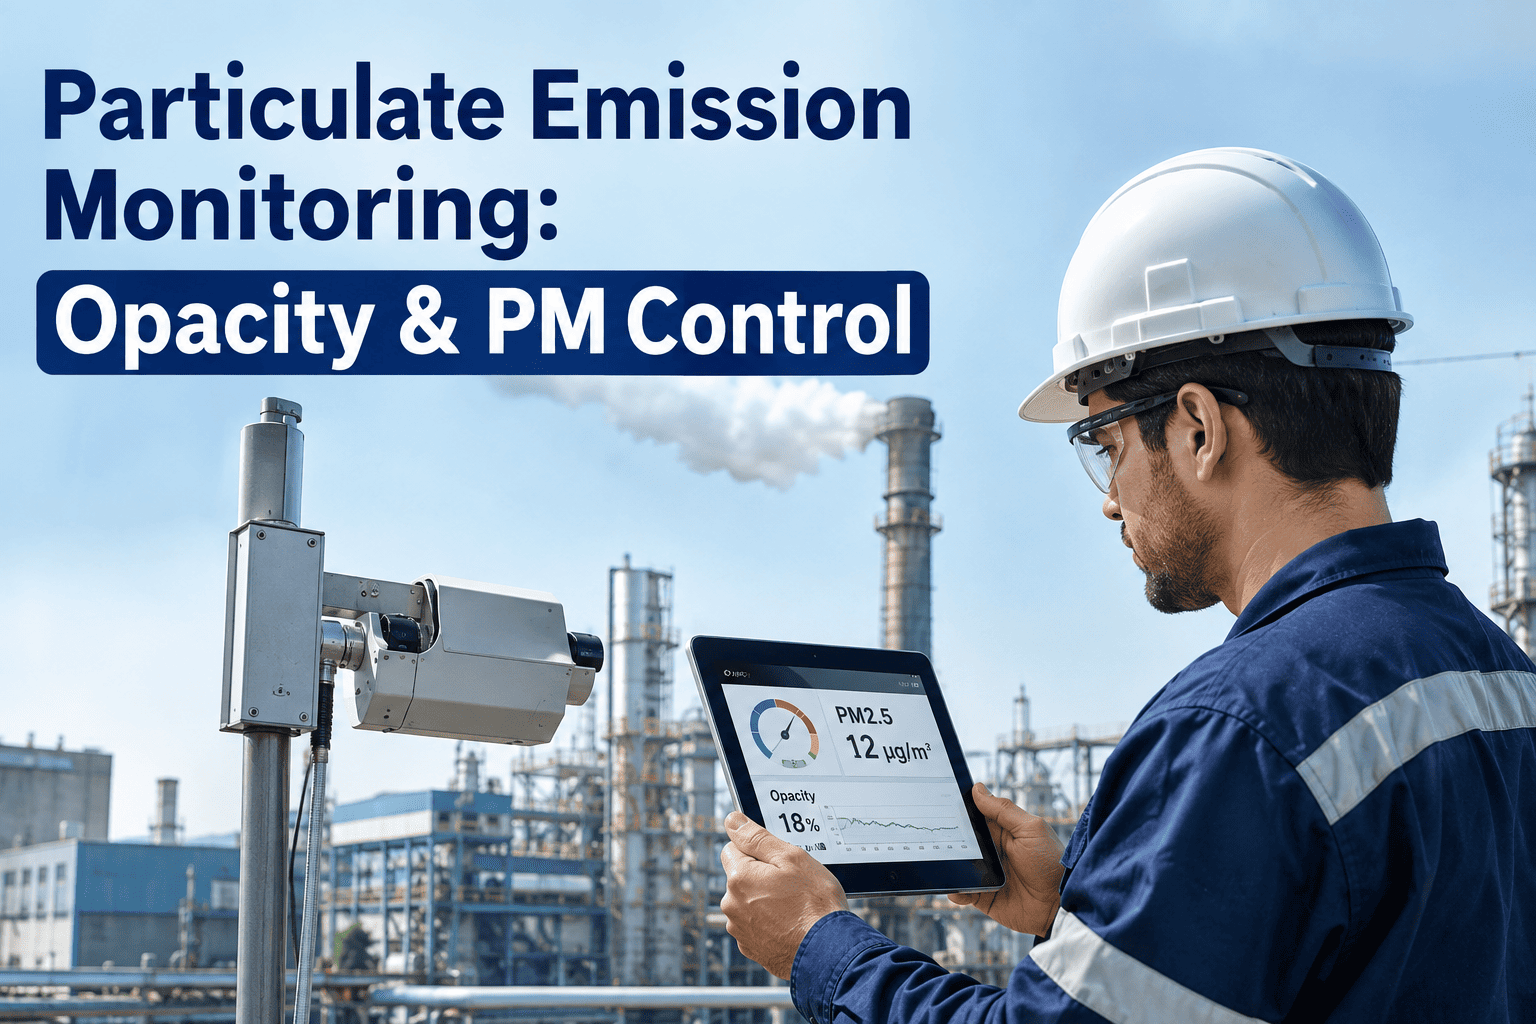
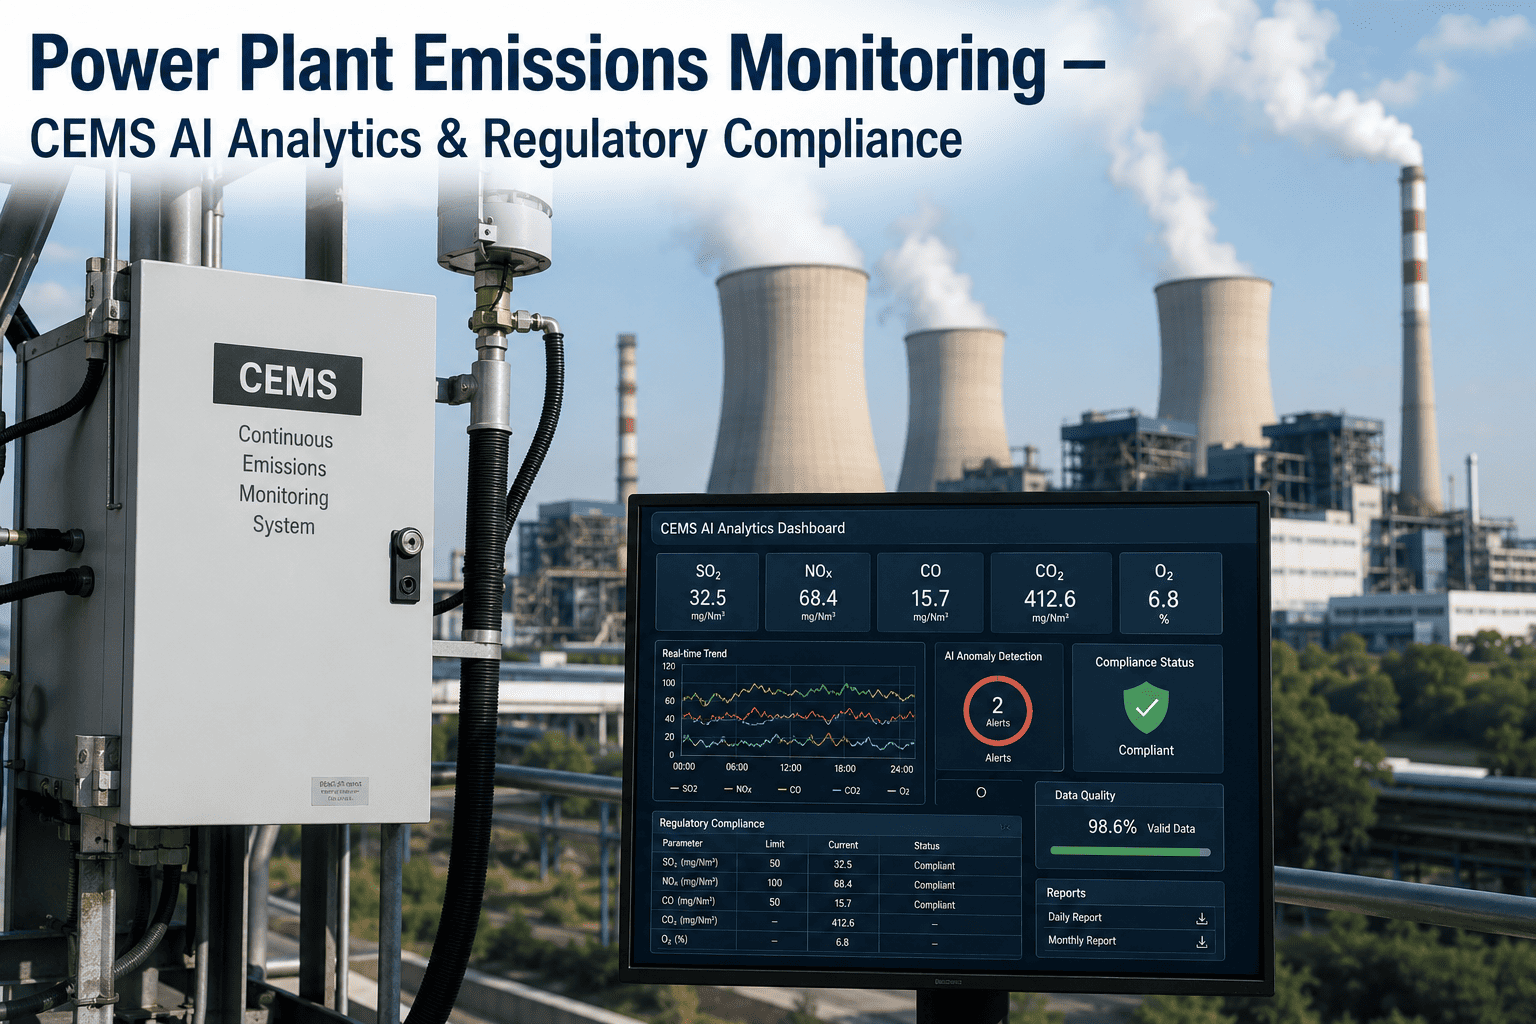
Every mechanical signal above is mapped directly against continuous opacity monitoring data, so the alert your team receives already points to the likely mechanical cause behind a rising trend.
Air-to-Cloth Ratio Drift
For baghouse and hybrid COHPAC-style configurations, effective air-to-cloth ratio is tracked against design specification to catch conditions that shorten bag life through fabric fatigue.
Optimizing Rapper Timing Without Guesswork
Step 1
Establish per-section baselines
Historical dust loading and rapping intensity per field or compartment are analyzed to establish what normal cleaning cycles look like for your specific plant configuration.
Step 2
Detect under- and over-rapping
Sections rapped too lightly show gradual efficiency decline from cake buildup, while sections rapped too aggressively show opacity spikes tied to re-entrainment. Both patterns are flagged separately.
Step 3
Recommend adjusted sequencing
Rapping intensity and interval recommendations are generated per section, reducing unnecessary mechanical stress while maintaining collection efficiency at target levels.
Step 4
Validate against opacity trend
Adjusted sequencing is validated against continuous opacity data over subsequent operating cycles, confirming the change actually improved performance before it becomes standard practice.
Scheduled Maintenance vs. Condition-Based Particulate Control
Why an Opacity Spike Rarely Stays Contained to the Stack
A particulate control failure sends effects downstream through the plant far beyond the immediate emissions event, which is part of why process engineers treat these systems as an emergency-response priority rather than a routine maintenance line item.
ID Fan Load Increases
Rising differential pressure across a fouling baghouse or a struggling ESP field forces induced draft fans to work harder to maintain flue gas flow, increasing auxiliary power consumption and mechanical stress on fan bearings.
Forced Load Curtailment
When differential pressure or opacity crosses a hard operating limit, plants are sometimes forced to reduce load to stay within permit conditions, directly reducing generation revenue until the underlying issue is resolved.
Downstream FGD Chemistry Impact
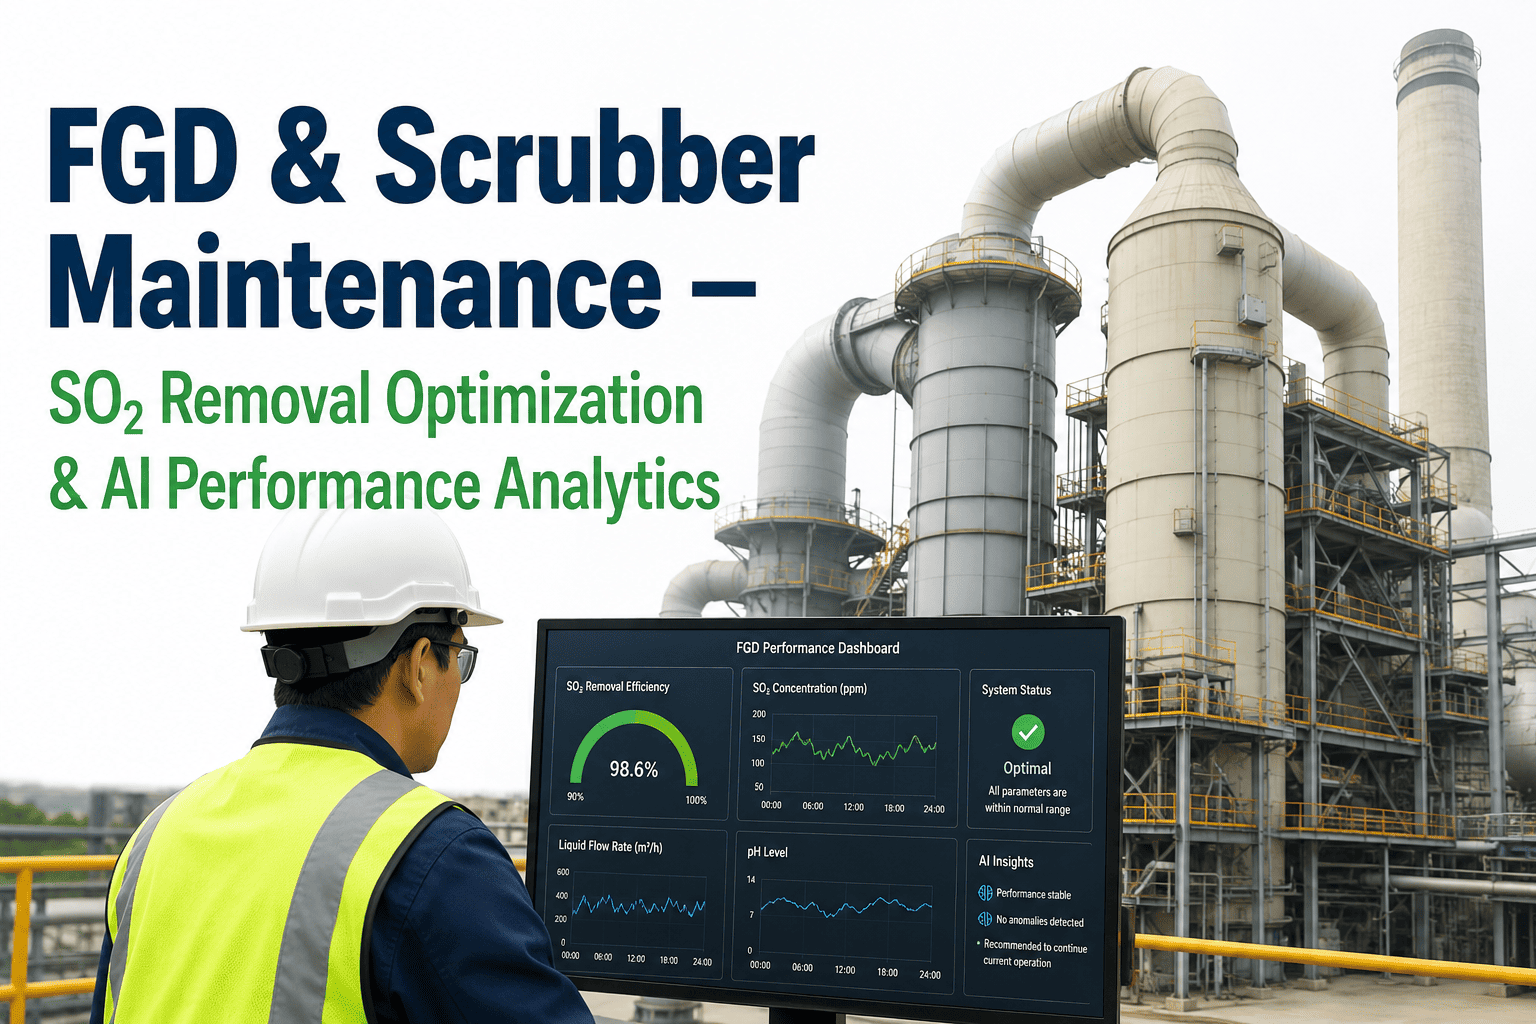
Particulate carryover past a degraded ESP or baghouse adds solids loading to a downstream wet scrubber, straining absorber chemistry and accelerating the same scaling issues that reduce SO2 removal efficiency.
Public Reporting Exposure
Continuous opacity data is transmitted to regulators in near real time at most coal plants, meaning an exceedance is visible to agencies well before an internal report is even drafted, narrowing the response window considerably.
Ash Handling System Strain
A hopper evacuation slowdown or a poorly timed rapping sequence increases the volume and irregularity of ash reaching downstream conveying and disposal systems, adding wear and unplanned service events to equipment that is easy to overlook until it fails.
Give Your Particulate Control System the Same Visibility as Your Boiler
iFactory connects to your existing ESP and baghouse control systems, correlating mechanical condition with opacity so your team acts before a stack test finds the problem for you.
Deployment Snapshot
01
Instrumentation Review
Confirm existing TR set, differential pressure, and opacity data available through your current control system.
02
Baseline Modeling
Build per-section performance baselines specific to your plant's fuel, load profile, and equipment configuration.
03
Alert Calibration
Process engineers and maintenance teams jointly tune thresholds so alerts are actionable, not noisy.
04
Full Rollout
Live dashboards and condition-based maintenance recommendations go plant-wide across all ESP or baghouse fields.
Coal Plant Baghouse Case Study
Case Study — Appalachian Coal Plant Baghouse
A process engineering team managing a 600 MW coal plant's baghouse was replacing bags on a fixed three-year cycle regardless of individual compartment condition, while still experiencing occasional opacity spikes traced back to undetected torn bags between inspections. After deploying iFactory's particulate control analytics, compartment-level differential pressure trending identified two compartments with abnormal pressure drop patterns consistent with bag damage weeks before either would have been caught on the fixed replacement schedule. Targeted replacement in those compartments alone, rather than a full bank change-out, avoided both an unplanned opacity event and unnecessary bag replacement cost elsewhere in the bank.
2
Compartments flagged for targeted bag replacement
0
Opacity exceedances since deployment
30%
Reduction in unnecessary bag replacement cost
What Process Engineers Say
We were replacing bags on a calendar because that was the only way we felt confident we would not get caught by a torn bag. Now we can see which compartments are actually degrading and which ones have years of life left. Our last opacity exceedance was over a year ago, and we are not throwing away good bags anymore just to be safe.
Process Engineer
Coal-Fired Generation Facility, Appalachian Region
Frequently Asked Questions
Does iFactory support both ESP and baghouse systems, or only one technology?
iFactory supports both electrostatic precipitators and baghouse fabric filters, along with hybrid configurations such as COHPAC-style compact hybrid particulate collectors. Monitoring models are tuned to the specific failure mechanisms of each technology rather than applying a single generic model.
Book a Demo to see the configuration for your specific system.
Can this reduce how often we replace filter bags?
Yes, in most deployments. By identifying which specific compartments show abnormal differential pressure trends rather than replacing an entire bank on a fixed schedule, plants typically reduce unnecessary bag replacement while catching genuinely degraded compartments earlier than a calendar-based approach would.
How does rapper timing optimization avoid making opacity worse?
Every recommended change to rapping intensity or interval is validated against continuous opacity trend data over subsequent operating cycles before being treated as standard practice, so a poorly tuned adjustment is caught and corrected rather than left running unchecked.
What data does iFactory need from our existing control system?
Most plants already have TR set current and spark rate data, compartment differential pressure, hopper level indicators, and continuous opacity monitoring data available through their existing DCS or PLC systems.
Talk to Support about reviewing what is already available before deployment begins.
How quickly can we expect to see actionable insight after go-live?
Baseline modeling using historical data is typically complete within the first two weeks, with live anomaly detection active from that point forward. Most process engineering teams identify their first actionable finding, commonly an under-performing TR set or a compartment with abnormal pressure trending, within the first month of full monitoring.
Stop Waiting for a Stack Test to Tell You What Your Data Already Knows
iFactory gives process engineers continuous visibility into ESP and baghouse condition, correlated directly against opacity, so particulate control stays inside permit limits every shift.
Rapper timing and TR set health tracking
Compartment-level bag differential pressure trending
Root cause attached to every opacity trend automatically
Works across ESP, baghouse, and hybrid configurations