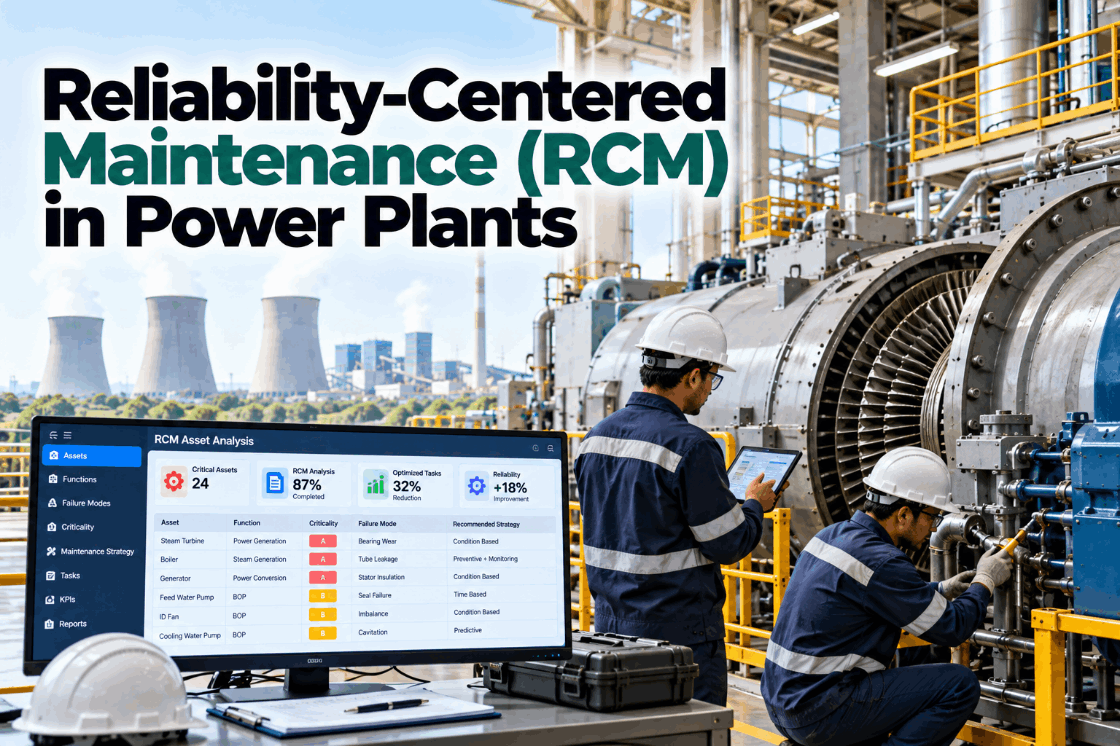
For plant managers and maintenance directors in power generation, the decision to invest in predictive maintenance technology is no longer a question of if, but how to build an airtight business case that secures executive approval. With aging infrastructure, tightening regulatory compliance, and relentless pressure to maximize uptime, the financial stakes have never been higher. A single unplanned outage at a combined-cycle gas turbine plant can cost upwards of $500,000 per day in lost revenue and replacement power costs, not to mention the cascading effects on grid reliability and contractual penalties. This comprehensive guide provides a data-driven framework to quantify the return on investment (ROI) of a predictive maintenance program, leveraging real-world benchmarks from the power generation industry. You will learn to model cost avoidance from reduced forced outages, calculate savings in maintenance labor and materials, project insurance premium reductions, and present a compelling investment narrative to your CFO. Book a Demo to see how iFactory's AI-driven platform delivers measurable results.
The Predictive Maintenance Investment Imperative
Quantify the financial impact of unplanned downtime and build a compelling business case for executive approval.
Ready to Transform Your Maintenance Strategy?
Discover how iFactory predicts failures before they happen, saving millions in avoided downtime.
Cost of Unplanned Outages
A 500 MW coal-fired plant experiences a forced outage lasting 72 hours. At a wholesale electricity price of $40/MWh, the lost revenue is $1.44 million. Replacement power costs add another $0.5 million. Total direct loss: nearly $2 million per event.
Maintenance Cost Avoidance
Predictive maintenance shifts from time-based to condition-based interventions, reducing unnecessary part replacements and labor. Typical savings range from 30% to 50% of annual maintenance spend.
Insurance Premium Reductions
Improved reliability metrics and reduced outage frequency lead to lower risk profiles. Insurers offer premium discounts of 10% to 20% for plants with certified predictive maintenance programs.
Five-Step ROI Modeling Framework
Baseline Current Performance
Collect 3 years of historical data: forced outage frequency, duration, maintenance spend, and production losses. This establishes the baseline cost of unreliability.
Identify High-Value Assets
Focus on critical components like turbines, generators, and transformers. These assets have the highest failure impact and the greatest potential for ROI.
Model Predictive Maintenance Impact
Apply industry benchmarks: 70% reduction in forced outages, 40% reduction in maintenance costs, and 20% extension in asset life. Adjust for plant-specific factors.
Calculate Net Present Value (NPV)
Discount future cash flows at the company's weighted average cost of capital (WACC). Include implementation costs, software licensing, and training.
Present to Executive Stakeholders
Use a clear one-page summary with key metrics: payback period, internal rate of return (IRR), and total cost avoidance over 5 years.
ROI Comparison: Traditional vs. Predictive Maintenance
| Metric | Traditional Maintenance | Predictive Maintenance | Improvement |
|---|---|---|---|
| Annual Forced Outage Hours | 120 | 36 | 70% reduction |
| Annual Maintenance Spend ($M) | 5.0 | 3.0 | 40% reduction |
| Average Asset Life (years) | 25 | 30 | 20% extension |
| Insurance Premium ($M/year) | 1.2 | 0.96 | 20% reduction |
Cost Avoidance from Reduced Forced Outages
Reducing forced outage hours by 70% translates to 84 fewer hours of downtime per year. At a cost of $500K per day, this represents $1.75 million in annual cost avoidance.
Maintenance Labor and Materials Savings
Condition-based maintenance eliminates unnecessary overhauls. A typical gas turbine overhaul costs $2 million; postponing it by 2 years saves $1 million in net present value.
Extended Asset Life and Deferred Capital
Extending asset life by 5 years delays a $50 million capital replacement. At a 8% discount rate, this deferral yields $34 million in present value savings.
Calculate Your Plant's Potential Savings
Use our ROI calculator to model the financial impact of predictive maintenance tailored to your specific assets and operations.
Deep Dive: Quantifying Insurance Premium Savings
Insurance carriers for power generation facilities increasingly reward proactive risk management. A predictive maintenance program that reduces forced outage frequency by 70% and severity by 50% can lower a plant's loss ratio significantly. For a plant paying $1.2 million annually in premiums, a 15% reduction yields $180,000 in direct savings. Additionally, improved safety records and reduced environmental incident risk further enhance the insurance negotiation position.
To model this, collect your plant's historical loss run data for the past 5 years. Calculate the average annual incurred losses. Apply a 50% reduction factor based on predictive maintenance benchmarks. Then, negotiate with your carrier for a premium credit proportional to the risk reduction. Many carriers now offer formal 'predictive maintenance credits' of 10% to 20%.
Load Forecasting and Generation Optimization
Predictive analytics enable more accurate load forecasting, reducing reliance on expensive peaking units. This can save $200K to $500K annually in fuel costs.
Compliance and Regulatory Benefits
Reduced emissions from fewer startup/shutdown cycles and optimized combustion lower regulatory risk. Avoided penalties can exceed $1 million per incident.
Workforce Productivity Gains
Maintenance teams shift from reactive firefighting to planned, efficient work. Productivity improvements of 25% to 35% reduce overtime and contractor costs.
Implementation Progress Indicators
Frequently Asked Questions
What is the typical payback period for a predictive maintenance system in a power plant?
The payback period typically ranges from 6 to 18 months, depending on plant size, existing maintenance practices, and the criticality of assets. For a 500 MW coal-fired plant, the initial investment of $1.5 million (including sensors, software, and integration) is often recovered within the first year through reduced forced outage costs alone. Additional savings from maintenance optimization and insurance premium reductions further accelerate the return. Book a Demo to get a customized payback analysis for your plant.
How do I calculate the cost of a forced outage for my specific plant?
The total cost of a forced outage includes lost revenue from ungenerated electricity, replacement power costs (if you must purchase from the grid), penalties for failing to meet contractual obligations, and direct repair costs. For example, a 300 MW gas turbine plant with a forced outage of 48 hours at a power price of $35/MWh faces a revenue loss of $504,000. If replacement power costs $50/MWh, the net loss increases to $720,000. Additionally, startup costs and accelerated wear add indirect costs. Contact Support for a detailed cost template.
What are the key metrics to track for predictive maintenance ROI?
The most critical metrics include forced outage rate (FOR), mean time between failures (MTBF), maintenance cost per megawatt-hour, and overall equipment effectiveness (OEE). A reduction in FOR from 5% to 1.5% directly correlates with millions in savings. Track also the number of early warnings detected, false positive rate, and the percentage of maintenance actions that are condition-based rather than time-based. Book a Demo to learn how iFactory's dashboard tracks these metrics in real time.
How does predictive maintenance reduce insurance premiums?
Insurance companies assess risk based on historical loss data and risk management practices. A plant with a robust predictive maintenance program demonstrates lower probability of catastrophic failures, reduced business interruption exposure, and improved safety records. Many carriers offer formal credits of 10% to 20% on property and machinery breakdown premiums. To qualify, you need to provide documented evidence of the program's effectiveness, including reduced outage frequency and severity. Contact Support for a whitepaper on insurance negotiations.
What are the hidden costs of not implementing predictive maintenance?
Beyond direct outage costs, hidden costs include accelerated asset degradation, increased safety risks, higher overtime labor, and reputation damage with regulators and customers. A reactive maintenance culture often leads to 'fix-forward' cycles where problems compound. Over 10 years, these hidden costs can amount to 3-5 times the direct maintenance budget. Book a Demo to see a full cost-benefit analysis for your plant.
Secure Executive Approval Today
Use our proven framework to present a compelling ROI case to your leadership team.