Steel plant inspection managers across the USA, Canada, UK, and Australia are responsible for maintaining the thermal integrity of some of the most extreme operating environments in heavy industry — blast furnace shells running above 2,000 degrees Fahrenheit, torpedo ladles carrying molten iron at 2,600 degrees, continuous casters operating at 1,500 degrees, and electrical substations that can fail catastrophically from a single loose connection that generates a 50-degree temperature rise. Traditional thermal inspection programs depend on periodic handheld IR camera surveys conducted monthly or quarterly by thermography technicians — leaving weeks or months of blind coverage during which hotspots can develop into refractory breakthroughs, ladle shell cracks, or electrical fires. iFactory Thermal AI Platform changes this entirely — deploying fixed and PTZ IR cameras with AI-powered analytics across your steel plant's highest-risk thermal assets, training machine learning models on your plant's specific temperature profiles, and detecting abnormal heating patterns, refractory thinning, and electrical hotspot progression in real time, 24 hours a day, 365 days a year. Book a Demo to see how iFactory deploys AI-driven thermal imaging across your steel plant within 4 weeks.
Why Steel Plant Inspection Managers Are Moving from Handheld IR Surveys to Fixed AI Thermal Analytics
From integrated steel mills in Pennsylvania and Indiana to specialty alloy facilities in the UK's South Yorkshire region, from Canadian mini-mills in Alberta to Australian plate mills in Queensland — every steel plant inspection manager responsible for furnace integrity, ladle safety, and electrical reliability faces the same fundamental problem: thermal inspection data that is collected periodically, analysed offline, and never correlated across asset classes to detect compound failure signatures before they escalate. The comparison below shows how traditional IR inspection programs and AI-powered fixed thermal analytics meet these challenges differently, and why continuous thermal monitoring transforms inspection effectiveness from a periodic sampling exercise into a real-time structural safety intelligence system.
- Inspection manager schedules handheld IR camera surveys every 1-3 months per asset class — blast furnace shell, torpedo ladles, electrical substations — leaving coverage gaps of 30-90 days between thermal inspections
- Thermography technician walks the plant capturing individual thermal images that are analysed offline — hotspot detection depends on the technician's experience, camera settings, and the specific scan path followed during that survey
- Thermal images are stored as separate files with manual annotation — correlating temperature trends across multiple surveys requires the inspection manager to manually compare images and identify temperature progression patterns
- Environmental conditions during the survey — ambient temperature, humidity, solar loading, production rate — are not consistently recorded, making it difficult to distinguish between genuine hotspot progression and measurement condition variation
- Inspection findings are documented in PDF reports that are reviewed days or weeks after the survey — actionable hotspots may remain unaddressed for multiple shifts before the report reaches the maintenance team
- Fixed and PTZ IR cameras monitor every critical thermal asset continuously — blast furnace shell zones, ladle refractory surfaces, electrical switchgear, and caster rollers — with no coverage gaps between inspection cycles
- AI models trained on your plant's specific thermal profiles analyse every camera frame in real time — hotspot detection is consistent, calibrated, and independent of technician experience or camera settings
- Every thermal image is stored with timestamp, asset ID, ambient conditions, and production context — temperature trends across days, weeks, and months are generated automatically without manual image comparison
- Ambient temperature, humidity, solar loading, and production rate are captured automatically with each thermal frame — the AI model normalises temperature readings against current conditions to distinguish genuine hotspot progression from environmental variation
- Hotspot alerts are generated within seconds of detection with automatic work order creation in SAP PM, IBM Maximo, or your CMMS — maintenance teams receive actionable intelligence before the inspection manager finishes reviewing the shift report
The AI Thermal Analytics Pipeline — From IR Camera Frame to Inspection-Ready Intelligence
iFactory Thermal AI transforms the traditional thermal inspection workflow into a continuous analytics pipeline that captures every thermal frame from fixed and PTZ IR cameras, processes it through AI models trained on your plant's specific temperature profiles, and generates actionable intelligence — hotspot alerts, temperature trend reports, refractory degradation curves — without requiring the inspection manager to review individual thermal images. The six-stage pipeline below shows how thermal data flows from camera deployment through AI analysis to CMMS-integrated work order generation.
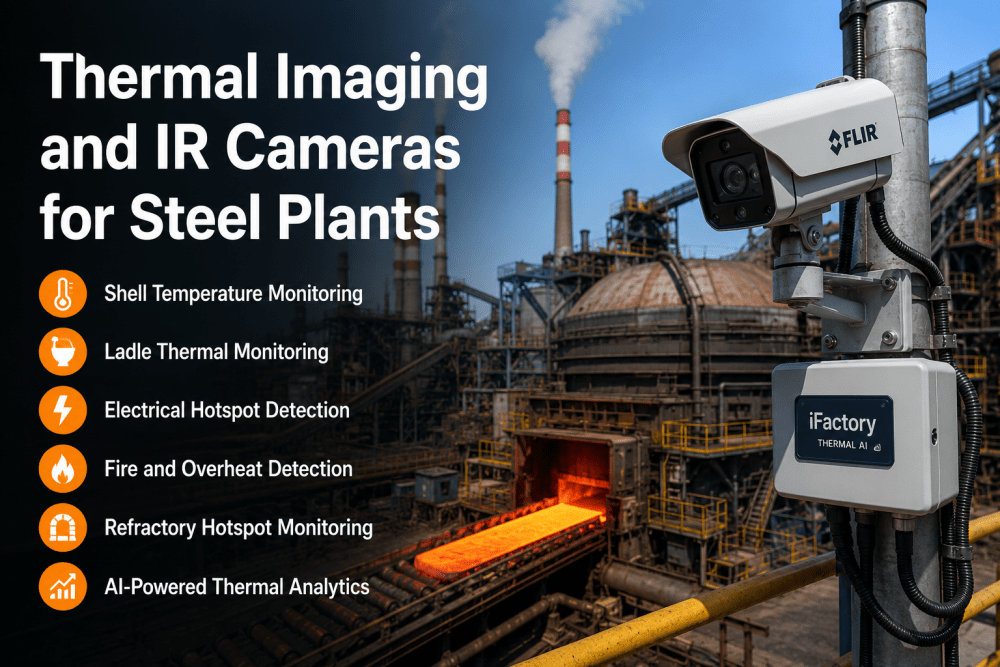
Thermal Monitoring Applications — IR Camera Deployment Across Steel Plant Asset Classes
Fixed and PTZ IR cameras with AI analytics deliver measurable inspection improvement and failure prevention across the five highest-risk thermal asset categories in modern steel production. The table below maps the specific monitoring application, camera configuration, and key thermal parameters for each asset class.
| Asset Class | Thermal Monitoring Application | Camera Configuration | Key Thermal Parameters Monitored | Alert Criteria |
|---|---|---|---|---|
| Blast Furnace Shell | Continuous shell temperature monitoring to detect refractory thinning, hot spots, and cooling system degradation before breakthrough risk | Multiple fixed-mount IR cameras covering bosh, belly, and stack zones — high-temperature range cameras rated for 200-600 degrees Celsius continuous operation | Absolute shell temperature per zone, spatial temperature gradient across shell surface, temperature rate of change per shift, and comparison to refractory wear model predictions | Single point exceeding 350°C baseline by 50°C, spatial gradient exceeding 100°C over 1-meter distance, or 15-degree-per-day upward trend sustained over 72 hours |
| Torpedo Ladle Shells | Thermal inspection of ladle refractory condition at dedicated inspection stations — detection of hot spots indicating refractory wear or metal penetration through shell | Fixed-mount IR camera at ladle inspection station with triggered image capture when ladle is positioned — integration with ladle tracking system for automatic ladle identification | Maximum shell temperature per ladle, spatial distribution of hot spots, temperature comparison to ladle-specific baseline, and hot spot temperature trend across multiple campaigns per ladle | Any single hot spot exceeding 400°C, new hot spot appearance on ladle with previously stable thermal profile, or hot spot temperature increase exceeding 20°C between consecutive campaigns |
| Electrical Substations | Automatic thermal surveillance of MV switchgear, transformers, busbars, and cable connections to detect loose connections, overloaded circuits, and insulation degradation | PTZ IR cameras with programmed patrol routes covering substation assets — automatic return to previous hotspot locations for trend tracking across patrol cycles | Maximum temperature per connection point, temperature differential between phases of the same circuit, temperature rise relative to ambient, and connection temperature trend over rolling 30-day window | Phase-to-phase temperature differential exceeding 15°C, connection temperature exceeding 90°C above ambient, or rising temperature trend over 3 consecutive patrol cycles on the same connection point |
| Continuous Caster | Thermal monitoring of strand shell surface temperature, roller alignment, and mould cooling pattern to detect breakout risk and strand quality issues | Multiple fixed-mount IR cameras covering mould exit, spray chamber, and straightener sections — water-cooled housings with air purge for steam and scale environment | Surface temperature profile along strand length, mould cooling pattern uniformity, roller surface temperature indicating bearing or alignment issues, and temperature recovery pattern after spray chamber | Strand surface temperature deviation exceeding 50°C from expected profile, asymmetric cooling pattern across strand width exceeding 30°C differential, or roller surface temperature exceeding 120°C indicating bearing failure risk |
| Hot Rolling Mill | Thermal monitoring of transfer bar temperature profile, roll surface temperature, and runout table cooling pattern — ensuring consistent rolling temperature and detecting roll spalling risk | PTZ IR cameras monitoring transfer bar entry to roughing mill, finishing mill stands, and runout table — high-temperature cameras with fast frame rate for moving bar tracking | Transfer bar surface temperature uniformity, roll surface temperature indicating thermal fatigue, finishing mill delivery temperature consistency, and coiler mandrel temperature trend | Transfer bar temperature differential across width exceeding 30°C, roll surface temperature exceeding 400°C indicating thermal fatigue risk, or delivery temperature trend deviation exceeding specification limits over 50 consecutive bars |
Proven KPI Results — AI Thermal Imaging Impact from Live Steel Plant Deployments
iFactory's AI-powered thermal imaging platform delivers measurable inspection effectiveness and failure prevention improvements within the first 60 days of full production rollout. The following KPIs reflect aggregated performance data across furnace, ladle, electrical, caster, and rolling mill assets at operating steel facilities in the USA, Canada, UK, and Australia.
Inspection Manager Perspective — AI Thermal Imaging on the Steel Plant Floor
I have managed the thermography program at this integrated steel mill for 11 years. For a decade, my team of three thermography technicians and I conducted handheld IR surveys of the blast furnace shell, torpedo ladles, and electrical substations on a rotating schedule. The blast furnace shell got surveyed once every 6 weeks. The ladles were inspected when they passed through the inspection station — maybe 60 percent coverage on any given day. The electrical substations were surveyed quarterly. Between those surveys, I knew hotspots could develop and progress for weeks without anyone knowing. We deployed iFactory's fixed IR cameras on the blast furnace shell zones, the ladle inspection station, and our main substations 14 months ago. In the first 90 days, the system detected 12 hotspots on the furnace shell that our last handheld survey had missed — one of them was already 70 degrees above baseline on a section of the bosh that our technician had scanned and cleared 3 weeks earlier. We intervened during a scheduled maintenance window and found refractory thinning to 40 percent of original thickness. Without continuous monitoring, that section would have progressed to a breakthrough event within 2-3 more weeks of operation. The system has since detected 47 actionable thermal anomalies across all monitored assets, with a false positive rate of 2.8 percent. My thermography technicians now focus on validating AI-detected hotspots with detailed follow-up inspections rather than walking predetermined scan paths. Our insurance surveyor reduced our thermal risk rating after reviewing the continuous monitoring records.
Financial Impact and Hotspot Avoidance by Steel Plant Asset Class
Beyond inspection cost reduction, iFactory Thermal AI directly protects steel plant production revenue and eliminates the compounding costs of unplanned thermal events — quantified below by asset class from live steel plant deployments across the USA, Canada, UK, and Australia.
Conclusion: Stop Relying on Periodic IR Surveys — Continuous AI Thermal Monitoring Catches Hotspots Before They Become Failures
Steel plant inspection managers have always understood the value of thermal imaging for preventing catastrophic asset failures — the limitation has never been the technology but the inspection model. Periodic handheld IR surveys, regardless of how well executed, leave coverage gaps that span weeks or months — gaps during which hotspots can initiate, progress, and reach critical temperature thresholds before the next scheduled survey cycle. The result is a thermal inspection program that catches some events but systematically misses others, creating risk exposure that the inspection manager cannot fully quantify because there is no continuous data to measure what happens between surveys. AI-powered thermal analytics closes this structural gap by deploying fixed and PTZ IR cameras that never stop monitoring and AI models that never stop analysing — detecting hotspot initiation events within seconds, tracking temperature progression automatically, and generating maintenance work orders before the hotspot reaches critical temperature. The inspection managers who deploy continuous AI thermal monitoring gain the confidence of knowing that every critical thermal asset is under continuous surveillance, every hotspot event is detected at initiation, and every failure that could have been prevented by earlier detection will be caught by the next frame.
.png)