Automated Inspection Systems in Steel Manufacturing: Complete Guide
By Antonio Shakespeare on June 1, 2026
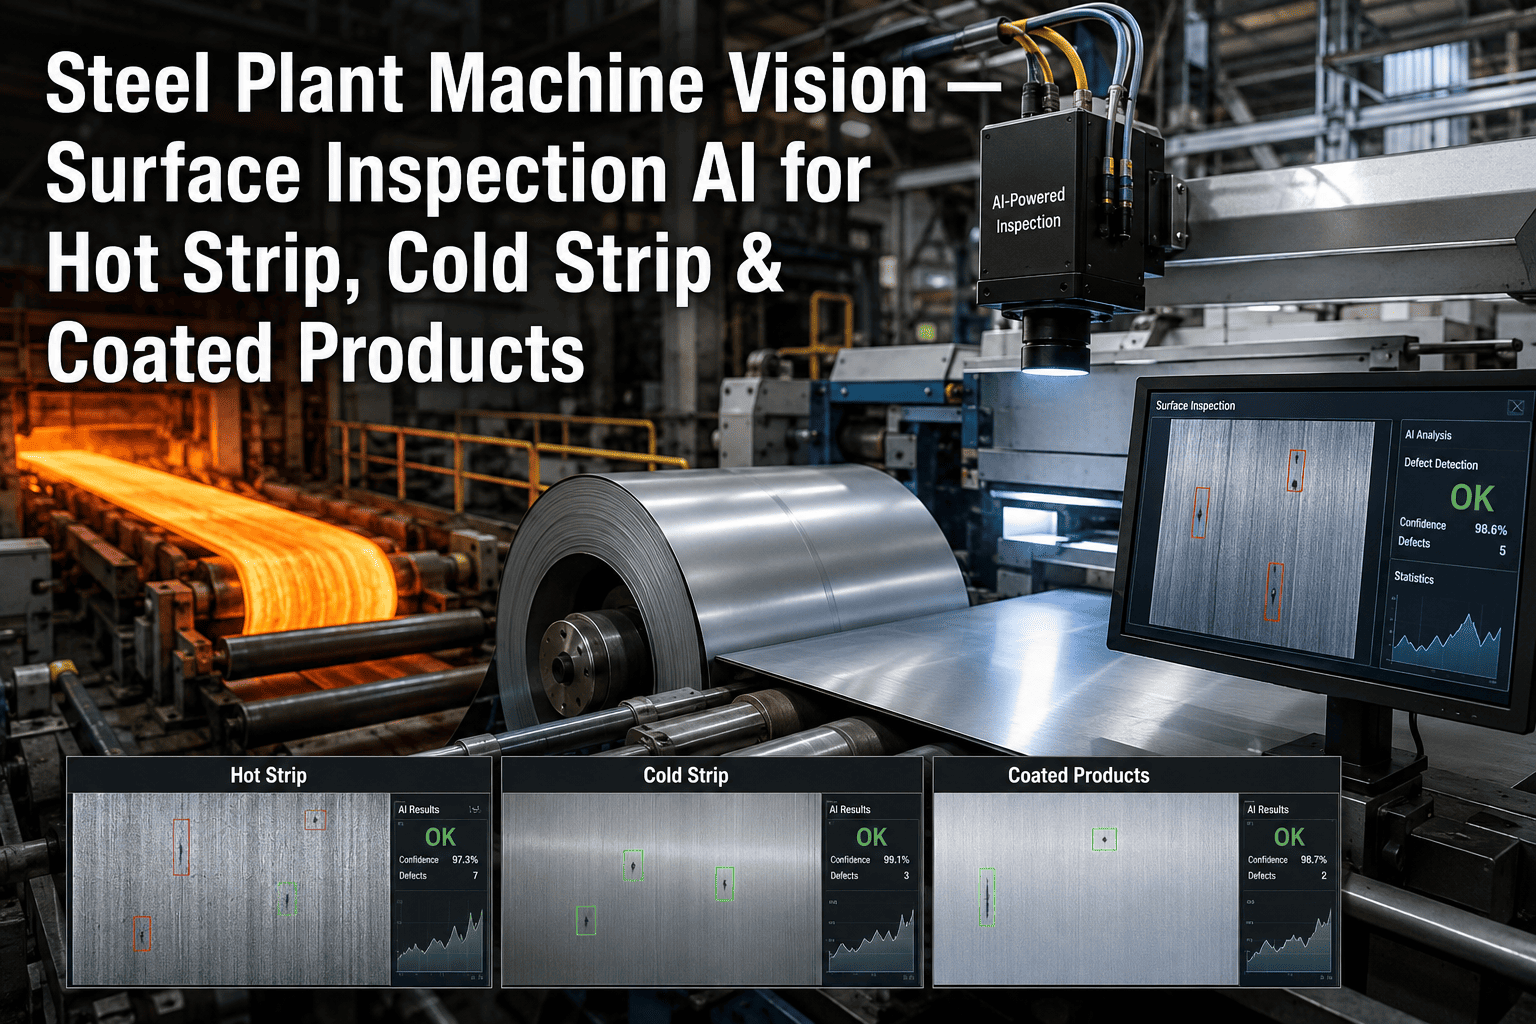
Surface defects on hot-rolled coil that reach the galvanizing line cost between $180 and $340 per ton in downgrade or rejection depending on product specification — and the majority of those defects were detectable at the hot mill exit if an automated inspection system had been in place. Steel manufacturing quality assurance is still, at most U.S. facilities, a combination of periodic manual sampling, end-of-line visual checks and lab testing of pulled specimens — a quality architecture designed around what was technically and economically feasible in 1985, not around what is available in 2026. Inline automated inspection systems using machine vision ultrasonic transducers, eddy current arrays, and laser profilometry can inspect 100% of production surface area at line speed, detect defects at sub-millimeter resolution, and feed the defect data directly into the analytics platform that routes material to the correct downstream process or customer order. Mills that deploy iFactory's automated inspection and IoT integration platform alongside inline inspection hardware report 63% reduction in customer quality complaints, 41% decrease in downgrade tonnage, and inspection data completeness rates above 99.7% — compared to the 8–12% of production that manual sampling programs actually cover.
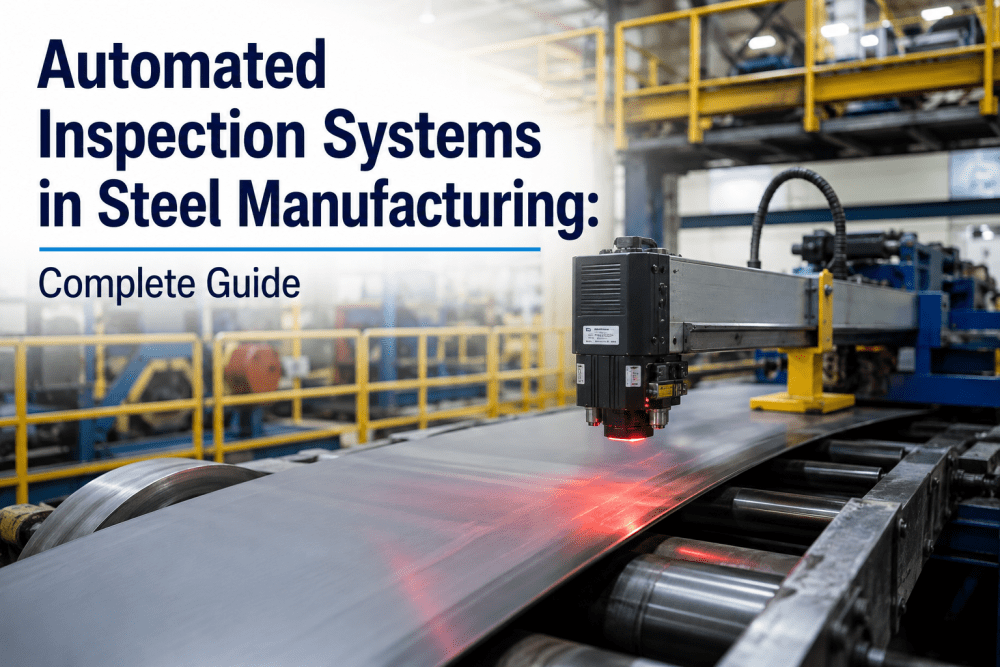
Automated Inspection Systems in Steel Manufacturing: Complete Guide
From surface defect detection at hot mill exit to ultrasonic thickness verification at the cut-to-length line — learn how automated inspection systems replace sampling-based quality control with 100% inline coverage, and how iFactory integrates inspection data with production analytics, work order routing, and customer quality reporting.
The fundamental problem with periodic manual inspection in steel manufacturing is not inspector skill — it is mathematics. A cold rolling mill producing 120,000 tons per month of automotive-quality cold rolled steel generates approximately 2.4 billion square centimeters of surface area. A manual inspection program that samples 10% of production and covers 1% of the sampled surface area is examining 0.1% of total production — and making product disposition decisions about the other 99.9% based on extrapolation from that 0.1%. For commodity construction steel, that sampling rate may be commercially acceptable. For automotive exposed panels, appliance steel, or tin mill products, it is not — because a single uncaught longitudinal scratch on a hood outer panel, a seam defect on a food can body, or a thickness deviation on a coil destined for roll-formed roofing profiles represents a warranty claim, a recall risk, or a processing line downtime event at the customer.
Inspection Coverage: Manual Sampling vs. Automated Inline — By Production Volume
120,000 t/month cold rolling mill, automotive-quality CRC product
Crew-limited, no below-surface or sub-mm defect coverage
Automated Inline (iFactory Integration)
99.7%+
100% surface area at line speed, sub-mm resolution, real-time data to analytics
Coverage gap quantified at comparable integrated cold mill deployment. Defect detection resolution: 0.3mm minimum feature size for vision systems; 1mm wall thickness deviation for ultrasonic arrays.
The coverage gap is the reason why automated inspection systems are not a nice-to-have for mills serving automotive OEMs, appliance manufacturers, or food packaging customers — they are a supply chain requirement. Ford, GM, Stellantis, and their Tier 1 suppliers have progressively tightened incoming quality requirements to the point where steel suppliers that cannot provide 100% inline inspection certification for surface-critical grades are disqualified from certain order types regardless of historical performance. iFactory's automated inspection integration platform connects the data output from inline inspection hardware — whatever system the mill has deployed or is evaluating — into the production analytics, work order, and customer quality reporting workflows that close the loop from defect detection to disposition to corrective action.
Automated Inspection Technologies by Application — What Each System Detects and Where It Is Deployed
There is no single automated inspection technology that covers every steel quality parameter — different physical phenomena require different sensor modalities, and a complete inline inspection architecture combines multiple systems at different points in the production process. The table below maps each major automated inspection technology to its detection capability, its steel production deployment point, typical defect types detected, and the production grades where it provides the highest value.
Inspection Technology
Physical Principle
Deployment Point
Defect Types Detected
Primary Product Grades
Minimum Feature Size
Machine Vision / Surface Inspection (SIS)
High-speed CCD/CMOS imaging with structured lighting; AI-based defect classification
Automotive Class A surface, precision strip, embossed/textured products
±0.5 μm height resolution; 0.1 mm lateral
Magnetic Flux Leakage (MFL)
Permanent magnet saturation; flux leakage at defect sites detected by Hall sensors
Pipe inspection, plate, strip — ferromagnetic materials only
Pits, corrosion, weld defects in pipe, wall loss, longitudinal and transverse cracks
Line pipe (API 5L), structural tube, storage tank inspection
5% wall thickness loss minimum detection
X-Ray / Gamma Radiography (Digital)
Differential absorption of ionizing radiation; digital detector imaging
Weld seam inspection (ERW, SAW pipe), casting inspection, heavy forging
Weld porosity, lack of fusion, inclusions, internal voids, segregation
Pressure vessels, linepipe welds, heavy structural fabrications
1–2% of wall thickness (porosity); 0.5 mm crack width
The practical implication of this technology landscape is that a mill serving diverse end markets — automotive CRC, linepipe, appliance — typically needs three to five distinct inline inspection systems deployed at different points in the production route. iFactory's IoT integration layer aggregates the defect data from all of these systems into a single analytics platform, where defect maps are correlated with process parameters, dispositioned against customer specifications, and routed to work order management — eliminating the manual step of taking defect reports from five different OEM inspection system software platforms and reconciling them with the production record. Book a Demo to see how iFactory connects your existing inspection hardware to a unified quality analytics workflow.
Connect Every Inline Inspection System to a Single Quality Analytics Platform
iFactory integrates surface inspection systems, ultrasonic arrays, eddy current testers, and laser profilometers into one analytics workflow — correlating defect data with process parameters, routing dispositions, and auto-generating customer quality certificates without manual compilation.
iFactory Inspection Integration Architecture — From Sensor Data to Production Analytics to Customer Certificate
Deploying inline inspection hardware is the first step — and many mills have taken it. The operational gap that most mills face is the second and third step: taking the defect data that inline inspection systems generate and integrating it into the production workflow so that material disposition, process correction, and customer documentation happen automatically rather than requiring a quality technician to manually reconcile inspection system reports with the production record. iFactory's automated inspection integration architecture covers this workflow in five stages.
Stage 1
Multi-System Data Ingestion — OPC-UA, REST API, and Direct Sensor Integration
iFactory ingests defect data from inspection OEM systems (Cognex, Isra Vision, Parsytec, GE Inspection Technologies, Olympus NDT, and others) via OPC-UA, REST API, MQTT, and direct database connection. Each defect record is time-stamped, position-tagged to the coil/slab/plate coordinate, and associated with the production order and heat number — creating a defect map that is traceable to the specific production record rather than existing as a standalone inspection report in the inspection system's proprietary database.
Integration: OPC-UA · REST API · MQTT · Direct DB · Multi-OEM inspection hardware support
Stage 2
Real-Time Defect Classification and Disposition Against Customer Specification
Each incoming defect record is automatically classified against the customer specification loaded for the order — defect type, size, location, and density thresholds. iFactory maintains a specification library that maps customer quality standards (OEM technical specifications, API standards, ASTM grades) to defect acceptance criteria. When a defect or defect cluster exceeds the threshold for the current order's specification, the platform immediately flags the affected coil section for hold and routes a disposition work order to the quality supervisor — without waiting for end-of-line manual review. Material that meets specification continues to the next process step without manual intervention.
Process Correlation Analytics — Linking Defect Occurrence to Upstream Cause
Defect data without process correlation is detection without diagnosis. iFactory's analytics layer correlates each defect cluster — by defect type, location pattern, and production period — with the process parameters recorded in the production historian for the same production window: rolling mill parameters, furnace temperature profile, scale removal system pressure, roll surface condition, cooling water chemistry. When scale pit defects appear in a recurring pattern at a specific coil width position, and that pattern correlates with a descaler header pressure drop that occurred 20 minutes earlier in the rolling sequence, the root cause is identifiable without manual investigation. This process correlation capability is the bridge between detection and prevention.
Capability: Process historian correlation · Defect pattern analysis · Root cause identification · Recurring defect detection
Stage 4
Automated Work Order Generation — Inspection Findings to Maintenance Actions
When process correlation identifies that a defect pattern is driven by equipment condition — a work roll with surface damage generating a recurring mark at a fixed pitch, a guide worn beyond specification causing edge damage on wire rod, a descaler nozzle plugged at a specific header position — iFactory generates a maintenance work order from the quality event rather than waiting for the maintenance department to correlate the quality complaint with equipment condition independently. The work order is pre-populated with the defect type, the correlated equipment, the pitch or pattern data that identified the equipment as the cause, and the recommended corrective action. This automatic quality-to-maintenance routing closes the loop that in most mills remains open for days between defect detection and equipment correction.
Capability: Auto work order from defect · Equipment correlation · Pre-populated corrective action · Quality-maintenance routing
Stage 5
Customer Quality Documentation — Mill Test Reports and Defect Maps Auto-Generated
Mill test reports (MTRs), defect maps, and customer-specific quality certificates are auto-generated from the integrated inspection and production data in iFactory's platform. The MTR for each coil or plate includes the inspection system's defect scan result alongside the mechanical and chemical test results — giving the customer a complete quality document that covers both lab-measured properties and inline inspection coverage. For customers requiring defect maps (surface-critical automotive applications, heavy plate for structural certification), the defect map is generated from the position-tagged defect records and attached to the shipping documentation automatically. Manual MTR compilation time drops from 45–90 minutes per heat to under 5 minutes per coil.
Implementation Checklist — Deploying Automated Inspection With iFactory Integration at a Steel Mill
Automated inspection deployment in a steel mill has two parallel workstreams: the hardware installation and commissioning of the inspection systems themselves, and the software integration and configuration of the analytics platform that makes the inspection data operationally useful. The checklist below covers both workstreams from initial assessment through steady-state operation, with documented timeline benchmarks from comparable deployments.
Phase 1
Assessment and Architecture Design
Weeks 1–3
Audit existing inspection assets — identify all inline inspection hardware currently installed, protocols, data output formats, and integration points
Map production routes by product grade and identify inspection coverage gaps vs. customer specification requirements
Load customer quality specifications into iFactory spec library — map defect acceptance criteria for each OEM, distributor, and industry standard
Define data architecture — coil/plate coordinate system, heat number linkage, production order association for defect record tagging
Identify process historian data sources for correlation analytics — L2 production system, mill automation, energy and utilities SCADA
Phase 2
Integration and Data Validation
Weeks 4–8
Connect inspection OEM systems to iFactory via OPC-UA or API — validate defect record ingestion with position tagging accuracy verification
Configure disposition rules — auto-hold thresholds by defect type, customer spec, and product grade; validate against historical quality events
Connect process historian and validate process correlation analytics — run 30-day historical correlation to calibrate defect-to-process linkage models
Configure MTR auto-generation templates by customer and product grade — validate output format against customer receiving requirements
Integrate with CMMS work order system — validate auto-work-order generation from defect-to-equipment correlation events
Phase 3
Go-Live and Steady State
Weeks 9–12 and ongoing
Parallel operation period — run automated disposition alongside manual quality review for 4 weeks to validate auto-disposition accuracy and calibrate thresholds
Quality KPI dashboard activation — defect rate by type and product, first-pass yield, customer complaint rate, downgrade tonnage, MTR generation time
Monthly defect trend review cycle — process correlation analytics reviewed with metallurgy and maintenance teams to identify and close recurring defect root causes
Customer quality communication — share automated inspection coverage data with automotive and other surface-critical customers as part of PPAP and supplier qualification documentation
Inspection Data Analytics — What the Quality KPI Dashboard Tracks and How It Drives Improvement
The value of automated inspection data multiplies significantly when it is analyzed rather than just archived. An inspection system that generates 100% surface coverage data but stores that data in the inspection OEM's proprietary database — siloed from the production record, the maintenance system, and the shipping documentation — is contributing to quality assurance but not to continuous improvement. iFactory's quality KPI dashboard converts the raw defect data into operational intelligence across four analytical dimensions.
Defect Rate Trending by Type and Production Unit
Defect occurrence rate — defects per 1,000 m² of inspected surface — tracked by defect classification, by production line, by product grade, and by production shift. When a specific defect type is trending above its rolling 30-day average, the dashboard flags it before the rate crosses the customer complaint threshold. Mills using this trending capability identify deteriorating roll surface condition, fouled descaler nozzles, and guide wear events 3–7 days earlier than facilities relying on customer feedback.
-63% customer quality complaints at comparable deployments
First-Pass Yield and Downgrade Cost Per Ton
First-pass yield — the percentage of production that meets its original specification without rework, downgrade, or rejection — is calculated from inspection data and tracked per production line and per product grade. When first-pass yield on automotive cold rolled drops below the grade target, the platform identifies which defect types are driving the shortfall and which process parameters correlate with those defect types. Downgrade cost is calculated at current price differentials and allocated to the root-cause production event — making the cost of quality visible in operational terms rather than accounting-period terms.
-41% downgrade tonnage within 18 months at comparable deployments
Process-Defect Correlation Heatmap
The correlation heatmap visualizes the statistical relationship between each major defect type and the process parameters that influence it — rolling force, entry temperature, descaler pressure, roll surface condition index, cooling water chemistry. When the correlation coefficient between a specific process variable and a defect type exceeds the significance threshold, the process variable is flagged as a probable driver and the maintenance or process engineering team receives a notification. This automated correlation replaces the manual root cause analysis that typically takes 2–4 days after a quality event is identified.
2–4 day root cause analysis → same-shift identification
Customer Quality Reporting — Auto-Generated MTRs and Defect Certificates
Mill test reports and customer inspection certificates are generated automatically from the integrated production and inspection data — covering mechanical test results, chemical analysis, and inline inspection coverage in a single document formatted to the customer's receiving requirements. For automotive OEM customers requiring PPAP-level quality documentation, the inspection coverage statement and defect scan results are attached automatically to the shipping documentation. MTR generation time drops from 45–90 minutes per heat to under 5 minutes per coil; documentation accuracy improves because data comes directly from the production record rather than manual transcription.
45–90 min MTR generation → under 5 minutes per coil
99.7%+
Inspection coverage vs. 0.1% with manual sampling at typical cold mill
63%
Reduction in customer quality complaints within 18 months at comparable deployments
$180–$340
Per-ton cost of uncaught surface defect reaching customer for automotive-quality CRC
41%
Reduction in downgrade tonnage via real-time disposition and upstream process correction
Expert Perspective: What Quality and Technology Leaders Say About Automated Inspection Deployment
"The most important shift that happened in our quality program when we deployed inline surface inspection with iFactory's analytics integration was not that we caught more defects — though we did. It was that we finally understood why the defects were happening. Before automated inspection, our quality database was populated by customer complaints and end-of-line samples — both of which are lagging indicators that tell you a problem exists, not where in the process it originated. We had a recurring scale pit issue on our automotive cold rolled product that had been the subject of three separate root cause analyses over 18 months, all of which concluded with inconclusive findings because we could not correlate the defect occurrence with specific production events. The manual sampling program just did not have the temporal resolution to make that connection. Within six weeks of going live with inline surface inspection and iFactory's process correlation analytics, we identified that the scale pit clustering was occurring specifically on heats where the descaler entry temperature was above a threshold that coincided with a specific slab grade's reheating practice. It was a 14-degree Celsius temperature window that our sampling program had never been able to isolate. The fix was a reheating practice modification for that grade — a change that took two days to implement and immediately reduced our scale pit rate on automotive cold rolled by 71%. That single root cause identification justified the entire inspection system investment. The MTR automation was the other major operational benefit. We had two quality technicians spending significant portions of their shifts manually compiling mill test reports. That time is now almost entirely freed up for actual quality analysis work rather than data transcription. The ROI on the integrated platform — inspection hardware plus iFactory analytics — was less than 8 months when you account for the avoided downgrade cost, the customer complaint reduction, and the quality labor productivity improvement."
VP of Quality and TechnologyMidwestern Flat-Rolled Steel Producer — 1.4 Million Ton Annual Capacity — 21 Years Steel Industry — ASQ Certified Quality Engineer
Conclusion: Automated Inspection Is the Foundation of Modern Steel Quality Assurance
The steel quality assurance programs that will serve automotive, appliance, and energy customers in 2026 and beyond are not built on sampling rates and manual inspection — they are built on 100% inline inspection coverage, real-time defect-to-specification disposition, process correlation analytics that identify root causes before they generate customer complaints, and automated documentation that delivers MTRs and inspection certificates without manual compilation. This is not aspirational technology — it is commercially deployed at mills across the United States and globally, and it is the inspection architecture that surface-critical customers are increasingly requiring as a supplier qualification condition rather than treating as a differentiator.
iFactory's automated inspection and IoT integration platform provides the analytics layer that converts inspection hardware investment into operational quality intelligence — connecting surface inspection systems, ultrasonic arrays, eddy current testers, and laser profilometers into a single workflow that dispositions material, routes corrective actions, correlates defects with process parameters, and auto-generates customer quality documentation. The 63% reduction in customer quality complaints, 41% decrease in downgrade tonnage, and inspection coverage rates above 99.7% at comparable deployments are the documented outcomes of building quality assurance on inspection data rather than sampling inference. Book a Demo to see how iFactory's inspection integration platform applies to your mill's specific inspection hardware, product grades, and customer quality requirements.
Frequently Asked Questions
iFactory connects to Cognex,Isra Vision,Parsytec,GE Inspection Technologies,Olympus NDT,Primetals andothers via OPC-UA,REST API,MQTT,and direct database connection.
iFactory correlates defect records — time-stamped and position-tagged to the coil coordinate — with process historian data for the same production window. Statistical correlation coefficients identify which process variables.
Yes,iFactory generates MTRs,inspection coverage statements,and defect scan results formatted to automotive OEM receiving requirements.Defect maps are automatically attached to shipping documentation.
Deployment runs 8–12 weeks at $50,000–$120,000 depending on the number of inspection systems integrated, product grade complexity, and customer spec library size. ROI is typically achieved within 6–10 months.
Yes — iFactory's multi-system ingestion architecture supports all major inspection modalities: machine vision, ultrasonic (immersion, contact, EMAT), eddy current, laser profilometry, and MFL.
Connect Your Inline Inspection Systems to Real-Time Quality Analytics — Surface Defects, Thickness Measurement, and NDT Data in One Platform.
iFactory's automated inspection integration platform aggregates data from all inspection hardware, dispositions material against customer specifications in real time, correlates defects with process parameters, and generates MTRs automatically — replacing manual quality workflows with a complete analytics-driven quality management system.