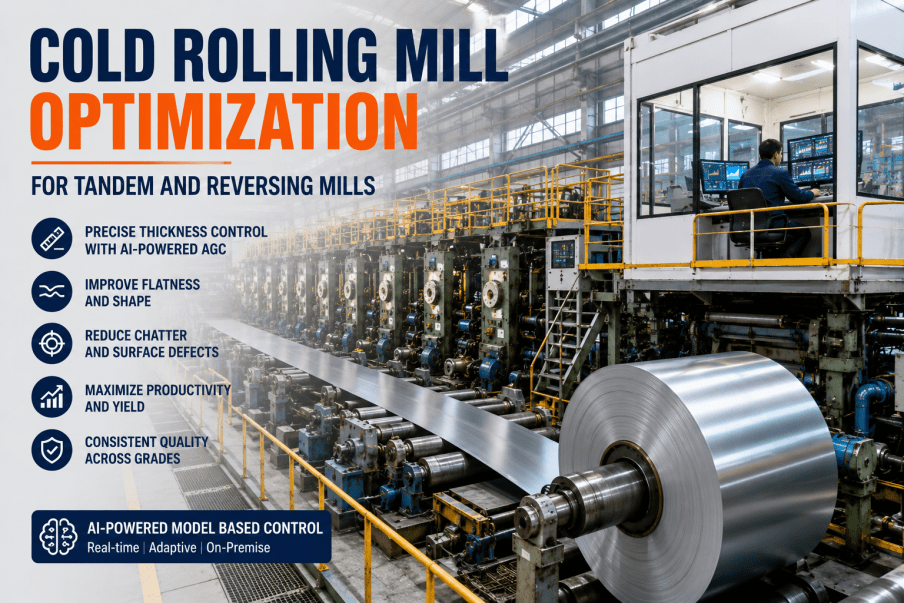
Cold rolling mill operations sit at the intersection of extreme precision and high mechanical stress — a combination that generates a specific, high-consequence category of quality and reliability failure that neither standard SCADA alarm systems nor calendar-based maintenance programs address adequately. A tandem cold mill running 1,400 meters per minute on automotive exposed steel tolerates thickness variation of ±3 microns, strip flatness deviations measured in I-units, and surface roughness specifications controlled to sub-micron Ra values. At those tolerances, a work roll bearing with 12% elevated vibration, a damaged roll surface that cleared the last scheduled inspection, an emulsion system with contaminated coolant or a tension control loop with 8% response degradation are all generating production failures before any conventional alarm fires. Cold rolling mill analytics and precision equipment tracking closes the gap between the condition data already present in the mill's Level 2 system and the maintenance decisions required to prevent those failures — continuously monitoring roll surface quality metrics, emulsion system performance bearing condition across every stand, and tension and flatness control loop integrity against mill-specific baselines that account for the wide variation in normal operating parameters across different products, speeds and strip gauges. Facilities running iFactory's cold rolling mill analytics platform report 38% reduction in unplanned mill downtime, 31% reduction in prime-to-secondary downgrades attributable to equipment condition, and $1.4 million average annual quality and maintenance cost savings per tandem mill line.
Why Cold Rolling Mills Generate More Hidden Quality and Equipment Failures Than Any Other Mill Type
The precision tolerance environment of cold rolling creates a failure dynamic that is fundamentally different from hot rolling: defects and equipment degradation are invisible to conventional monitoring until they have already produced customer-visible quality failures. A work roll with developing surface fatigue — micro-pitting on the roll surface below the threshold of scheduled optical inspection — transfers that surface signature to every strip it contacts, producing subtle finish defects in automotive exposed or appliance-grade material that customers detect on the painted panel, not at the mill. A tension control loop with increasing servo response time produces strip width and flatness variations that appear in the process data only as a gradual increase in flatness deviation standard deviation — not as an alarm, and not as a parameter that conventional monitoring tracks at all. An emulsion system with progressive biological contamination produces lubricating film breakdown at high-speed stands that generates friction-driven thickness variation before any conductivity or pH alarm fires.
The analytics requirement for cold rolling mill equipment is therefore more demanding than for hot rolling: it requires continuous condition tracking at the parameter level that determines quality output, not just at the parameter level that determines equipment survival. iFactory's cold rolling mill analytics platform addresses this by monitoring simultaneously the mechanical condition of every rotating element, the process performance of every control loop, and the system health of every fluid system — connecting all three layers to the strip quality data stream to identify the equipment condition that is generating current and projected quality excursions. Book a demo to see how this works on your specific mill configuration.
The Four Monitoring Domains That Determine Cold Rolling Mill Quality and Reliability
Cold rolling mill analytics must address four distinct equipment and process monitoring domains that each contribute independently to quality and reliability outcomes — and whose interactions create compound failure modes that single-domain monitoring consistently misses. iFactory's platform monitors all four simultaneously, integrating data from Level 2 automation, roll shop systems, emulsion plant SCADA, and bearing monitoring hardware into a unified mill health picture.
Work Roll and Backup Roll Surface Quality Tracking
Work roll surface condition is the direct determinant of strip surface quality in cold rolling — and the hardest to monitor with conventional approaches because roll surface degradation does not generate vibration or temperature anomalies until it is already producing strip defects. iFactory integrates roll shop surface measurement data (profilometer Ra, Rz, and waviness readings from the grinding line) with in-mill surface quality indicators — strip surface roughness from in-line profilometers, roll force deviation patterns that correlate with roll surface damage, and rolling noise spectra that indicate surface fatigue pit initiation — into a continuous Roll Surface Quality Index (RSQI) that tracks each roll set's degradation trajectory against a campaign length model calibrated to that roll grade and product type.
Work Roll, Backup Roll, and Tension Reel Bearing Condition Monitoring
Cold mill bearing failures generate a disproportionate share of unplanned downtime events — bearing failures in work roll chocks and backup roll chocks require a full stand changeout that interrupts production for 2 to 6 hours, and backup roll bearing failures in a critical finishing stand can damage the backup roll neck and require emergency roll shop work. iFactory monitors vibration spectra at all bearing positions continuously, tracking bearing defect frequency components (BPFO, BPFI, BSF, FTF) against campaign-specific baselines that account for the very different normal operating vibration levels at different rolling speeds, reductions, and strip widths.
Rolling Emulsion System — Contamination, Concentration, and Filtration Monitoring
The rolling emulsion system is the most undermonitored high-consequence fluid system in a typical cold rolling mill. Emulsion concentration, iron particle contamination, pH, conductivity, biological contamination, and filtration system differential pressure collectively determine whether the lubricating film between work roll and strip is intact at rolling speed — and whether that film is clean enough to meet the surface quality requirements of automotive, appliance, and tinplate-grade strip. iFactory monitors all six emulsion system parameters continuously, applying product-specific emulsion specification limits and integrating emulsion condition data with strip surface quality indicators to detect the developing quality impact of emulsion system degradation before it reaches the customer.
Tension Control, AGC, and Flatness Actuator System Performance Tracking
The quality control systems in a cold rolling mill — hydraulic AGC for thickness control, CVC and bending actuators for flatness control, inter-stand tension control loops — degrade progressively in ways that generate quality impacts weeks before any individual control system generates an alarm. A tension control loop with increasing response time produces sub-optimal inter-stand tension regulation that generates yield strength variation and surface texture non-uniformity at the coil level. A CVC actuator with increased friction generates asymmetric strip flatness that accumulates across production before flatness alarms fire. iFactory tracks control system performance metrics against commissioning baselines, detecting degradation that quality-conscious customers would detect on the finished product before any plant alarm does.
Precision Equipment Tracking: From Roll Shop to Mill Stand to Quality Record
Precision equipment tracking in a cold rolling mill is not just condition monitoring — it is a complete lifecycle management system that follows every roll, chock, bearing, and work roll sleeve from the roll shop through every mill campaign and back to the grinder, maintaining a continuous record of surface condition, bearing condition, and campaign history that determines when and how each component is used. Most cold mills manage this data in disconnected spreadsheets and shift logs. iFactory connects roll shop measurement data, in-mill condition monitoring, strip quality records, and campaign history into a unified component tracking register that makes every maintenance decision traceable and every quality investigation resolvable. Book a demo to see the full roll lifecycle tracking workflow.
Cold Mill Monitoring Parameter Matrix — From Tandem Mill to Skin Pass
The table below maps the key monitoring parameters, measurement sources, normal ranges, degradation signals, and failure modes tracked by iFactory's cold rolling mill analytics platform across tandem mills, reversing mills, and skin pass mills. Parameters are organized by monitoring domain rather than by mill type — all parameters apply to tandem mills; reversing mills and skin pass mills use the subset relevant to their configuration. Book a demo to see how iFactory maps these parameters to your specific mill stands and product mix.
| Parameter | Monitoring Domain | Measurement Source | Degradation Signal | Failure Mode / Quality Impact | Detection Lead Time |
|---|---|---|---|---|---|
| Roll Surface Quality Index (RSQI) | Roll Surface | In-line Ra profilometer + roll shop grinder data | RSQI below product-specific threshold for current campaign position | Strip surface finish defect — micro-pitting transfer | 3–7 days |
| Work Roll Bearing Defect Frequency | Bearing Condition | Chock-mounted accelerometer, 1–10 kHz | BPFO/BPFI amplitude >35% above speed-normalized campaign baseline | Work roll chock bearing failure — stand changeout | 7–21 days |
| Emulsion Concentration | Emulsion System | Inline refractometer or conductivity probe | Deviation >0.5% from product-specific target | Lubrication film breakdown — strip surface staining, friction rise | Shift-level detection |
| Emulsion Iron Contamination | Emulsion System | Inline iron particle counter | Iron content rise >50% above post-change baseline | Surface micro-scratching on high-finish grades | Days lead time |
| AGC Cylinder Leakage Index | Tension & Flatness | Position drift under hold pressure | Drift rate >0.08 mm/min at operating pressure | Thickness deviation — prime-to-secondary downgrade | 7–21 days |
| Inter-Stand Tension Variation (σ) | Tension & Flatness | Load cell or current-based tension model | Coil-to-coil σ increase >20% from rolling standard baseline | Yield strength non-uniformity, elongation variance | 3–10 days |
| Flatness Actuator Response Time | Tension & Flatness | CVC/bending actuator position and force transducer | Force-to-position ratio rise >18% above commissioning baseline | Flatness control loss — strip edge wave or center buckle | 7–14 days |
| Skin Pass Elongation Uniformity | Roll Surface | Load cell + entry/exit speed differential | Elongation standard deviation rise >15% across coil length | Yield point elongation breakthrough — surface defects on formed parts | Shift-level detection |
Expert Review
In eighteen years of cold rolling mill reliability and quality engineering — tandem mills, reversing mills, Z-high mills for silicon steel — the most consistent gap I find at facilities with serious quality cost problems is not equipment condition monitoring, it is the disconnection between the roll shop and the mill. The roll shop grinds rolls to specification. The mill runs those rolls. When a strip quality complaint comes back from automotive, nobody can connect the complaint to the roll condition that produced it because the roll condition during the campaign in question was never recorded at the coil level. You know what was in service; you do not know what its condition was. iFactory changes that by linking roll shop measurement data, in-mill condition tracking, and strip quality records in a single traceable system. The second issue I encounter consistently is emulsion system management treated as a chemistry problem when it is really an analytics problem. The plants that have serious surface quality incidents with their automotive customers have them because their emulsion monitoring is sampled and lagged — weekly lab samples on a system that can develop biological contamination in 3 to 4 days and iron contamination from a filter bypass in hours. Continuous emulsion system monitoring with product-specific alert thresholds and a direct strip quality correlation is not a nice-to-have for automotive cold mill operations. It is a customer requirement that most plants are currently meeting with a program not designed to meet it."
Conclusion
Cold rolling mill quality and reliability management is precision work that requires precision data — monitored continuously, correlated with strip quality outcomes, and connected to actionable maintenance decisions with enough lead time to prevent the failure rather than respond to it. The 38% downtime reduction and 31% prime-to-secondary downgrade reduction at comparable facilities are the documented result of connecting roll surface condition tracking, bearing condition monitoring, emulsion system health, and control loop performance data into a unified mill health picture that replaces reactive alarm response with condition-based maintenance scheduling and proactive quality risk management.
iFactory's cold rolling mill analytics platform deploys on existing Level 2 automation, roll shop measurement systems, and emulsion plant SCADA without new sensor hardware at most facilities, establishing mill-specific baselines within the first rolling campaign and generating roll change recommendations, emulsion system alerts, and control loop degradation warnings that reduce both quality cost and maintenance cost simultaneously. Book a mill analytics assessment to see what iFactory would deliver on your specific cold mill configuration.
Frequently Asked Questions
The Roll Surface Quality Index (RSQI) is a composite metric calculated from three signal streams simultaneously: roll shop profilometer measurements at the grinding line (Ra, Rz, waviness), in-line strip surface Ra readings from post-stand profilometers that correlate with the roll surface condition producing them, and rolling noise spectrum analysis in the 400 Hz to 4 kHz band that is sensitive to roll surface pit initiation before it produces measurable strip surface impact.
iFactory monitors six emulsion system parameters continuously: concentration (via inline refractometer or conductivity probe), iron particle content (inline particle counter), pH, temperature, conductivity as an independent secondary contamination indicator, and filter system differential pressure across all filter stages. Biological contamination is detected through the combined signature of pH drift, conductivity change, and odor-indicator sensors where installed — producing a biological contamination alert 5 to 14 days before emulsion breakdown becomes visible in strip quality data, enabling a system treatment or replacement during a planned mill stop.
A tandem cold mill typically rolls 30 to 80 different grade-thickness-width combinations, each with different normal operating vibration levels, roll forces, emulsion requirements, and quality tolerances. iFactory addresses this through product-stratified baselines: the mill's production schedule is tracked by the platform, and every condition parameter is normalized to the current product's operating characteristics before comparison to the baseline.
Yes — and this differentiation is one of the most operationally valuable capabilities in the platform for cold mill quality management teams. Cold mill quality excursions have two distinct root cause categories: process parameter deviations (draft schedule errors, tension setpoint deviations, entry material property variation) and equipment condition degradation (roll surface fatigue, bearing wear, control system degradation). Conventional strip quality investigation starts with process data and often takes 2 to 3 days to determine whether an equipment condition was the contributing cause.
For a 5-stand tandem cold mill with roll shop integration, emulsion system monitoring, bearing condition tracking, and control loop performance analytics, iFactory's complete deployment runs $78,000 to $155,000 depending on the automation platform, roll shop measurement system connectivity, and emulsion plant instrumentation availability. The cost breaks into Level 2 and roll shop data integration ($22,000–$48,000), platform configuration including product cluster baseline setup, RSQI model calibration, and emulsion specification library ($28,000–$58,000), strip quality correlation model build and CMMS work order integration ($18,000–$35,000), and training and commissioning ($10,000–$14,000).