Hot Rolling Mill Descaling System analytics: Nozzle, Pump & Header Inspection

By Antonio Shakespeare on May 18, 2026

hot-rolling-mill-descaling-system-analytics_-nozzle,-pump-&-header-inspection

Hot rolling mills live and die on surface quality. The descaling system — that high-pressure water curtain that blasts mill scale off heated slabs before and between rolling stands — is one of the most mechanically punishing, operationally critical, and analytically underserved subsystems in the entire hot strip mill. When it works, nobody notices. When it fails, you see scale-in defects, customer rejections, and downstream finishing line shutdowns that trace back to a $12 nozzle that wore out three weeks before the coil was rolled.

This guide is structured as an operational analytics reference for maintenance engineers, process engineers, and reliability teams in U.S. hot strip mills. It covers nozzle inspection analytics, high-pressure pump performance tracking, header alignment diagnostics, descaling water treatment parameters, the scale pit management loop — with specific threshold values, decision logic, and the KPI structure needed to run descaling as a data-driven operation rather than a reactive one.

Descaling System Analytics · Hot Strip Mill · Inspection Framework

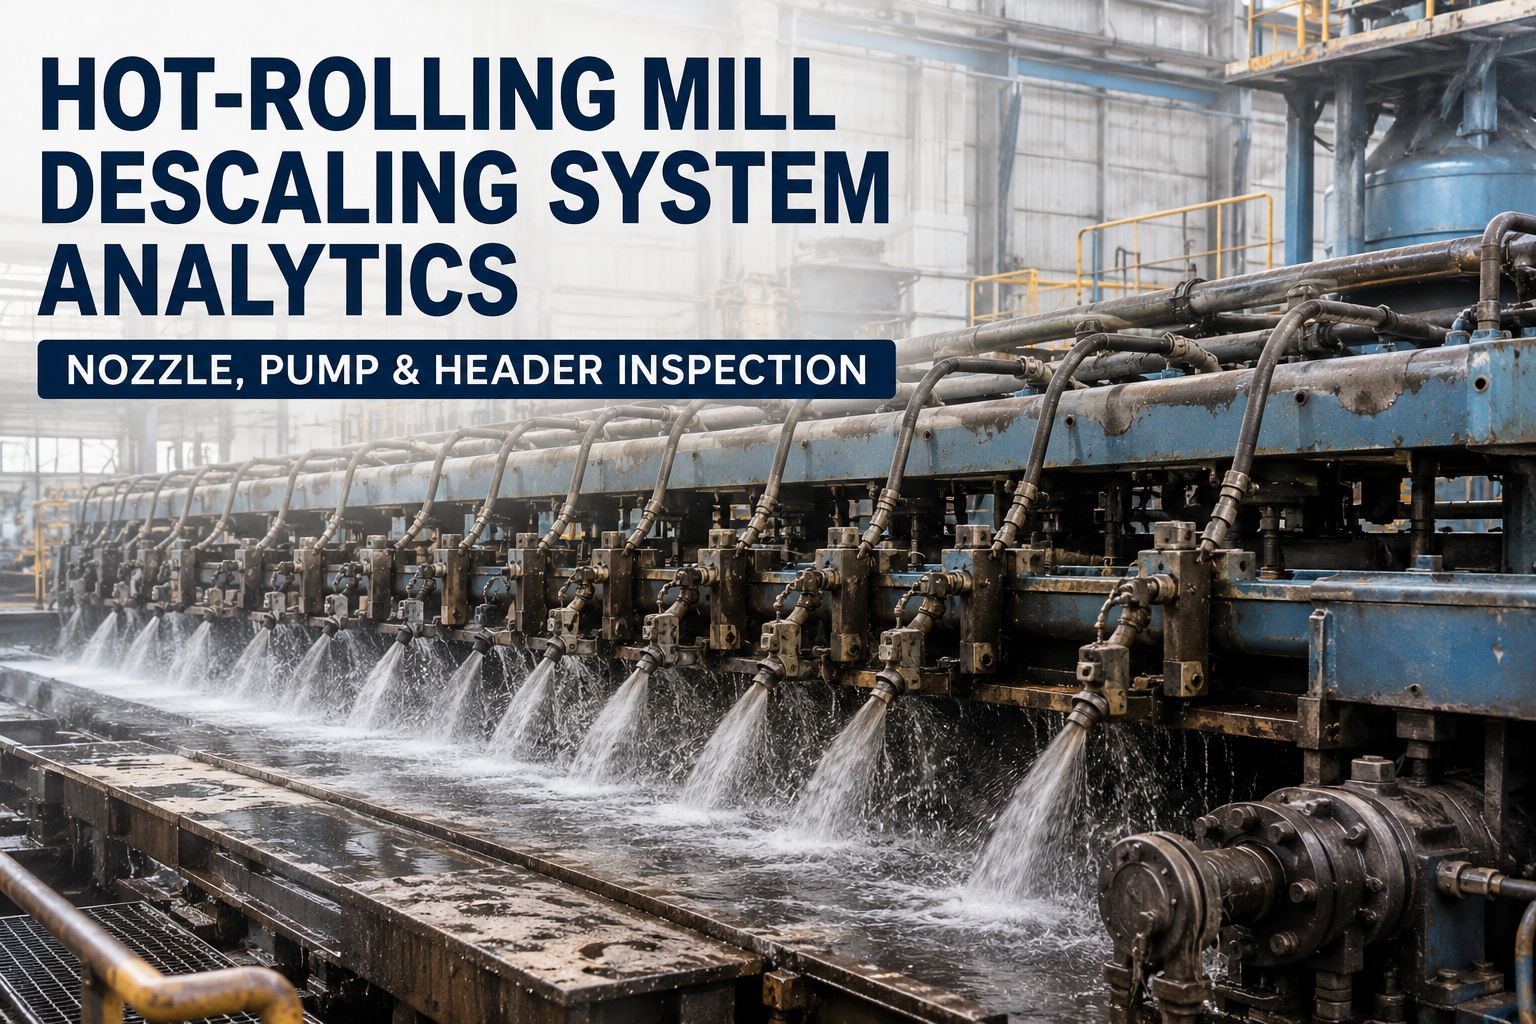
Hot Rolling Mill Descaling System Analytics: Nozzle, Pump & Header Inspection

Operational analytics framework covering high-pressure nozzle wear, pump performance tracking, header alignment, descaling water treatment, and scale pit management — engineered for U.S. hot strip mill reliability teams.
2,900+ PSI
Typical primary descaler operating pressure
0.4 mm
Nozzle orifice wear threshold before replacement
$180K+
Estimated cost per scale-in rejection campaign
72 hr
Max nozzle inspection interval at full campaign
Sources: AIST Steel Technology · SMS Group Descaling Engineering · Primetals Technologies · iFactory Plant Deployment Data 2026

Why Descaling Analytics Is Not Optional in 2026

Scale-in surface defects are the leading cause of hot-rolled coil rejections at U.S. flat-rolled mills. A 2024 AIST survey found that 38% of surface quality non-conformances traced directly to descaling system failures — nozzle wear, header misalignment, pump pressure dropout, or contaminated descaling water. These are not random failures. They are predictable, measurable, and preventable with the right analytics framework in place.

The fundamental problem is that descaling systems are designed to be robust enough to survive a brutal environment — 1,100°C slab surfaces, high-pressure water hammer, scale abrasion — which means they are often over-engineered to the point where failure is gradual and invisible until it lands in a surface defect. Analytics converts that gradual degradation into a visible and trended signal that maintenance can act on before the strip is rolled.

Nozzle Wear Is Gradual
Fan angle deviation of just 3° reduces descaling coverage by 15–20%. Wear accumulates over 400–600 coils and rarely triggers an alarm until coverage fails completely.
Pump Degradation Is Trended
Plunger pump volumetric efficiency drops 8–12% before pressure symptoms appear. Flow-vs-speed trending catches pump wear 3–5 weeks before pressure deviation is visible.
Header Misalignment Compounds
Thermal expansion cycles cause header sag of 1–3 mm per campaign. Unchecked over two or three campaigns, this creates systematic one-sided coverage gaps across the strip width.
Water Quality Drifts Seasonally
Dissolved solids, pH, and suspended iron oxide in descaling water vary significantly with season and recirculation load. Unmonitored water quality accelerates nozzle plugging and corrosion.

Nozzle Inspection Analytics — The Foundation of Descaling Performance

The flat-fan nozzle is the terminal point of the descaling system and the component most sensitive to wear. High-pressure water at 2,500–3,200 PSI exits through a precision-machined orifice, generating a flat fan that strikes the strip surface at a defined angle and impact pressure. As the orifice erodes — due to water velocity, suspended abrasives, and scale backwash — fan angle widens, impact pressure drops, coverage uniformity degrades. The table below defines the key nozzle inspection parameters, their measurement methodsand the action thresholds used by leading hot strip mill operations. Reserve a demo for Nozzle inspection analytics

Nozzle Inspection Analytics — Parameters, Methods & Action Thresholds
Reference: SMS Group Nozzle Engineering Specifications · Primetals Descaling Systems · AIST Technical Papers
Parameter Nominal Value Warning Threshold Replace Threshold Measurement Method Inspection Interval
Orifice Diameter Wear Baseline ± 0.1 mm +0.25 mm over baseline +0.40 mm over baseline Go/no-go gauge or optical CMM Every 72 hr at campaign
Fan Angle Deviation ±2° of spec angle ±3° deviation ±5° deviation Stroboscopic spray test bench Every 72 hr at campaign
Impact Pressure at Strip Per design chart −10% of design −18% of design Pressure mapping pad (static) Weekly or per campaign
Coverage Width Uniformity ±5% of spec width ±8% deviation ±12% deviation Thermal imaging or strip surface audit Per campaign start
Nozzle Plug / Blockage 0% plugged Any partial block detected Full plug or 50% flow loss Flow meter per header zone Continuous (real-time)
Nozzle Angle Alignment Design angle ±1° ±2° misalignment ±3° misalignment Laser alignment tool Per campaign or after impact
Nozzle Body Corrosion No visible pitting Surface pitting only Thread or seat corrosion Visual + dye penetrant Monthly or at replacement

The single highest-value nozzle analytics practice is tracking orifice wear against coil count — not calendar time. Wear rate varies significantly by steel grade, slab temperature, and water quality. Building a wear-per-coil trend for each nozzle position gives maintenance a predictive replacement trigger that eliminates both premature replacement waste and over-run defect risk.

Nozzle Inspection Checklist — Per 72-Hour Interval
Record orifice diameter with go/no-go gauge for each nozzle position and log against baseline
Run spray bench test on pulled nozzles — measure fan angle against design specification
Inspect nozzle threads and body for corrosion or impact damage — replace body if seat is compromised
Verify nozzle angular alignment post-reinstall with laser tool — torque to spec (typically 35–50 ft-lb)
Pull real-time flow meter readings per header zone — flag any nozzle position showing >15% flow deviation
Update CMMS wear trend log — plot orifice deviation vs cumulative coil count since last replacement

High-Pressure Pump Analytics — Performance Tracking & Failure Modes

The high-pressure pump package — typically triplex or quintuplex plunger pumps rated 3,000–4,000 PSI at 400–800 gpm — is the hydraulic heart of the descaling system. Pump analytics focuses on three measurable degradation vectors: volumetric efficiency (flow loss due to valve or plunger wear), pressure ripple (pulsation signatures that reveal valve timing issues), and drive power consumption (efficiency drop preceding mechanical failure). The workflow below maps the pump analytics process from data acquisition to maintenance action. Predict the failured before downtime happens

High-Pressure Pump Analytics Workflow
01
Baseline Capture at Commissioning
Record flow rate (gpm), discharge pressure (PSI), drive speed (RPM), motor current draw (A), and suction pressure at pump design point. This is your performance reference for all future trending.
02
Continuous Flow vs Speed Monitoring
Plot actual flow (gpm) against pump speed (RPM) in real time. Volumetric efficiency = actual flow ÷ theoretical displacement flow × 100%. A drop below 92% is a warning; below 85% triggers maintenance.
03
Pressure Pulsation Signature Analysis
High-speed pressure transducers at pump discharge capture pulsation waveforms. Triplex pumps produce 3× RPM fundamental frequency — deviations in amplitude or phase reveal individual plunger or valve issues without disassembly.
04
Power Consumption Trend
Motor kW consumption at constant pressure and speed is a leading indicator of mechanical losses — packing friction, bearing load, or valve seating issues. A 6–8% increase in specific power (kW/gpm) warrants inspection scheduling.
05
Valve & Plunger Condition Assessment
When analytics triggers maintenance: pull suction/discharge valve sets, measure plunger OD against wear limit, inspect packing for extrusion. Replace valve springs if fatigue life exceeds 80% of manufacturer's rated cycle count.
06
Post-Maintenance Performance Validation
Re-run baseline test after maintenance. Confirm volumetric efficiency ≥ 94%, pulsation within ±5% of baseline amplitude, and specific power within 3% of commissioning reference before returning to production.
Pump Analytics KPI Summary
≥ 92%
Volumetric Efficiency — Warning Below
Warning
≥ 85%
Volumetric Efficiency — Maintenance Below
Maintenance Trigger
± 5%
Pulsation Amplitude vs Baseline
Normal Band
+ 6–8%
Specific Power Increase — Inspect Trigger
Warning
< 50°C
Crankcase / Fluid End Temperature
Target
≥ 30 PSI
Suction Pressure at Pump Inlet
Minimum

Header Alignment & Structural Inspection Analytics

The descaling header — the manifold that distributes high-pressure water to individual nozzle positions across the strip width — is subject to thermal fatigue, impact damage from scale rebound, and gravitational sag over successive campaigns. Header analytics combines periodic laser alignment surveys, structural inspection data, and process data correlation to detect coverage degradation before it produces strip defects. The comparison below contrasts traditional header inspection practices against an analytics-driven approach.

Header Inspection Approach Comparison
Traditional Approach
Inspection Trigger
Calendar-based (quarterly)
Alignment Method
Visual check or tape measure
Sag Detection
Detected after surface defects appear
Thermal Fatigue Tracking
Not tracked — visual only
Coverage Gap Detection
Strip surface audit post-defect
Data Trail
Paper log or none
Result · Defects appear before action is taken
Analytics-Driven Approach
Inspection Trigger
Per campaign + condition alert
Alignment Method
Laser tracker — ±0.2 mm accuracy
Sag Detection
Trended per campaign — 1–3 mm sag threshold
Thermal Fatigue Tracking
Cycle count + UT thickness testing
Coverage Gap Detection
Real-time flow zone monitoring + thermal imaging
Data Trail
CMMS-linked inspection record with trend charts
Result · Alignment corrected before defects occur
Header Inspection Parameters & Action Values
Vertical Sag (center span)
OK: < 1.0 mm Warn: 1.0–2.0 mm Act: > 2.0 mm
Laser tracker survey per campaign
Lateral Offset (horizontal plane)
OK: < 0.5 mm Warn: 0.5–1.5 mm Act: > 1.5 mm
Laser tracker or dial indicator
Wall Thickness (UT inspection)
OK: ≥ 90% nominal Warn: 80–90% nominal Act: < 80% nominal
Ultrasonic thickness gauge at weld zones
Zone Flow Balance
OK: ±3% across zones Warn: ±5–8% deviation Act: > ±10% deviation
Flow meter per header zone (real-time)
Flange & Coupling Integrity
OK: No leakage, no fretting Warn: Seepage at joint Act: Visible weeping or corrosion at flange
Visual + dye penetrant at campaign
Nozzle Port Thread Wear
OK: Full thread engagement Warn: Minor damage — chase with tap Act: Stripped threads — header section
Go/no-go thread plug gauge at inspection
Download the Full Inspection Framework
Get iFactory's Descaling System Analytics Checklist for your CMMS
Pre-built inspection templates for nozzle wear, pump analytics, header alignment, and water quality — ready to import into any CMMS system.

Descaling Water Treatment Analytics & Scale Pit Management

Descaling water quality directly controls nozzle life, pump seal longevity, and descaling effectiveness. High-pressure water systems recirculate water through a scale pit, clarifier, and filtration train before returning to pump suction. As water quality degrades — suspended solids rise, pH drifts, dissolved iron increases — nozzle orifice wear accelerates and pump packing erodes faster and the hydraulic descaling efficiency drops. Water treatment analytics tracks the parameters that predict system degradation and not just the parameters that indicate it has already occurred.

Descaling Water Quality Analytics — Parameters, Targets & Control Actions
Water Parameter Target Range Warning Limit Control Action Monitoring Frequency
pH 7.0 – 8.5 < 6.5 or > 9.5 Dose acid or alkali — recheck in 2 hr Continuous (inline probe)
Suspended Solids (TSS) < 50 mg/L at pump suction 50–100 mg/L Increase clarifier blowdown rate; inspect filters Every 4 hr (grab sample)
Total Dissolved Solids (TDS) < 1,500 mg/L 1,500–2,500 mg/L Increase makeup water rate — reduce recirculation ratio Daily (conductivity meter)
Iron (Dissolved Fe) < 2 mg/L 2–5 mg/L Increase aeration; inspect clarifier weir — check pH control Twice daily (colorimetric)
Turbidity < 10 NTU at pump inlet 10–25 NTU Inspect and backwash filtration media — check clarifier polymer dosing Continuous (inline turbidity)
Inlet Water Temperature 15°C – 40°C > 45°C Increase cooling tower capacity — check heat exchanger Continuous
Biocide / Microbiological Biocide residual per spec Residual below 20% of spec Re-dose biocide — test for Legionella if temp > 35°C Weekly (culture test)
Scale Pit Management Analytics Loop
Mill Scale Generation
Scale produced by slab oxidation during furnace & roughing — 8–15 kg per metric ton of hot-rolled steel
Scale Pit Settling
Gravity settling removes coarse scale (> 100 µm). Monitor pit fill level — excavate when 60% full to maintain hydraulic residence time
Clarifier & Filtration
Lamella or DAF clarifier removes fine particles. Dual-media filtration targets < 50 mg/L TSS at pump suction. Backwash interval tracked by differential pressure
Return to Pump Suction
Treated water returned at < 50 mg/L TSS, pH 7.0–8.5, turbidity < 10 NTU — all parameters logged to historian at 1-minute intervals

Expert Review — What Top-Performing Mills Do Differently

Industry Benchmark Review
Hot Strip Mill Descaling Operations — U.S. High-Performance Reference

Best-in-class hot rolling mills achieving below 0.3% scale-in rejection rates follow four core descaling practices. They replace nozzles based on coil-count wear trends instead of fixed maintenance schedules, typically every 500–700 coils. Pump volumetric efficiency is continuously monitored as a real-time Level 2 KPI, with automatic alerts triggered below 90% efficiency. These mills also correlate downstream surface inspection data with live descaling parameters to directly link descaling performance with strip quality. In addition, inline turbidity and TSS sensors monitor water quality continuously at pump suction rather than relying on daily lab reports. All readings are logged into the historian at 1-minute intervals and integrated into nozzle wear analytics models. This data-driven approach improves surface quality consistency, reduces defects, and minimizes unplanned descaling failures.

< 0.3%
Scale-in rejection rate at top-performing mills
500–700
Coils per nozzle set (data-driven replacement)
90%
Pump volumetric efficiency alarm trigger

Conclusion

Hot rolling mill descaling systems have predictable failure modes, but most mills struggle due to poor data visibility rather than equipment complexity. Critical issues like nozzle wear, pump degradation, header misalignment, and water quality drift are often not monitored frequently enough to prevent strip defects. Leading mills use real-time analytics frameworks including 72-hour nozzle inspections, pump efficiency KPIs, laser alignment surveys, and inline water quality monitoring. These practices are already helping top-performing U.S. mills maintain scale-in rejection rates below 0.3%. The investment in descaling analytics is relatively small compared to the savings from reduced defects, longer equipment life, and fewer production disruptions. Mills still relying on quarterly inspections and paper logs are likely already absorbing significant hidden operational costs.

Frequently Asked Questions

What is the correct nozzle replacement interval for a hot strip mill descaler?
Replacement interval should be driven by orifice wear data — specifically, orifice diameter deviation from baseline — not by a fixed calendar schedule. Most flat-fan nozzles in primary descalers running standard carbon grades reach the replacement threshold of +0.40 mm orifice growth in 500–700 coils. However, high-alloy or high-silicon grades produce harder scale abrasion that can reduce nozzle life to 300–400 coils. Build a wear-per-coil trend for each nozzle position using go/no-go gauge data from 72-hour inspection intervals, and set your replacement trigger off that data rather than a default schedule.
How do I know if my high-pressure pump is losing volumetric efficiency before pressure drops?
The leading indicator is the flow-vs-speed relationship. Plot actual flow (gpm) against pump RPM continuously — as plunger seals or valve seats wear, actual flow will fall below the theoretical displacement curve before discharge pressure drops, because the pump compensates through speed before the control loop reaches its pressure limit. A drop in volumetric efficiency below 92% — actual flow ÷ (displacement per rev × RPM) — is your warning trigger. Pressure pulsation signature analysis via high-speed transducer is a complementary method that can identify which plunger or valve set is degrading without disassembly.
What causes one-sided scale defects on the strip even when the descaling system appears to be functioning?
One-sided scale defects — where scale removal is consistently better on one edge of the strip than the other — almost always indicate header misalignment or a systematic nozzle angle deviation on one side of the header. The most common cause is thermal sag: the header sags vertically over successive campaigns, shifting the nozzle fan angle downward on the center span and changing the impact geometry at the strip surface. Laser alignment survey per campaign, with vertical sag tolerance of < 1.0 mm at center span, is the diagnostic and preventive practice. Also check for flow imbalance between header zones using zone-level flow meters — a blocked nozzle on one side can cause the same symptom.
What suspended solids level is acceptable in the descaling water at pump suction?
The target is < 50 mg/L TSS at pump suction. At 50–100 mg/L, nozzle orifice wear rate increases measurably and pump packing erosion begins to accelerate — this is the warning band where clarifier and filtration performance should be investigated and corrected. Above 100 mg/L, nozzle life can drop to 40–60% of normal, and pump packing failure risk rises significantly. Inline turbidity sensors at pump suction (targeting < 10 NTU) are the real-time proxy for TSS and should be logged to the historian at 1-minute intervals to enable correlation with nozzle wear trends.
What is the typical cost of a scale-in defect rejection campaign at a U.S. hot strip mill?
The direct cost of a scale-in rejection campaign — downgraded or scrapped coils, logistics, and customer credit — typically ranges from $80,000 to $250,000 depending on coil count involved, product grade, and customer claim terms. The indirect costs — customer relationship impact, expediting substitute material, and the internal investigation and corrective action process — often add 30–50% to that figure. The economics of descaling analytics investment are straightforward: a single prevented rejection campaign at a $150,000 direct cost justifies the annual cost of an inline monitoring system, a structured nozzle inspection program, and pump analytics integration in a CMMS. Most mills running analytics-driven descaling programs report 70–90% reduction in scale-in rejections versus their pre-analytics baseline.
Prevent Scale-In Defects Before They Cost $180K Per Campaign

Build a Descaling Analytics Program Into Your CMMS — Starting This Quarter.

iFactory's industrial CMMS is pre-configured for hot rolling mill descaling analytics — nozzle wear tracking, pump performance KPIs, header inspection workflows, and water quality integration all in one platform. We will walk through your current inspection program, identify the data gaps driving your rejection rate, and map the highest-leverage analytics improvements available from your current baseline.
72 hr
Nozzle inspection cycle — analytics-driven
< 0.3%
Scale-in rejection rate at top-performing mills
$180K+
Average campaign rejection cost prevented
90%+
Pump efficiency monitoring threshold

Share This Story, Choose Your Platform!