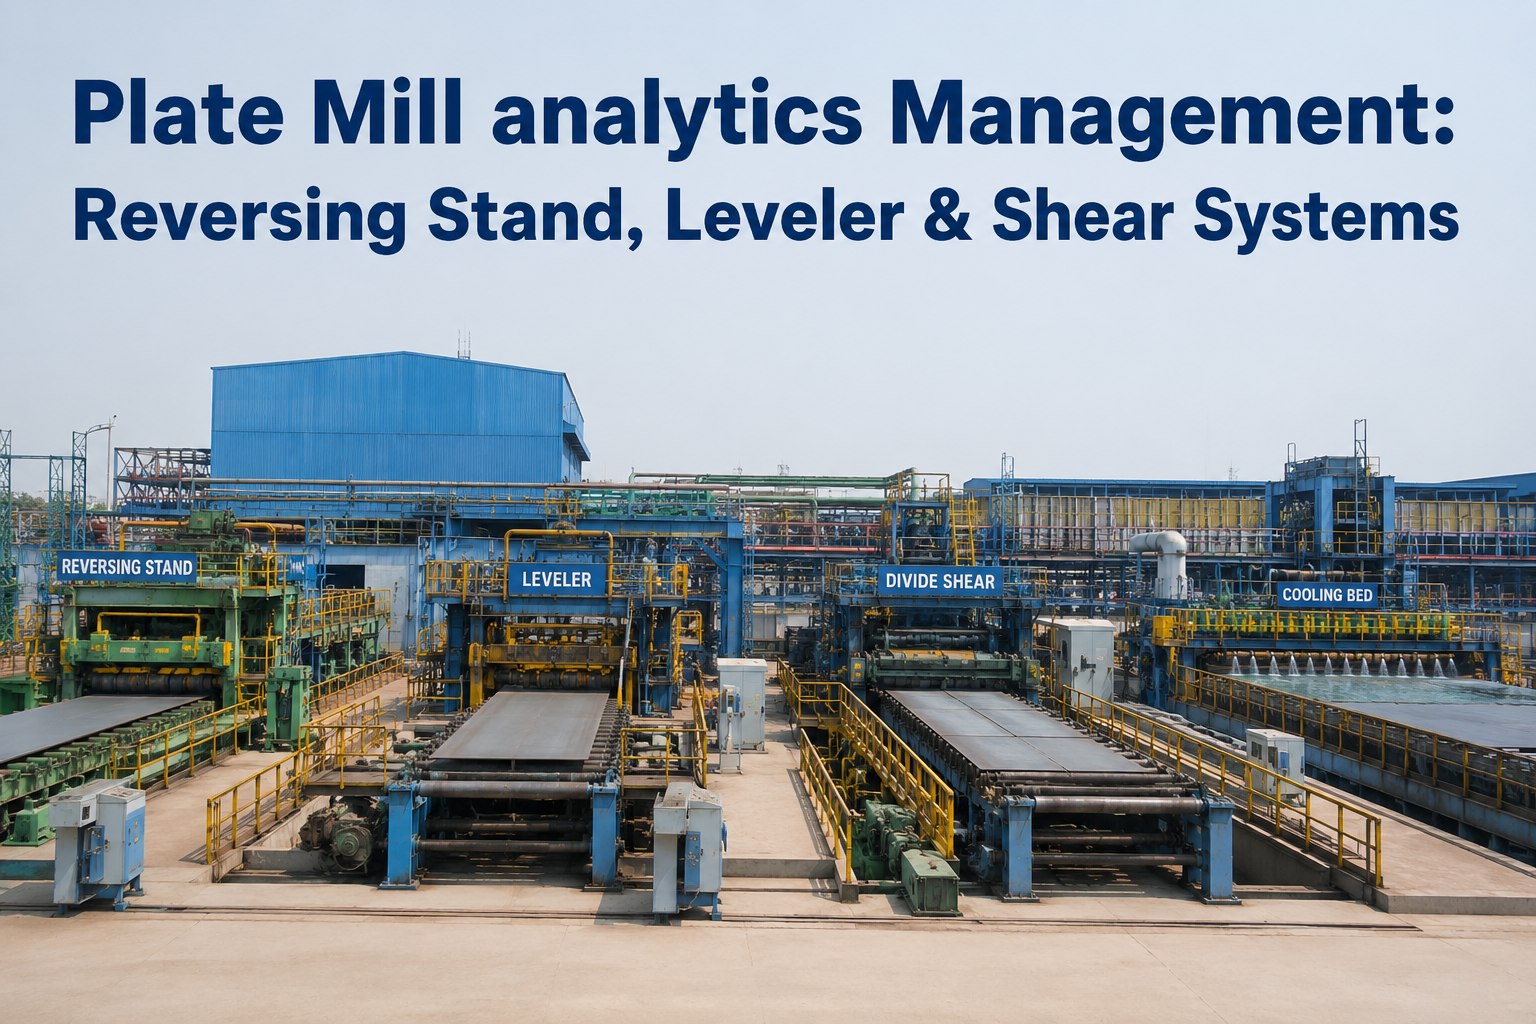
Every heavy plate mill is a sequence of precision-controlled force events — reversing stand passes, hot leveler corrections, divide shear cuts, cooling bed dwell times — where each stage either adds metallurgical value or introduces a defect that downstream quality gates will catch too late to recover. The mills running at maximum yield and minimum scrap rate are not necessarily the ones with the newest equipment. They are the ones with the clearest, most continuous visibility into what each stage of the process is actually doing versus what it should be doing, measured in real time, every coil and every plate. Plate mill analytics — applied across reversing stand, leveler, shear, and cooling bed systems simultaneously — is the operational intelligence layer that converts raw process data into the kind of actionable insight that drives measurable improvements in yield, surface quality, flatness conformance, and dimensional accuracy. This guide covers the complete analytics methodology for modern plate mills and how iFactory AI's platform delivers continuous, automated performance monitoring that gives process engineers the production visibility that manual data collection simply cannot match.
Why Plate Mill Analytics Is Structurally Different from Strip Mill Analytics
The analytical challenge in a plate mill is fundamentally different from a continuous hot strip mill — and applying strip mill monitoring methodologies to a plate operation produces incomplete, often misleading results. In a strip mill, the process is continuous: coil follows coil, throughput is measured in tonnes per hour at the coiler, and performance variability tends to be coil-to-coil rather than pass-to-pass. In a plate mill, the reversing stand introduces a pass-by-pass dynamic that requires a different analytical granularity entirely. A single slab may take 7 to 15 passes through the reversing stand before reaching target thickness. Each pass is a discrete force application event with its own roll gap, roll speed, entry temperature, and reduction percentage — and the cumulative effect of these pass variables determines whether the finished plate meets flatness, thickness, and microstructure specifications.
This pass-by-pass complexity means that meaningful plate mill analytics must operate at the individual pass level — not the slab level, not the shift level. iFactory's plate mill monitoring engine ingests data at the pass event resolution, linking each pass's process parameters to the quality outcomes measured at the leveler, inspection station, and final dimensional check. The result is a causal chain from rolling strategy to finished plate quality that identifies, for example, that flatness failures on a specific product-thickness combination are driven by a specific combination of entry temperature and reduction schedule in passes 4 through 6 — a finding that aggregate quality reporting would never surface.
- Quality deviations identified at inspection — after full processing cost incurred
- Pass schedule optimization based on experience and historical averages, not real-time mill response
- Leveler effectiveness measured by operator observation, not quantified correction data
- Shear timing and scheduling managed manually, creating cooling bed bottlenecks
- PM intervals based on calendar or production tonnage, not actual component condition
- Energy consumption per tonne tracked monthly — efficiency losses invisible at shift level
- Flatness and thickness deviation predicted at pass 6 — corrective action before final pass
- AI pass schedule optimization updated per slab based on actual temperature and mill response
- Leveler correction effectiveness quantified per plate — trend analysis identifies unit degradation
- Shear scheduling integrated with cooling bed occupancy — zero manual coordination required
- PM triggered by vibration, load signature, and wear pattern — not arbitrary intervals
- Energy per tonne tracked at pass resolution — inefficiency sources identified and eliminated
Reversing Stand Analytics: Pass-by-Pass Performance Monitoring
The reversing stand is the highest-energy, highest-complexity, and highest-defect-risk process stage in the plate mill. It is also the stage where real-time analytics delivers the most concentrated value — because every pass is an opportunity to adjust the rolling strategy based on actual mill response, and the window for correction closes with each successive pass. iFactory's reversing stand analytics operates at the individual pass event level, capturing and analyzing the full set of pass variables that determine rolling quality and equipment health simultaneously. Book a Demo to Monitor Performance
Hot Leveler Analytics: Quantifying Correction Effectiveness Per Plate
The hot leveler is the quality rescue stage of the plate mill — its function is to correct the residual flatness deviation that emerges from the rolling sequence before the plate is dimensionally committed by the divide shear. In most plate mills, leveler performance is assessed subjectively: operators observe the plate entry profile and set the leveler parameters based on experience. The exit condition is checked visually or with a straightedge, and if the plate is "good enough," it advances to the shear. This is not an analytics problem — it is an absence of analytics where analytics would deliver the most concentrated quality improvement.
iFactory's hot leveler analytics module quantifies the full correction cycle for every plate that passes through the unit. Entry flatness deviation — measured in I-units or mm/m depending on the measurement system installed — is recorded before the plate enters the leveler. Exit flatness is measured after. The difference is the leveler's correction effectiveness for that plate, under those conditions, at that temperature. Plotted across thousands of plates, this data reveals the leveler's performance envelope: the range of entry flatness conditions under which the leveler reliably achieves specification, the conditions under which it struggles, and the specific roll cassette settings or roll gap profiles that maximize correction for each entry condition type. This performance mapping is unavailable through any means other than systematic data collection and analysis. Schedule a hot leveler analytics
Divide Shear & Cooling Bed: Scheduling Analytics and Throughput Optimization
The divide shear and cooling bed represent the throughput bottleneck of many plate mills — not because of equipment capacity limits, but because of scheduling coordination failures between the rolling mill, leveler, and downstream surface inspection and marking systems. A cooling bed that is 80% occupied with plates waiting for dimensional inspection clearance is not a cooling bed capacity problem — it is a scheduling analytics problem, and it is solvable without capital investment once the data is available to coordinate the stages properly.
The scheduling model iFactory builds around the cooling bed eliminates the most common throughput constraint in plate mill dispatch operations: plates occupying cooling bed positions beyond their required cooling time because no one has coordinated their transfer to downstream processing. In high-product-mix plate mills producing a range of thicknesses, grades, and ordered lengths simultaneously, this coordination failure is nearly universal without automated scheduling analytics — and it caps achievable throughput at 85 to 92% of theoretical cooling bed capacity in mills managing the problem manually. iFactory's cooling bed occupancy analytics has recovered 3 to 8% dispatch throughput in plate mills where cooling bed scheduling was the binding constraint.
Predictive Maintenance Integration: Reversing Stand, Leveler, and Shear Systems
The equipment in a plate mill operates under some of the most severe mechanical loading conditions in any manufacturing environment. Reversing stand roll forces of 50 to 90 MN. Hot leveler cassettes deflecting under loads that vary with every plate's entry profile. Divide shear blades experiencing impact fatigue with each cut cycle. The maintenance cost of plate mill equipment is significant — and the throughput cost of unplanned failures on these assets is even more significant, because any one of them can idle the entire rolling sequence. iFactory's predictive maintenance integration applies condition monitoring analytics to each of these assets, shifting the PM strategy from calendar-based to condition-based at the equipment level that matters most.
| Equipment Asset | iFactory Monitoring Parameters | Failure Mode Detected | Warning Lead Time | Estimated Avoided Cost / Event |
|---|---|---|---|---|
| Reversing Stand Work Roll Bearings | Vibration (radial + axial), bearing temperature, roll force asymmetry | Spalling, lubricant breakdown, race cracking | 7–21 days | $280,000–$620,000 |
| Main Drive Spindle Couplings | Torque signature, vibration at coupling frequency, thermal imaging | Wear, play development, fatigue cracking | 10–30 days | $150,000–$380,000 |
| Hydraulic Roll Gap System | Cylinder pressure asymmetry, servo valve response time, position accuracy | Seal degradation, servo valve wear, accumulator loss | 3–14 days | $90,000–$210,000 |
| Hot Leveler Roll Cassette | Roll deflection pattern, correction force distribution, temperature gradient across width | Roll crown wear, bearing play, frame deflection | 5–18 days | $120,000–$290,000 |
| Divide Shear Blade & Hold-Down | Blade impact signature, cut energy per cycle, hold-down force consistency | Blade edge chipping, hold-down wear, frame fatigue | 4–12 days | $60,000–$140,000 |
| Side Trimmer Disc Blades | Cutting force trend, edge quality camera analysis, vibration at cutting frequency | Disc edge wear, arbor bearing degradation | 7–21 days | $45,000–$110,000 |
Expert Perspective: What AI Analytics Changes in Plate Mill Operations
We had been managing our reversing stand roll changes on a fixed-tonnage interval for eleven years. The interval was set conservatively — we never wanted to run a campaign too long and risk a quality failure. When we deployed iFactory's roll crown tracking, the first finding was that we were changing rolls on average 18% earlier than the actual crown deviation warranted. That's 18% fewer roll changes per year — roughly $340,000 in grinding costs and roll shop labor that we had been spending unnecessarily. The second finding was more important: two specific product-thickness combinations were producing crown deviation failures within the first third of the roll campaign, and we had never connected those quality events to roll condition because the LIMS and the rolling system were completely separate. The AI joined those datasets and showed us that we needed a modified entry thickness schedule for those products during the first 40,000 tonnes of each roll campaign. We implemented it in one outage. Flatness rejects on those two products dropped 74% in the following quarter.
Frequently Asked Questions: Plate Mill Analytics
At minimum, iFactory requires access to the rolling mill's Level 2 process data historian — which in most plate mills contains pass-level rolling force, roll gap position, roll speed, and temperature data. This is sufficient to begin pass schedule analysis, energy monitoring, and roll wear tracking. For full quality integration — linking pass data to flatness, thickness, and surface quality outcomes — iFactory additionally connects to the Level 3 MES and LIMS systems where quality measurements are recorded. Integration with OSIsoft PI, Siemens historian, and ABB historian environments is typically completed in 1 to 2 weeks without process disruption. A data readiness assessment is available at no cost to determine the specific analytics scope your current infrastructure supports before any commitment.
iFactory's flatness prediction model incorporates heat chemical composition data from the steelmaking L3 system as a direct input — allowing the rolling model to adjust its flatness risk assessment based on the specific grade's deformation resistance characteristics and cooling behavior. Temperature non-uniformity across the slab width, measured by the entry pyrometer array or thermal imaging system, is incorporated as a per-pass correction factor that adjusts the predicted spread and flatness deviation for each pass. For plants without thermal imaging, iFactory uses the rolling force asymmetry signature during the pass to detect temperature non-uniformity across the width in real time — providing a proxy measurement that allows flatness risk flagging even without a dedicated thermal measurement system.
Yes — and high-product-mix mills including TMCP and Q&T producers typically see the largest quality improvement from iFactory's analytics, because the process window management complexity is highest in these operations. iFactory maintains separate rolling and cooling models for each product family, with TMCP grades requiring accelerated cooling rate tracking and finish rolling temperature control that is more tightly toleranced than structural grades. For Q&T products, iFactory tracks the as-rolled thickness and flatness against the austenitizing furnace capacity limits — identifying plates that are at risk of poor flatness response to quenching based on their pre-quench profile and the furnace temperature uniformity data. This pre-quench quality flag reduces the proportion of plates requiring cold leveler correction after heat treatment, which is one of the most expensive re-processing operations in a plate mill.
iFactory integrates side trimmer cutting force and edge quality data into the plate quality record, linking trimmer performance to final dimensional compliance. Trimmer disc wear is tracked via cutting force trend analysis — a rising force-per-cut at constant plate thickness indicates disc edge degradation, triggering a blade change recommendation before edge quality deteriorates enough to produce a customer-visible edge defect. For plate marking systems, iFactory validates marking completeness and legibility by cross-referencing the marking system's output log against the production order — flagging plates with missing or incomplete heat number, grade, or dimension marking before they reach the shipping bay, eliminating the rework cost of re-marking plates at dispatch.
iFactory's plate mill deployments typically reach full cost recovery within 8 to 14 months of deployment, with the fastest payback cases occurring when the platform identifies a high-frequency quality failure mode in the first 60 days that, once resolved, reduces scrap and rework costs by more than the platform's annual fee in a single quarter. For a plate mill producing 800,000 TPY with a scrap rate of 2.8%, reducing that rate to 2.2% through AI quality prediction represents approximately 4,800 tonnes of additional finished plate per year — worth $4.3 to $7.2 million at current structural plate market pricing, depending on grade mix and regional market. The energy savings from pass schedule optimization — typically 3 to 5% reduction in specific energy consumption — add a secondary payback stream that is not dependent on scrap rate assumptions. An ROI modeling session using your plant's specific production economics is available at no cost.
Conclusion: The Analytics Layer Your Plate Mill Is Missing
The gap between what a plate mill's equipment is capable of producing and what it actually produces on any given day is a data problem before it is an equipment problem. Reversing stands that could run higher reductions are constrained by conservative setpoints that no one has updated since the last process control tuning exercise. Levelers that are losing correction effectiveness gradually are identified only when final inspection rejection rates rise enough to trigger a review. Cooling beds that are scheduling plates inefficiently are consuming throughput capacity that shows up as "production losses" in the shift report without a root cause attached. These are solvable problems — and they are solvable with the data that most plate mills are already generating, once that data is collected, analyzed, and acted on at the resolution that AI-powered analytics makes possible.
iFactory's plate mill analytics platform brings pass-level process visibility, integrated quality prediction, and condition-based maintenance scheduling to plate mill operations that have been managing these systems in isolation. The result is a mill that runs closer to its design capability, produces fewer off-specification plates, spends less on unplanned maintenance, and dispatches more saleable tonnes per operating hour — with no new equipment and no capital approval required to begin. The data is already there. The analytics just needs to be applied to it.