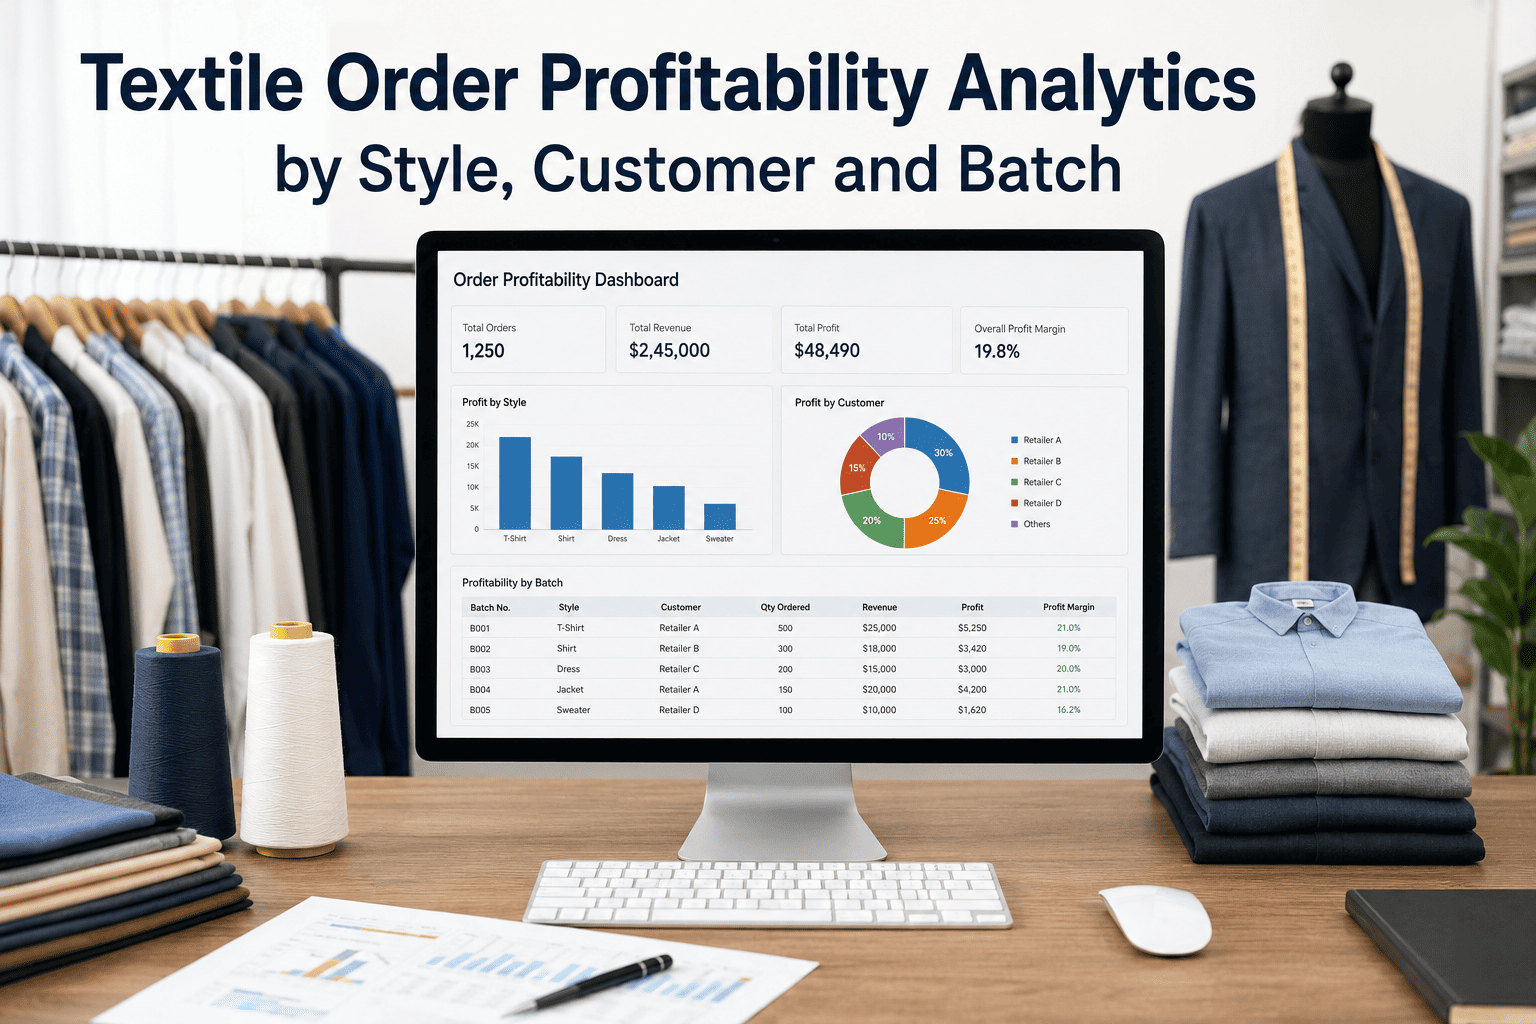
Ask a mill's finance team which customer order was actually profitable last quarter and most can only answer at the plant level — total revenue against total cost, with no way to see that one customer's orders consistently run high rework while another's low-margin styles are quietly subsidized by everyone else's. Standard costing sheets built once a year and never revisited can't capture what actually happens on the floor: yield loss on a difficult yarn count, machine time overruns on a complex weave, or utility cost spikes during a rush order. Order profitability analytics closes that gap by calculating true margin at the level that matters — by style, by customer, by batch — using real production data instead of static assumptions. If your P&L can't tell you which orders you should be chasing more of and which you should be pricing differently, Book a Demo to see real order-level margin in iFactory.
Know Which Orders Actually Make You Money
iFactory's Manufacturing Analytics calculates true order margin using material yield, machine time, rework, utility cost and delivery performance — not a standard cost sheet frozen in time.
Why Standard Costing Hides the Truth About Your Margins
Standard costing works from planned material usage, planned machine time and planned yield — figures that were reasonable estimates when the cost sheet was built, but rarely reflect what actually happens on any given production run. A style that looks comfortably profitable on paper can be quietly losing money in practice if it consistently runs above-average rework or ties up a bottleneck machine longer than planned, and nobody notices because the cost sheet never gets revisited against actual outcomes.
This blind spot is especially costly with customer-specific work. A customer who demands tight tolerances, frequent small-batch changeovers or expedited delivery may look identical to any other customer on the revenue line, while their orders quietly consume far more machine time, utility cost and rework labor than the standard cost model ever accounted for. Without order-level analytics, that customer's true cost to serve stays invisible until someone finally investigates why margins overall feel thinner than the numbers suggest.
What Goes Into a True Order Margin Calculation
Each deduction in this chain uses actual production data rather than a planned estimate — real yarn consumption against the actual roll, real machine hours logged against that specific batch, and real rework units tied back to the order that generated them. This is what allows two orders with identical revenue and an identical standard cost sheet to show meaningfully different true margins once actual performance is accounted for. Finance and operations teams can Book a Demo to see this waterfall built against their own recent orders.
Three Views Into the Same Data, Three Different Decisions
By Style
Identify which fabric constructions or yarn counts consistently underperform on yield or machine efficiency, and adjust pricing or production planning accordingly.
By Customer
See true cost-to-serve per customer relationship, including the hidden cost of frequent small batches, tight tolerances or expedited delivery demands.
By Batch
Drill into a single production run to understand exactly why margin diverged from the standard cost estimate — which line, shift or machine drove the gap.
See Your Top Ten Customers Ranked by True Margin, Not Revenue
Most finance teams are surprised by at least one customer relationship once actual cost-to-serve replaces the standard cost assumption.
Common Margin Leaks Order Analytics Uncovers
| Margin Leak | Where It Hides | Analytics Response |
|---|---|---|
| Yield Variance | Difficult yarn counts consuming more raw material than the cost sheet assumes | Flags styles with consistent negative yield variance |
| Machine Time Overrun | Complex weaves or frequent changeovers tying up bottleneck equipment | Compares actual machine hours against planned per order |
| Silent Rework | Quality corrections absorbed into general overhead instead of the order that caused them | Attributes rework labor and material directly to source order |
| Expedite Premium | Rush orders consuming overtime and utility cost never billed back accordingly | Calculates true cost of expedited delivery per customer |
From Insight to Pricing Action
Order profitability data is only valuable if it changes a decision, and the most direct path from insight to action is pricing and production planning. Once a style or customer relationship is confirmed to run consistently below target margin, sales and operations teams have concrete, order-level evidence to renegotiate pricing, adjust minimum order quantities, or reprioritize production capacity toward higher-margin work. This turns profitability analytics from a reporting exercise into an active lever on the business, reviewed monthly rather than discovered once a year during budget season.
Frequently Asked Questions
How does order profitability analytics get actual cost data without manual entry?
Material consumption, machine hours, rework units and utility allocation are pulled directly from the same production and quality data your MES and CMMS systems already capture, rather than requiring a separate manual costing exercise. This is what makes true order-level margin practical to calculate for every order rather than a sample audit a few times a year.
Can this replace our standard costing system entirely?
Most mills run order profitability analytics alongside standard costing rather than replacing it outright — standard costs remain useful for quoting new business, while actual order-level analytics shows where reality diverges from that estimate and by how much. Over time, the gap data itself often improves future standard cost accuracy.
How is utility cost fairly allocated to a specific order or batch?
Utility allocation uses actual machine run time and department-level utility consumption data for the specific shift and equipment involved in producing that order, rather than a flat plant-wide average. This produces a far more accurate picture for orders that run on energy-intensive processes like dyeing or finishing. Full methodology is available through Support.
Can we see profitability trends over time, not just a single order snapshot?
Yes — the platform tracks margin trends by style and customer across multiple orders and seasons, making it possible to see whether a relationship is improving, stable or deteriorating rather than judging performance off a single data point.
Who typically uses this data day to day — finance or operations?
Both — finance uses order profitability data for pricing decisions and customer negotiations, while operations uses the same batch-level detail to identify process improvements that directly protect margin. Book a Demo to see how both teams work from the same dashboard.
Stop Pricing and Planning on Assumptions
Every mill has orders that look profitable on paper and orders that quietly aren't — the only way to tell the difference is to calculate margin against what actually happened on the floor, not what was planned months ago. iFactory's order profitability analytics gives finance and operations a shared, accurate view of style, customer and batch-level margin, turning pricing and production decisions from guesswork into evidence.
See Your Real Numbers, Not Your Standard Cost Sheet
Bring a sample of recent orders — we'll show you exactly where actual margin diverged from what was planned.