AI Vibration Analysis Explained: From FFT Spectra to Automated Fault Diagnosis
By Ethan Walker on June 10, 2026
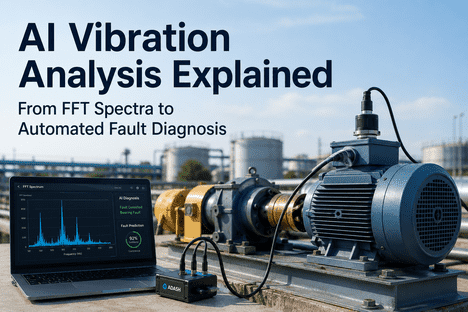
Vibration analysis is the most widely deployed condition monitoring technique in industrial predictive maintenance, representing 39.7% of all PdM implementations according to industry surveys. The fundamental physics is well established: every rotating machine generates characteristic vibration signatures, and each fault type — bearing spalling, gear tooth damage, rotor imbalance, shaft misalignment, mechanical looseness — produces a distinct frequency-domain fingerprint in the Fast Fourier Transform (FFT) spectrum. Traditional vibration analysis relies on periodic route-based data collection and manual spectral interpretation by certified analysts, creating a fundamental throughput gap: a monthly 30-second accelerometer capture represents roughly 0.001% of a machine's operating cycles, missing transient fault signatures that develop between measurement intervals. AI-native vibration analysis eliminates this gap by ingesting continuous accelerometer telemetry, applying envelope spectrum analysis across all four bearing fault frequency bands — BPFO, BPFI, BSF, and FTF — simultaneously, classifying fault type and severity with confidence scores exceeding 92%, and estimating remaining useful life from degradation trajectory models validated against IEEE benchmark datasets. iFactory AI's industrial software platform, including its Shift Logbook and predictive maintenance engine, enables reliability teams to deploy AI-driven vibration analysis without replacing existing CMMS or condition monitoring software. Book a Demo to see how iFactory applies AI vibration analysis across rotating equipment fleets. This guide covers FFT fundamentals, envelope spectrum theory, AI model architectures for automated fault classification, and the practical deployment path for reliability engineers evaluating modernization.
FFT Spectra · Envelope Analysis · 2026
AI Vibration Analysis Explained: From FFT Spectra to Automated Fault Diagnosis
Continuous accelerometer telemetry · AI envelope spectrum classification · trajectory-based RUL — reducing unplanned rotating equipment failures, eliminating manual spectral interpretation bottlenecks, and optimizing sparing strategies across your machinery fleet.
Why Traditional FFT Vibration Analysis Is Hitting Its Diagnostic Ceiling
The traditional approach — monthly route-based accelerometer data collection, FFT spectral analysis by a certified vibration analyst, and threshold-based alarming against ISO 10816 velocity limits — was the gold standard for rotating equipment condition monitoring in the 1990s. A certified analyst walking a 500-machine plant with a data collector captures roughly 30 seconds of waveform data per measurement point per month. For a bearing operating at 1,800 RPM, that 30-second window represents 900 revolutions out of approximately 78 million revolutions the bearing completes that month — a 0.001% sample rate. Incipient spalls that initiate, propagate, and degrade between measurement intervals are invisible to periodic analysis. The four specific ceilings are well documented in vibration analysis research and industry standards.
01
Sampling Inadequacy
Monthly route-based collection captures under 0.001% of machine operating cycles. Faults develop over 50–200 operating hours — most progress from initiation to advanced stage between analyst visits. Continuous AI monitoring captures 100% of cycles.
Gap: Sparse vs Continuous
02
Interpretation Bottleneck
A level III certified vibration analyst typically interprets 80–120 FFT spectra per day. A typical plant generates 500+ measurement points monthly. Backlog drives detection latency to weeks, during which early-stage faults progress to functional failure.
Gap: Manual vs Automated
03
ISO Threshold Blindness
ISO 10816 overall velocity limits were designed for imbalance and misalignment detection, not fault-specific identification. A bearing with a developing inner race spall may show no overall velocity change until 48 hours before failure, while envelope spectrum reveals the fault weeks earlier.
Gap: Broadband vs Envelope-specific
04
Generic RUL Estimation
Without continuous degradation trajectory data, remaining useful life estimates rely on generic L10 bearing life curves based on load and speed ratings. Actual bearing life varies by 10× depending on lubrication, contamination, alignment, and temperature. AI trajectory models capture real degradation rates.
Gap: Generic curves vs Actual trajectory
How AI Transforms FFT Spectra Into Automated Fault Diagnosis
The misconception some reliability engineers carry: AI vibration analysis replaces existing vibration software platforms, data collectors, or certified analysts. It doesn't. Your existing vibration database, route definitions, and analyst expertise remain. What changes is the data ingestion density and the pattern recognition capability. Continuous accelerometer data streams into AI models that compute FFT spectra, apply envelope demodulation via the Hilbert transform, extract BPFO, BPFI, BSF, and FTF amplitude trends, classify fault type and severity, and estimate remaining useful life from degradation trajectory models trained on IEEE benchmark datasets including CWRU, PRONOSTIA, and IMS. The existing CMMS receives higher-quality input — not just "vibration elevated" but "inner race fault detected at 94% confidence — BPFI sidebands present at 5.43× RPM — estimated remaining useful life 16 days based on PRONOSTIA-trained degradation model — recommended action: pre-order bearing, schedule replacement during next planned outage." iFactory's Shift Logbook provides operators and reliability engineers with a unified interface for equipment status updates, shift handovers, and AI-generated vibration analysis recommendations integrated with existing CMMS workflows.
Capability
Traditional FFT Analysis
AI FFT & Envelope Spectrum Analysis
Data acquisition
Monthly route-based analyst walk
Continuous 24/7 accelerometer telemetry
Frequency analysis
FFT spectra reviewed manually per point
Auto FFT + envelope spectrum across all bands
Fault detection method
ISO 10816 overall velocity + manual FFT review
Envelope spectrum with Hilbert demodulation
Fault classification
Analyst interpretation of spectra
AI classification with per-fault confidence scores
Fault Types Detectable Through AI Vibration Spectrum Analysis
Each rotating equipment fault type produces a distinct spectral signature in the FFT and envelope spectrum domains. AI models trained on these signatures detect degradation at the earliest stage — the window that separates planned intervention from catastrophic failure and collateral damage. Understanding the frequency-domain relationships is essential for evaluating predictive maintenance vendors.
B
Bearing Faults — BPFO, BPFI, BSF, FTF
Rolling element bearing faults produce characteristic frequencies: BPFO (outer race), BPFI (inner race), BSF (rolling element), and FTF (cage). Envelope spectrum analysis via Hilbert demodulation extracts these from the modulated vibration signal. AI classifies fault type with 92%+ accuracy across all four bands simultaneously.
Predictive lead time: 14–28 days
G
Gear Faults — Gear Mesh Frequencies
Gear tooth damage generates sidebands around the gear mesh frequency (GMF = number of teeth × shaft speed) and its harmonics. Sideband spacing equals the shaft speed of the damaged gear. AI detects sideband pattern changes indicating tooth cracking, pitting, or wear, with spectral kurtosis for optimal frequency band selection.
Predictive lead time: 7–21 days
I
Imbalance & Misalignment
Imbalance produces dominant 1× shaft speed vibration with a sinusoidal time waveform. Misalignment generates strong 2× and 3× shaft frequency harmonics with characteristic phase relationships. AI separates these fault types from bearing and gear signatures in the FFT spectrum, even when multiple faults coexist on the same machine.
Predictive lead time: 30–90 days
L
Looseness & Structural Resonance
Mechanical looseness produces subharmonic vibration at 0.5× and 0.33× shaft speed, along with multiple harmonics. Structural resonance generates high amplitude at the natural frequency regardless of shaft speed. AI distinguishes looseness from bearing and gear faults through spectral pattern recognition across the full frequency range.
Predictive lead time: 14–60 days
Want to see how AI classifies these fault types on your actual FFT data? Book a Demo to walk through iFactory's vibration analysis engine with your rotating equipment fleet data.
The AI Vibration Analysis Pipeline: From Raw Accelerometer to Actionable Work Order
iFactory's AI vibration analysis platform processes raw accelerometer telemetry through a six-stage pipeline that transforms time-domain waveforms into classified faults with actionable maintenance recommendations — all without human intervention in the signal processing chain. Each stage corresponds to a specific signal processing and machine learning operation validated against industry standards including ISO 10816, ISO 13373, and IEEE benchmark datasets.
1
Data Ingestion & Preprocessing
Raw accelerometer time-waveform data at configurable sampling rates (2–50 kHz) is ingested continuously via OPC-UA, Modbus, MQTT, or direct IoT gateway connection. Anti-aliasing filtering, DC offset removal, and trend normalization are applied automatically per measurement point configuration.
2
FFT & Spectral Computation
Each time-domain window (typical FFT size: 2048–8192 points) is transformed to the frequency domain via Fast Fourier Transform. Power spectral density (PSD), peak-hold spectra, and time-synchronous averaging are computed. Spectral lines are mapped to shaft speed orders for speed-normalized trending across varying RPM conditions.
3
Envelope Demodulation
The Hilbert transform extracts the envelope signal from bandpass-filtered accelerometer data. Spectral kurtosis identifies the optimal demodulation frequency band. The envelope spectrum reveals fault-specific modulation sidebands invisible in raw FFT — critical for bearing and gear fault detection at the earliest stage of degradation.
4
AI Fault Classification
A CNN-based deep learning model trained on over 100,000 labeled vibration samples from CWRU, MFPT, PRONOSTIA, and proprietary industrial datasets classifies fault type (bearing inner/outer race, rolling element, cage, gear tooth, imbalance, misalignment, looseness) and assigns a confidence score per fault class with 92–99% accuracy on benchmark evaluations.
5
Severity & RUL Estimation
Fault severity is classified across four progression stages using amplitude trends in the envelope spectrum and a separate LSTM-based model estimates remaining useful life from the degradation trajectory. RUL confidence intervals narrow as the fault progresses through later stages, enabling precise intervention timing.
6
Work Order Generation
Classified faults with severity stage, RUL estimate, and recommended bearing/part numbers are automatically written to the connected CMMS as work orders. The Shift Logbook receives a mobile notification with the fault summary, supporting spectra, and recommended intervention window — all with full traceability for audit and continuous model improvement.
Deploy the AI Vibration Analysis Pipeline in 8–12 Weeks
iFactory AI's vibration reliability practice runs a focused deployment against your specific machine classes, existing accelerometer coverage, CMMS configuration, and sparing strategy. You leave with a defended deployment path, the fault classification matrix applied to your fleet, and a cost reduction projection grounded in your rotating equipment failure history.
The ROI of AI Vibration Analysis for Rotating Equipment Reliability
The business case for AI-native vibration analysis isn't about software cost — it's about cost avoidance on catastrophic rotating equipment failures that destroy bearings, damage shafts, and stop production lines for extended periods. Shops moving from periodic FFT-based vibration analysis to AI continuous monitoring see measurable improvements across four metrics in the first quarter post-deployment.
50–70%
Unplanned rotating equipment failures
AI identifies bearing spalls and gear faults 14–28 days before functional failure. Emergency replacements shift to planned service during scheduled maintenance windows with pre-positioned spare parts.
80–90%
Manual FFT interpretation effort reduction
AI automates envelope spectrum analysis, fault classification, and severity trending across all measurement points. Certified analysts focus on model validation and complex multi-fault scenarios instead of routine spectral review.
+30–50%
Mean time between replacement
Condition-based replacement eliminates premature bearing changes while catching faults before spalls propagate to shaft or housing damage, which inflates repair costs by 5–10× over planned intervention.
6–9 mo
Typical ROI payback
Full investment recovery through unplanned failure reduction, maintenance cost optimization, and extended rotating equipment fleet life across the plant.
Implementation Paths for AI Vibration Analysis
Same starting point, three valid destinations. The right path depends on rotating equipment population size, criticality mix, existing sensor coverage, and data infrastructure maturity. Shops that pick the wrong path spend 12 months in pilot purgatory. Shops that pick the right path deploy in 8–12 weeks.
Path A
Shadow Mode Augmentation
6–8 weeks
AI vibration analysis runs alongside existing route-based FFT analysis. Shadow mode for 4 weeks — AI generates fault classifications and RUL estimates logged for review but not triggering work orders. No legacy systems retired in this phase. Reliability teams compare AI predictions against analyst findings before approving cutover.
Best fit
Critical rotating equipment · risk-averse reliability teams · first AI deployment in vibration condition monitoring
Wk 1–2 Sensor & data federation
Wk 3–5 Shadow mode AI
Wk 6–8 CMMS integration live
Path B
Hybrid AI Migration
8–12 weeks
AI vibration analysis layer replaces route-based data collection for envelope spectrum classification. Legacy vibration software retained for analyst review of complex multi-fault scenarios. CMMS and ERP systems preserved. Bearing sparing logic integrated with RUL estimates.
Best fit
Mature reliability programs · moderate budget authority · sponsorship for digital transformation
Wk 1–3 Discovery & machine matrix
Wk 4–8 Deploy AI vibration layer
Wk 9–12 Mobile UX migration · cutover
Path C
Full AI-Native Modernization
10–14 weeks
Route-based periodic FFT analysis retired entirely. iFactory platform provides full AI-native continuous vibration monitoring with automated envelope spectrum analysis, fault classification, severity tracking, and RUL estimation across all rotating equipment classes.
Best fit
Large rotating equipment fleets (500+ machines) · siloed legacy systems · strategic platform consolidation goal
Wk 1–4 Full machine inventory & matrix
Wk 5–10 Parallel build + test
Wk 11–14 Cutover + legacy sunset
Frequently Asked Questions
Does AI vibration analysis replace our existing vibration software and certified analysts?
No. Your existing vibration software platform, route definitions, and certified analyst expertise continue providing their respective value. What changes is the data ingestion density and pattern recognition layer: continuous accelerometer data now feeds AI models that compute FFT and envelope spectra automatically, classify BPFO, BPFI, BSF, and FTF amplitudes, and estimate remaining useful life — augmenting analyst capacity rather than replacing it. The AI prediction layer sits on top of existing vibration data streams through standard API integration.
What fault types can AI vibration analysis actually detect and classify?
Production-grade AI vibration analysis covers the full spectrum of rotating equipment faults: rolling element bearing faults (inner race, outer race, rolling element, and cage via envelope spectrum analysis of BPFO, BPFI, BSF, and FTF frequencies), gear faults (tooth cracking, pitting, and wear via gear mesh frequency sideband analysis), rotor faults (imbalance, misalignment, and looseness via harmonic analysis of shaft speed orders), and electrical motor faults (rotor bar defects and air-gap eccentricity via motor current signature analysis). Each fault type is detected, classified, and severity-trended through standard progression stages independently, with remaining useful life estimated from degradation trajectory models.
Does deployment require new accelerometers on every machine?
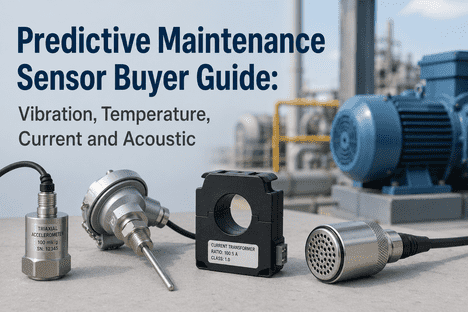
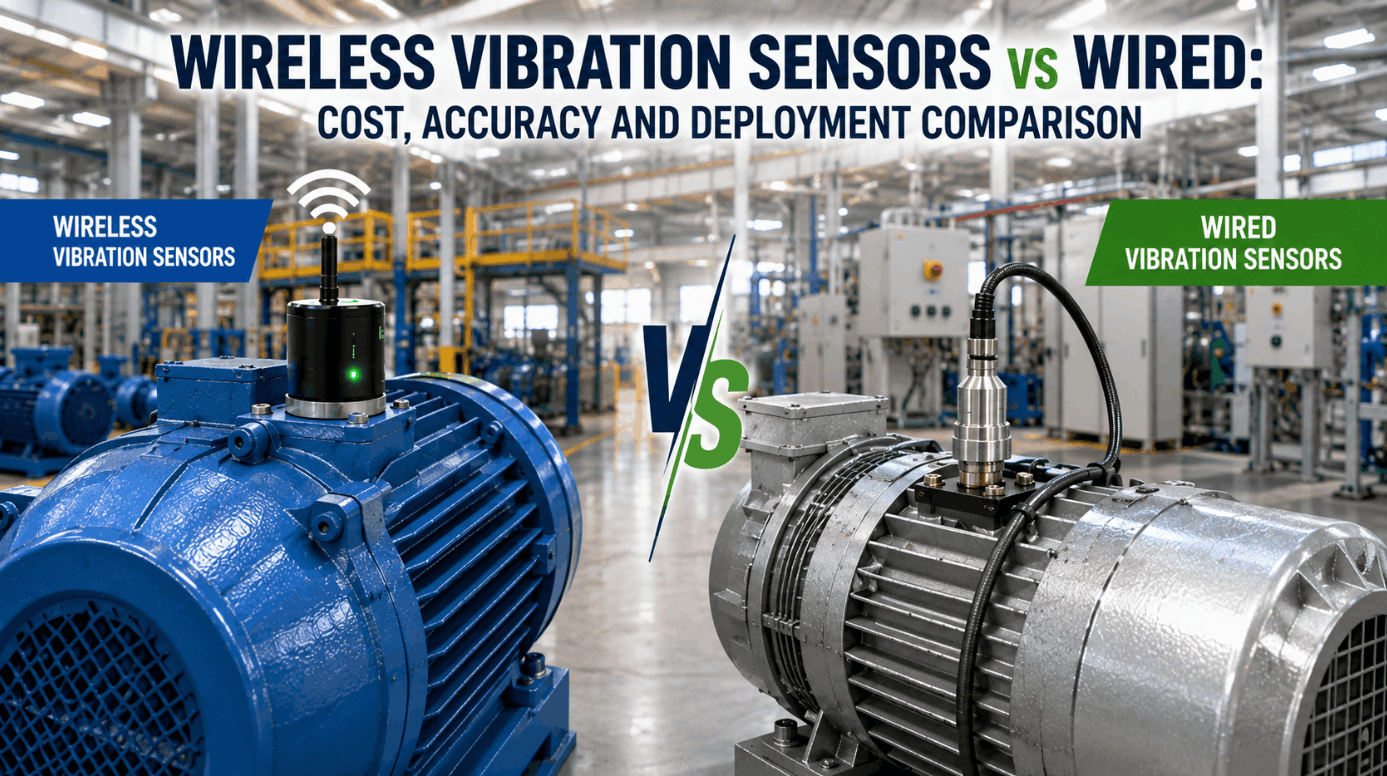
Not necessarily. Production-grade AI platforms integrate with existing accelerometers, vibration probes, and machine protection system data already installed on critical rotating equipment. iFactory's federation layer reuses your current investment in installed sensors, PLC data streams, and SCADA telemetry. For machines without existing accelerometers, wireless MEMS vibration sensor kits can be installed during a scheduled lubrication service. For slow-speed machinery below 300 RPM, additional signal processing techniques such as stress wave analysis or acoustic emission may be applied.
Which implementation path is right for our rotating equipment fleet?
Path A (Shadow Mode Augmentation) is the recommended starting point for plants where unplanned rotating equipment failure carries severe production or safety consequences. The AI platform runs alongside your existing vibration analysis for 4 weeks in shadow mode, generating fault classifications and RUL estimates logged for review but not triggering work orders. Your reliability team compares AI predictions against analyst findings and actual failure events before approving cutover — with full traceability and no disruption to existing workflows. After 6–12 months, most plants progress to Path B or C to capture additional efficiency benefits from automated work order creation and integrated sparing optimization.
How does remaining useful life estimation work in AI vibration analysis?
Each machine's envelope spectrum and FFT telemetry feeds into dedicated AI models trained on IEEE benchmark datasets including PRONOSTIA, IMS, and CWRU bearing run-to-failure tests. The models track fault frequency amplitude trajectories through the four standard severity stages — incipient, moderate, advanced, and pre-failure. Rotating equipment degradation follows an exponential progression after fault initiation; the RUL model fits an exponential curve to the amplitude trajectory and projects time-to-threshold with narrowing confidence intervals as the fault progresses. This approach achieves significantly better accuracy than generic L10 life curves that ignore actual degradation trajectory data.
Run the AI Vibration Analysis Workshop Built for Your Rotating Equipment Fleet
iFactory AI's vibration reliability practice runs a 90-minute workshop against your real machine classes, existing accelerometer coverage, and CMMS configuration. You leave with a defended deployment path, the fault classification matrix applied to your fleet, and a cost reduction projection grounded in your rotating equipment failure history.