The business case for predictive maintenance should not rest on industry averages. When a plant manager walks into a capital review, finance does not want to hear that McKinsey found 18–25% maintenance cost reductions across a broad industrial sample — they want to know what the ROI looks like for this facility, against this asset base, at this downtime cost per hour. That specificity is exactly what separates approved PdM programs from ones that stall in committee. Unplanned downtime costs industrial manufacturers an estimated $50 billion annually, with median per-incident costs exceeding $125,000 per hour across industries — and in automotive manufacturing, Siemens' 2024 analysis found lines where a single failure event costs over $2.3 million per hour. The ROI framework on this page gives U.S. plant engineers and operations leaders the variables, benchmarks, and calculation structure needed to build a defensible, facility-specific predictive maintenance business case — and shows exactly where iFactory AI's platform converts that analysis into realized savings.
Ready to Quantify Your PdM ROI? iFactory AI Builds the Business Case With You.
Connect your asset base, downtime history, and maintenance spend to iFactory's analytics platform — and see your facility-specific ROI projection before you submit a capital request.
What Unplanned Downtime Actually Costs: The Five Components Most Business Cases Miss
The most common error in predictive maintenance ROI analysis is understating the cost of a downtime event by limiting the calculation to direct repair labor and parts. That number — the maintenance invoice — typically represents 15–30% of the true fully loaded cost of a single unplanned failure. The remaining 70–85% sits in components that are either not tracked to the event or are absorbed into overhead budgets where they become invisible in month-end reporting. Building an accurate ROI model begins with correctly accounting for all five cost components.
The Four-Variable ROI Model: How to Calculate Predictive Maintenance Returns for Your Facility
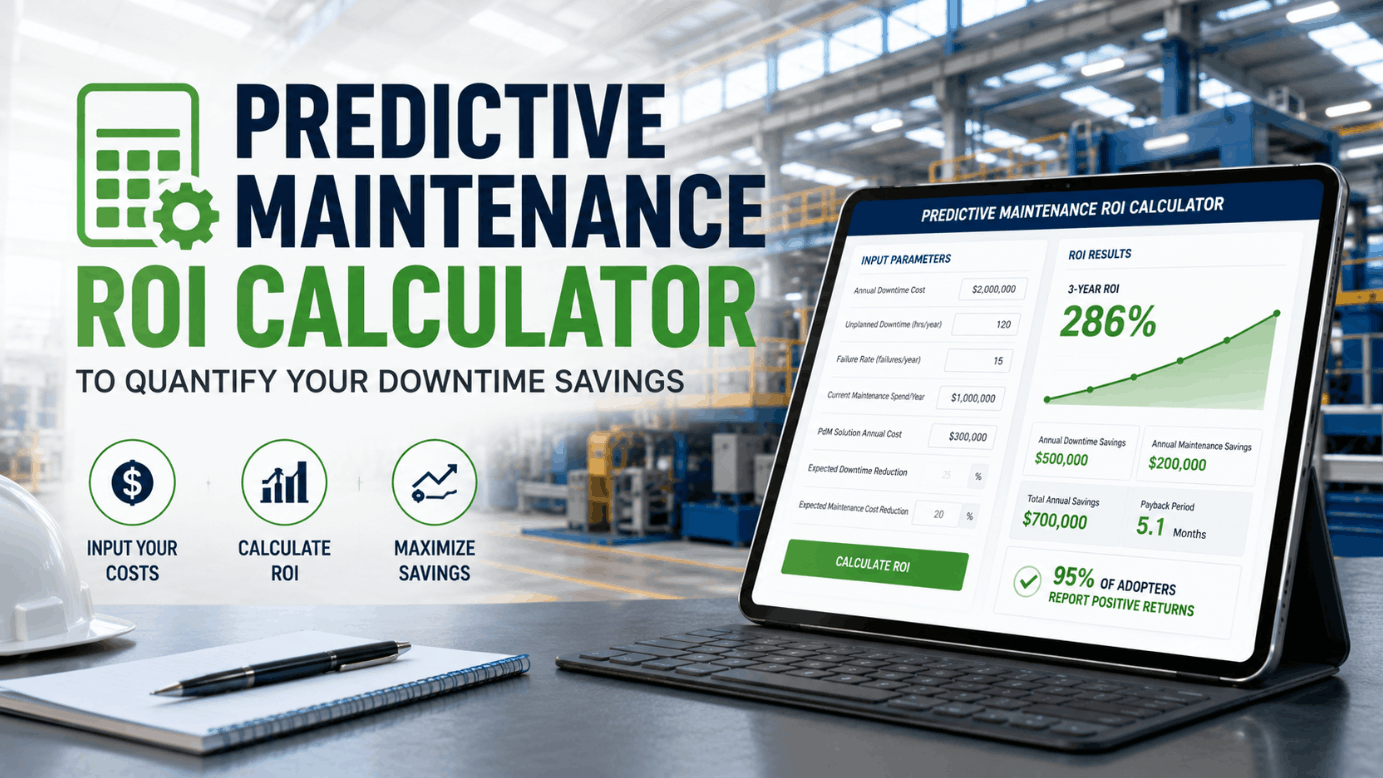
A facility-specific PdM ROI calculation requires four input variables, each of which can be estimated from 12–24 months of maintenance history with reasonable accuracy. The model below reflects the calculation structure used in capital justification submissions at U.S. manufacturing facilities that have booked a demo and proceeded to full deployment. Industry benchmarks from McKinsey, IoT Analytics, and Deloitte are provided for each variable as a calibration reference where facility history is incomplete.
Annual Unplanned Downtime Cost (Variable A)
Multiply your facility's fully loaded hourly output value by total unplanned downtime hours in the past 12 months, then apply the 1.4× multiplier that accounts for the non-production cost components (emergency labor, secondary damage, scrap, schedule recovery) typically excluded from event-level tracking. Industry median: $260,000 per downtime hour across manufacturing sectors.
Reactive Maintenance Cost Premium (Variable B)
Calculate total emergency repair spend over the past 12 months — labor at overtime and callout rates, expedited parts orders, and emergency contractor fees. Proactive repairs on the same asset cost 4–5× less than emergency repairs on average. Variable B captures the premium above planned maintenance cost that reactive programs pay every year.
Over-Maintenance Elimination Savings (Variable C)
Time-based preventive maintenance programs replace components on calendar schedules regardless of actual wear condition. Industry data consistently shows that 30–40% of PM work orders are performed on equipment with substantial remaining useful life. Variable C estimates the labor and parts cost that can be eliminated when condition-based maintenance replaces calendar-based replacement cycles.
Platform Investment (Variable D)
Total investment includes sensor hardware, connectivity infrastructure, platform licensing, implementation services, and internal labor for deployment and training. For a mid-size U.S. manufacturing facility with 100–200 monitored assets, the total first-year investment in a full iFactory AI deployment typically runs $85,000–$220,000, with annual platform cost declining significantly in years 2–5 as capital spend recedes.
Industry ROI Benchmarks: What Predictive Maintenance Delivers Across Manufacturing Sectors
The ROI range for predictive maintenance programs is wide — from modest 2:1 returns in mature PM programs with low baseline downtime to 30:1 returns in facilities transitioning from fully reactive maintenance with high-consequence asset failures. The table below documents the documented performance range across manufacturing sectors, calibrated against McKinsey, Deloitte, and IoT Analytics research, to provide context for facility-specific projections.
| Manufacturing Sector | Typical Downtime Cost/Hour | Downtime Reduction (PdM) | Maintenance Cost Reduction | Typical Payback Period | ROI Range (Year 1–2) |
|---|---|---|---|---|---|
| Automotive Assembly | $500K – $2.3M | 40 – 50% | 20 – 30% | 4 – 8 months | 15:1 – 30:1 |
| Steel / Metals | $180K – $500K | 35 – 50% | 18 – 25% | 8 – 14 months | 8:1 – 20:1 |
| Chemical Processing | $100K – $400K | 30 – 45% | 15 – 25% | 10 – 16 months | 6:1 – 15:1 |
| Food & Beverage | $50K – $250K | 30 – 40% | 15 – 22% | 10 – 18 months | 4:1 – 12:1 |
| General Discrete Mfg. | $25K – $150K | 25 – 40% | 12 – 20% | 12 – 20 months | 3:1 – 8:1 |
The single most impactful variable in ROI calculation is not the PdM platform cost — it is the facility's current baseline downtime frequency and per-event cost. Facilities with two to three major unplanned failures per year on high-consequence assets consistently achieve the highest ROI multiples because each prevented failure recovers the annual platform cost several times over. Book a Demo to map your asset failure history against the ROI model before building your capital submission.
How iFactory AI Converts ROI Analysis Into Realized Savings
ROI projections only become cash savings when the predictive maintenance program is operationally connected — sensors generating condition data, analytics producing actionable alerts, and maintenance teams responding with enough lead time to avoid the failure. iFactory AI's platform closes each link in that chain for U.S. manufacturing facilities across asset classes and industry sectors.
Asset-Specific Baseline Calibration
Every monitored asset receives an individual condition baseline derived from its actual operating history — eliminating the false alarm rates that undermine operator trust and cause maintenance teams to ignore alerts. iFactory's baseline engine recalibrates automatically as equipment ages and operating conditions change.
Consequence-Weighted Failure Prioritization
Not all equipment carries equal downtime risk. iFactory scores every condition deviation against the specific production and cost consequence of that asset's failure — so maintenance resources go to the asset where intervention delivers the highest prevented-cost value, not the asset with the loudest alarm.
Automated Work Order Generation
Condition threshold breach generates a prioritized work order with asset ID, failure risk context, recommended action, and completion window — delivered to the right maintenance role without requiring a human analyst to interpret raw sensor data. Planned interventions prevent emergency callouts and eliminate the 4–5× cost premium of reactive repair.
ROI Tracking Dashboard
iFactory's ROI module tracks prevented failures, avoided downtime hours, emergency work order reduction, and PM optimization savings against the platform investment in real time — producing the documented savings record that finance teams require for Year 2 budget justification and program expansion approvals.
Why Most PdM Business Cases Fail — and What the Ones That Get Approved Do Differently
I have reviewed dozens of predictive maintenance capital submissions at U.S. manufacturing facilities, and the ones that fail in committee share a consistent characteristic: they anchor on industry benchmarks instead of facility data. When a maintenance director presents a McKinsey statistic to a CFO, the CFO has no reason to believe that statistic applies to their plant, their asset base, or their maintenance history. The submissions that get approved do something different. They open with the fully loaded cost of the two or three most expensive unplanned failures from the past 18 months — numbers the CFO already knows are real because they showed up in the P&L. They calculate what a 40% reduction in those events recovers annually. They put that number against the platform investment and show the payback period in months, not years. The ROI argument stops being an industry case study and becomes a conversation about events the organization has already lived through. The other mistake I see consistently is understating avoided costs by counting only the maintenance invoice. The production loss, the schedule recovery overtime, the quality scrap during restart — those components are real and they are large, and leaving them out of the model makes the ROI look weaker than it actually is. Build the full incident cost, use your own numbers, and the case almost always makes itself.
Turning the ROI Framework Into an Approved Capital Investment
The data is unambiguous. Predictive maintenance delivers 18–25% maintenance cost reductions, 30–50% unplanned downtime reductions, and 10:1 to 30:1 ROI ratios in 12–18 months at facilities that deploy with operational discipline. Ninety-five percent of organizations that implement PdM report positive returns. The challenge is not whether the ROI exists — it is building the facility-specific business case that converts industry evidence into an approved capital budget line.
The framework on this page provides the structure: identify all five components of your fully loaded incident cost, apply conservative reduction rates from the four-variable model, and put the result against the platform investment to produce a payback period your finance team can evaluate. iFactory AI's analytics platform provides the operational layer that converts the projection into realized savings — with ROI tracking built in from day one so the business case you used to get approval is the same document you use to justify Year 2 expansion. Book a Demo with iFactory's reliability engineering team to run this framework against your facility's actual maintenance cost data.
Predictive Maintenance ROI — Common Questions
What ROI can a mid-size U.S. manufacturing facility realistically expect from predictive maintenance?
McKinsey data documents 10:1 to 30:1 ROI ratios within 12–18 months at facilities transitioning from reactive maintenance. A mid-size plant with 2–3 major failures per year and $125,000+ hourly downtime costs typically recovers full platform investment within 8–14 months.
How does iFactory AI calculate and track PdM ROI after deployment?
iFactory's ROI module tracks prevented failures, avoided downtime hours, emergency work order reduction, and PM optimization savings in real time against platform investment — producing the documented savings record finance teams require for Year 2 budget justification.
What is the typical payback period for a predictive maintenance platform deployment?
For high-downtime-cost sectors like automotive and steel, payback typically occurs in 4–14 months. IoT Analytics (2023) found 27% of PdM adopters achieve full payback within 12 months; 95% report positive ROI within the first two years of deployment.
Which assets should be prioritized first in a PdM deployment to maximize early ROI?
Start with assets where unplanned failure causes the highest production loss or safety risk — typically Tier 1 critical assets with no redundancy. Preventing one failure on a high-consequence asset often recovers the full platform investment in a single event.
How does predictive maintenance reduce maintenance costs beyond just preventing failures?
PdM eliminates the 4–5× emergency repair cost premium, reduces over-maintenance by deferring PM on assets with remaining useful life, and shifts 30–40% of reactive work orders to planned interventions — each of which compounds into sustained maintenance budget reduction year over year.
Build Your Facility-Specific PdM Business Case With iFactory AI
iFactory's reliability engineering team will run the four-variable ROI model against your actual maintenance cost history and show you the facility-specific payback period before you submit a capital request.