Most boiler "AI" projects die in the same place: the gap between the sensor in the firebox and the dashboard the plant manager actually looks at. A drum-pressure transmitter is reading at 4–20 mA. A PT100 RTD is bonded to the steam header. A flue-gas O2 cell is sitting on the stack. Each one is wired into a different PLC card, scanned at a different rate, named differently in the historian, and never quite reaches the model on time. The reason 70%+ of industrial AI pilots stall isn't the model — it's the signal chain. iFactory's Boiler Anomaly stack solves it by shipping the entire chain as one turnkey kit: industrial sensors mapped, PLC and SCADA tags read read-only over OPC-UA and Modbus TCP, the NVIDIA AGX Orin edge gateway buffering and aligning, the on-prem NVIDIA GB300 Grace Blackwell server running an LSTM-autoencoder anomaly model, anomaly scores rendered live on the dashboard, and a CMMS work order auto-drafted the moment a score crosses the alert band — engineer reviews, operator commits. Live in 6–12 weeks from PO, on your floor, on metal you own. Want to walk the rack and watch the signal chain end-to-end? Visit the iFactory booth at SAP Sapphire Orlando, May 11–13, 2026 — register here.
Boiler Anomaly End-To-End AI
From The Stack Sensor To The Engineer's Screen
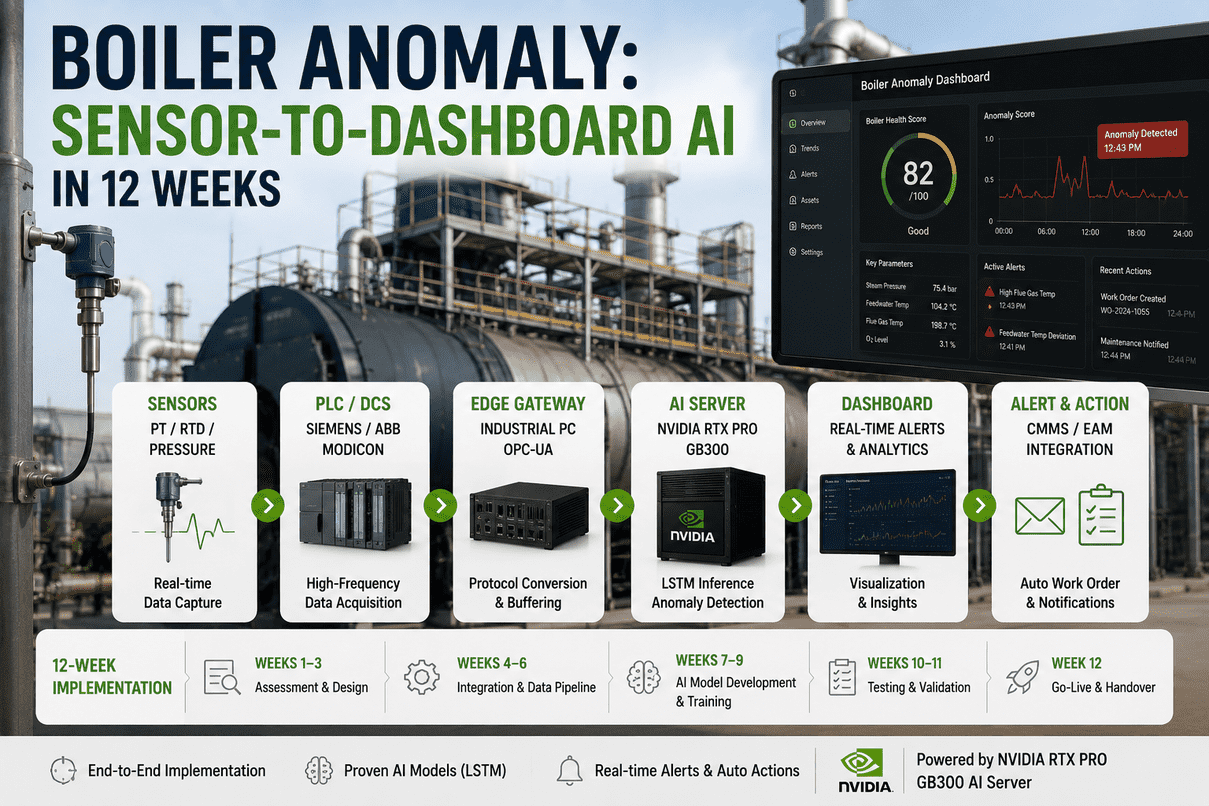
PT100 RTDs on the drum and superheater. Pressure transmitters on the feedwater header. Flue O2 and CO at the stack. Vibration probes on the FD/ID fans. Wired through the AGX Orin edge gateway over OPC-UA and Modbus TCP. Streamed at 1 Hz to the on-prem NVIDIA GB300 Grace Blackwell server running an LSTM autoencoder. Anomaly score on the dashboard within seconds. CMMS work order drafted automatically. Engineer reviews. Operator commits. The AI never writes to the BMS — by architecture.
A Boiler AI Project Isn't A Model — It's A Signal Chain That Has To Be Whole
Most pilots fail not because the LSTM is wrong, but because the data never arrives in the shape the model expects. A 1 Hz drum-pressure signal cannot be aligned with a 5-second SCADA poll. A flue-O2 cell on a different PLC subnet shows up with a 30-second drift. The AI looks bad; the data is bad. iFactory ships the whole chain: sensors, gateway, server, model, dashboard, CMMS hook — one PO, one timeline, one phone call when something breaks. Talk to our boiler AI lead about your existing instrumentation.
Different polling rates. Different timestamps. Different naming conventions. Six months of integration work before the first inference runs. By month nine, the pilot is shelved and "AI didn't work for our boilers" enters the post-mortem.
Industrial-grade sensors, AGX Orin edge gateway pre-configured for OPC-UA and Modbus TCP, GB300 on-prem server pre-loaded with the LSTM autoencoder, dashboard, CMMS auto-draft, all shipped racked and ready. Field engineers handle the cabling and PLC handshake. You get an anomaly score on the screen, not a research project.
An AI that writes a setpoint into the burner management system without a human gate is not an anomaly engine — it's an unvalidated controller. The Boiler Anomaly stack has no write path to the BMS. It scores. It alerts. It drafts the work order. The engineer reviews. The operator commits.
Six Stages, Six Boxes, One Continuous Path From Firebox To Dashboard
Below is the full chain — sensor at one end, engineer's screen at the other. Each stage runs on a specific piece of hardware, has a defined latency budget, and produces a clearly named output that the next stage consumes. If you want a non-technical summary: data leaves the boiler as analog or digital signal, gets cleaned and aligned at the edge, runs through a model on the on-prem AI server, comes back as an anomaly score, lights up the dashboard, and triggers a draft work order. Six steps. Nothing magical.
PT100 / Pt1000 RTDs on drum, superheater, economiser. Pressure transmitters on feedwater and steam header. Flue-gas O2 zirconia cell and CO ppm at the stack. Vibration accelerometers on FD/ID fans. Water-chemistry probes for conductivity and pH. Most plants already have 70–90% of these — we tap them read-only.
Head-mount transmitters convert PT100 resistance to Modbus RTU or 4–20 mA. PLC analog input cards (Allen-Bradley, Siemens, Honeywell) digitise pressures and flows. Existing panel — no rip-and-replace. We map the tags, validate the engineering units, and confirm the scan rate is fast enough for the model.
Read-only OPC-UA and Modbus TCP client. Pulls every tag at 1 Hz. Time-aligns against a single GPS-synced clock. Buffers locally on a 7-day ring so a network blip never loses a sample. Forwards to the historian and to the GB300 inference server. Sits on a separate VLAN from the control LAN.
NVIDIA GB300 Grace Blackwell Ultra server runs an LSTM autoencoder per boiler. The model is trained on 60–90 days of your normal operating data, so "normal" is your boiler at your loads with your fuel — not a generic benchmark. Anomaly score 0–100 from reconstruction error. Above 75, alert. SHAP attributions identify which sensor drove it.
Anomaly score rendered live next to the boiler on the iFactory dashboard. Drill-down shows the sensor curves, the SHAP driver, the projected failure mode (bearing fault, cavitation, tube fouling, refractory damage), and the recommended next action. Plant manager sees it on a wall display. Engineer sees it on a laptop. Operator sees it on the DCS HMI overlay.
Anomaly above threshold drafts a work order in your CMMS — OxMaint, SAP PM, IBM Maximo, Infor EAM — pre-filled with the asset, the suspected failure mode, the SHAP-identified sensor, the recommended inspection, and the time-to-failure estimate. Maintenance lead reviews. Releases or edits. The AI never auto-releases.
Three Boxes On Your Floor — Nothing In The Cloud, Nothing You Don't Own
Combustion data is regulated, sensitive, and operationally critical. It does not leave your perimeter. The full inference stack runs on metal in your rack — pre-configured, burn-in tested, IEC 62443 zoned, air-gapped from public internet by default. Below is exactly what arrives on your dock. Walk it live at the iFactory booth in Orlando.
Why this stack and not a cloud-only product: regulated combustion data, real-time alerting that survives an internet outage, model retraining on your data without sharing weights with any other site, and a clean ownership story — you bought it, you own it, no recurring license. The on-prem stack is also how we keep the deployment in a 6 to 12 week window. See the full rack at SAP Sapphire Orlando.
What The Boiler Anomaly Stack Actually Catches — Five Real Failure Modes
Boilers don't fail in one way. They fail in patterns — each pattern showing up days before the trip in a specific subset of sensors. The LSTM autoencoder is good at exactly this: learning the joint behaviour of dozens of sensors and noticing when their relationship to each other drifts, even if no single signal has crossed an alarm limit. Below are five common failure modes, the sensors that catch them, the recommended action, and what a non-AI shop would have missed.
Stack temperature climbs slowly while load is flat. Steam output per kg of fuel drops. Drum-pressure response to firing changes gets sluggish. None of these crosses an alarm individually — together they're a fingerprint.
Anomaly score rises gradually over 7 to 14 days. SHAP identifies stack-temp-drift as top driver. Projected failure mode: waterside scale build-up. Recommended action: schedule chemical clean within next maintenance window.
Operator notices stack temp creeping up only after a permit-band breach. By then, the cleaning is reactive, the unit is offline, and dry-gas loss has cost six figures.
Vibration on drive-end bearing rises from 0.8 mm/s to 1.4 mm/s. Bearing temperature drifts up 6°C above the load-adjusted baseline. Motor current pattern changes shape on each pump cycle. Discharge pressure stable.
Anomaly score 82 with a rising 7-day trend. SHAP names the DE-bearing temperature and vibration as joint top drivers. Projected mode: outer-race bearing defect. Estimated time-to-failure: 18 to 28 days. CMMS work order drafted with recommended bearing change at next planned outage.
Vibration trip fires unexpectedly on a Sunday night. Pump 2A swap is emergency, contractor is overtime, lost steam costs a downstream batch.
Flue O2 stable at 3.1%, CO ppm stable at 35 ppm, but the relationship between them at a given load is shifting. Burner tile is wearing; the flame envelope is changing without anyone noticing.
Anomaly score climbs into the 70s on combustion-only signals. SHAP isolates the O2-CO joint distribution as the driver. Recommended action: flag for combustion engineer review at next tune-up; consider burner-tile inspection.
The drift is invisible to single-point alarms. Efficiency degrades 0.4 to 0.8% over a quarter — six figures of fuel walking up the stack quietly.
Skin-temperature thermocouples on the boiler casing show localised hot-spot growth. Heat loss inferred from the energy balance drifts. Efficiency at constant load and ambient drops.
Multivariate anomaly score isolates the affected zone. Projected mode: refractory cracking or insulation slumping behind that panel. Work order drafted for borescope inspection at next short outage; severity scaled to size of hot spot.
Thermal imaging sweep happens annually; degradation between sweeps is invisible. By the time a hot spot is found, casing repair is a week-long planned outage instead of a half-shift fix.
Conductivity in the drum rises slightly. pH drifts toward the lower edge of the band. Dissolved-oxygen probe at the deaerator outlet trends up. Blowdown pattern looks normal — single signals look normal — relationships do not.
Anomaly score on the chemistry-only model. Projected mode: condensate contamination or DA failure. Recommended action: hold blowdown rate, sample drum chemistry manually, inspect DA vent. Tube-corrosion risk flagged in the maintenance log.
Tube failure six months downstream from the excursion. Root-cause analysis identifies the chemistry event, but only retrospectively. Recurring exposure not eliminated.
The five above are common. The model is trained on your boiler — your loads, your fuel, your ambient — so the patterns it learns are yours. Bring your tag list and a representative load profile to the Orlando booth and our team will walk you through what the model would surface.
Walk Through Your Boiler at OrlandoSame System, Two Levels Of Detail — Plant Manager & Combustion Engineer
A non-technical reader and a combustion engineer have to take the same screen and act on it differently. The plant manager wants to know: is this boiler okay, and if not, what is the financial exposure? The combustion engineer wants to know: which sensor moved, why, and what does the model think the failure mode is? The dashboard answers both views from the same data.
From PO To Live Anomaly Score In Three Phases
A boiler is not a greenfield. It has a BMS, a CEMS, a permit, an operations procedure, and a maintenance team that has heard a lot of vendor promises. Deployment is staged so each phase produces a working artefact, not just a milestone. Live in 6 to 12 weeks from PO. Global shipping on the GB300 and AGX Orin nodes; field engineers dispatched for cabling, PLC handshake, and operator training.
GB300 server and AGX Orin gateway ship pre-configured. Field engineer racks them, plugs power and Ethernet, configures the OPC-UA / Modbus TCP bridge to your PLC. Any missing sensors installed and wired during a planned shutdown window. 90 days of historical operating data pulled.
Model trained on your boiler's normal envelope, per fuel and load band. Anomaly scores run in shadow mode — visible to combustion engineer, not surfaced to operator. Failure-mode signatures characterised against your historical events. Alert thresholds set with maintenance lead.
Anomaly scores promoted from shadow to alert queue. CMMS work-order auto-draft enabled. 3-day on-site training for combustion engineers, DCS operators, and maintenance leads. 24x7 remote monitoring active. Rollout to additional boilers on a schedule operations controls.
Model retrained monthly on fresh operating data. Quarterly review with our boiler AI lead — accepted alert rate, prevented failures, model drift, sensor health. Optional after year one. Stack keeps running either way; you own it.
Hardware, Sensors, Software, Integration, Training — One PO
The Boiler Anomaly stack is delivered as one turnkey kit: GB300 inference server, AGX Orin edge gateway, sensor and transmitter set, model scaffolding, dashboard, CMMS hook, and our boiler AI engineers on the floor for sensor wiring, PLC handshake, model training, and operator training. 6 to 12 weeks from PO. Owned by you outright. No recurring license.
Pre-racked, burn-in tested, IEC 62443 zoned. GB300 runs the LSTM autoencoder and the iFactory dashboard; AGX Orin handles deterministic tag ingest. Air-gapped from public internet. One-time CapEx. Global shipping included.
PT100 / Pt1000 RTDs, pressure transmitters, vibration accelerometers, water-chemistry probes, head-mount Modbus transmitters — supplied to fill gaps in your existing instrumentation. Cabled and commissioned by our field engineers.
Read-only OPC-UA / Modbus TCP / EtherNet-IP connectors to Allen-Bradley, Siemens, Honeywell, Yokogawa, Emerson. Historian write to OSIsoft PI, Aveva, Ignition. CEMS data tie-in. Cabling and config handled on-site.
LSTM autoencoder, Isolation Forest companion model, SHAP explainer, anomaly-score dashboard, drill-down view, e-mail / SMS / Teams alert hooks, audit-log writer. Calibrated to your boilers during weeks 1–8.
Pre-built integration to OxMaint, SAP PM, IBM Maximo, Infor EAM. Drafts a work order on each high-anomaly alert with asset, suspected mode, time-to-failure, recommended inspection. Maintenance lead reviews and releases. AI never auto-releases.
3-day on-site training for engineers, operators, maintenance leads. 24x7 remote monitoring of all stack nodes. Monthly model retrain. Quarterly performance review with our boiler AI lead. Optional after year one.
What Plant Managers & Combustion Engineers Ask First
No, by architecture. The Boiler Anomaly stack reads tags read-only over OPC-UA and Modbus TCP. There is no write path to the BMS, burner controller, or any safety logic. Anomaly scores are surfaced to engineers and operators. Work orders are drafted in your CMMS. The maintenance lead reviews and releases. Operator commits any setpoint change manually following your existing MOC. The AI is an alert engine, not a controller.
No. Most plants already have 70 to 90% of the instrumentation we need — drum pressure, steam pressure, feedwater flow, flue O2, stack temp. We tap those tags read-only via OPC-UA. We supply only the sensors that are missing. Existing PLC stays exactly as it is — no rip-and-replace, no re-engineering, no MOC on the control logic.
Rule-based alarms catch single-point excursions — pressure too high, temperature too low. They cannot catch the joint-distribution drift that precedes most boiler failures, where every sensor is inside its limit but the relationship between them has shifted. The LSTM autoencoder learns the joint normal envelope from your operating history and flags reconstruction errors. Peer-reviewed studies report detection accuracy around 97% with significantly fewer false positives than rule-based systems on the same data.
Stays inside your perimeter. The full stack — GB300 server, AGX Orin gateway, dashboard — runs on-site, air-gapped from the public internet by default. The model trains and infers on the appliance you own. No data leaves your zone. Your model is trained on your data only — we don't share weights between customers.
Phase 1 takes 4 weeks (sensors, gateway, server, ingest). Phase 2 takes another 4 weeks (training, shadow mode). Phase 3, weeks 9–12, is when alerts go live for the operations team. Most customers see their first non-trivial early-warning alert within 30 days of go-live, when an emerging fault that pre-dates training shows up in the anomaly score.
Yes. Pre-built connectors for OxMaint, SAP PM, IBM Maximo, Infor EAM. The auto-draft writes asset ID, suspected failure mode, sensor evidence, and recommended action into your existing work-order schema. Your maintenance lead reviews and releases inside your existing CMMS workflow — no parallel tool, no duplicate process.
Walk The Full Signal Chain Live At Orlando — Sensor To Score In Under A Second
The PT100 probe wired into a real boiler skid. The AGX Orin gateway pulling tags over OPC-UA. The GB300 Grace Blackwell server running the LSTM model on stage. The dashboard with a real anomaly alert lighting up. Bring your boiler tag list and load profile; our boiler AI lead will walk through what the model would surface for your operation. If you can't make Orlando, schedule a remote walk-through with the same stack.