The shift supervisor on the rolling mill morning shift has six dashboards open: the MES OEE board, the SCADA HMI, the historian trend client, the quality lab report, the maintenance work order list, and the daily production tracker exported into Excel. To answer the question her boss just asked over WhatsApp — "why was plate bay output 18% under target last shift?" — she has to triangulate across all six. Twenty minutes later she has a hypothesis (a quality reject burst on coil 4477 plus a 22-minute crane wait on bay 2C) but cannot prove it without pulling another dashboard. By that point her boss has stopped waiting and the next shift's standup is starting. Multiply this by every shift, every line, every plant in the company. Most factories already have all the data they need — they just don't have a way to ask the question. Natural Language OEE Query is the AI layer that closes the gap. The supervisor types or speaks the question in plain English (or Hindi, or any plant working language) into a single copilot panel; the copilot classifies the intent, decomposes the answer into Availability × Performance × Quality, attributes the loss to the correct shift, line, or asset, surfaces the most likely root cause from the historian and maintenance data, and suggests the action. Twenty minutes of dashboard digging collapses into 8 seconds of conversation. The lab still owns the certified quality numbers; the MES still owns the timestamps; the maintenance system still owns the work orders. The copilot does not replace any of those. It just lets the supervisor finally ask them all at once. Runs on the iFactory turnkey on-prem AI server stack — RTX PRO 6000 Blackwell Workstation in the control room for single-plant, NVIDIA DGX Station GB300 Ultra Desktop Superchip for corporate fleet rollout. Six-week deployment from PO to live copilot on the floor. Come see us live at SAP Sapphire Orlando, May 11–13 — interact with the copilot hands-on, type your own questions into the panel, watch the answers render against a representative plant model. Register for the booth here.
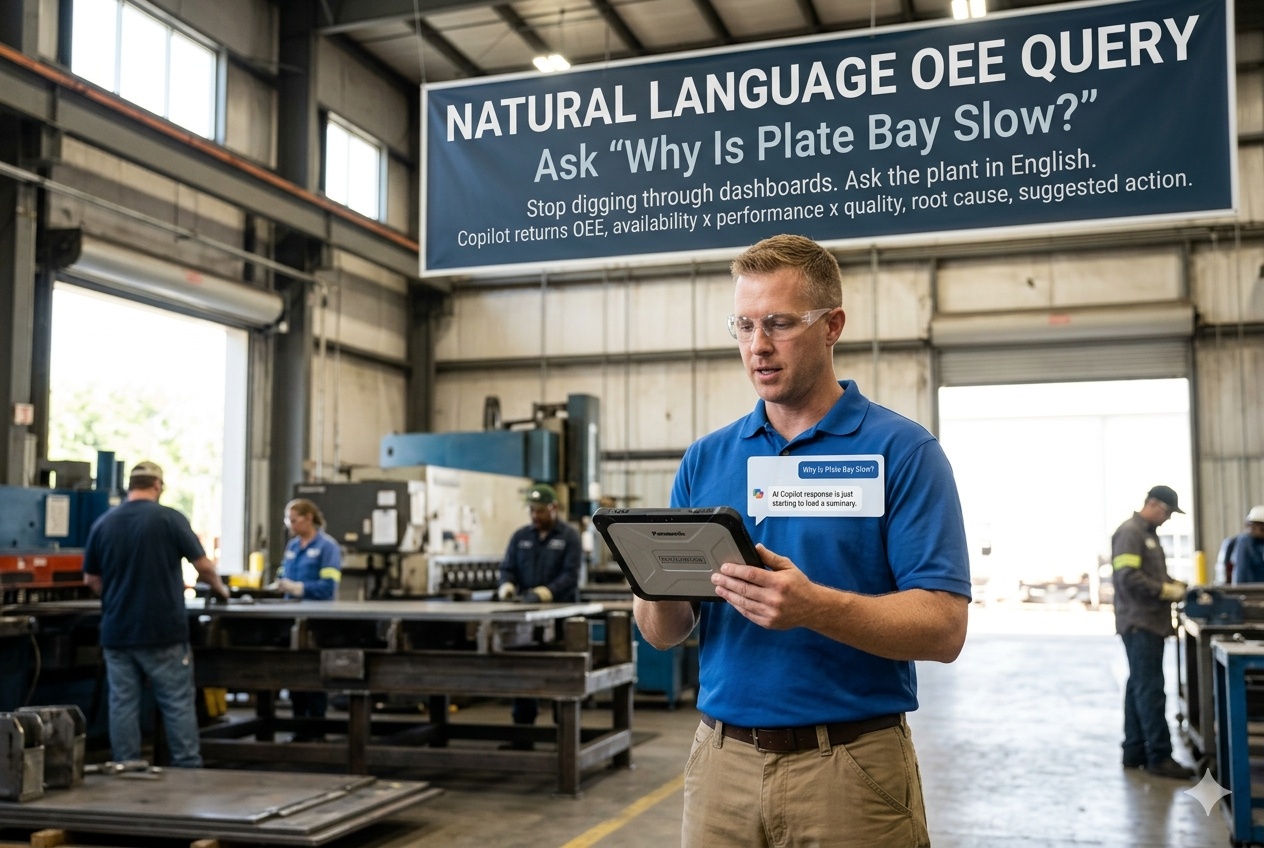
Stop Digging Through Six Dashboards. Ask The Plant.
"Why Is Plate Bay Slow?" — The Copilot Answers In 8 Seconds.
Type or speak the question in plain English. The copilot classifies the intent, decomposes Availability × Performance × Quality, attributes the loss to the right shift / line / asset, surfaces the most likely root cause from your historian and maintenance data, and suggests the next action. Six-week deployment. Runs on the on-prem AI server stack you own outright. Come see us live in Orlando — type your own questions into the copilot, hands-on at the booth.
Six Dashboards, One Question, Twenty Minutes — Every Shift, Every Plant
The published OEE benchmark data is unambiguous: most discrete manufacturing plants operate between 40% and 65% OEE; world-class is 85%. The 20-to-45-percentage-point gap is mostly availability and performance losses that the dashboards can show — but only if a person spends the twenty minutes to dig through them. Most days, on most lines, that twenty minutes happens once instead of every shift. The copilot is not a new dashboard; it is the conversational layer that lets the same data finally answer the question the supervisor was always trying to ask. Talk to our deployment lead about the dashboards your supervisors have open today.
Supervisor opens MES OEE board, SCADA HMI, historian trend, quality lab report, maintenance work order list, daily Excel tracker. Triangulates manually. Finds half the answer. Boss has moved on. Next shift starts. The data was always there; the path through it was the bottleneck.
Supervisor types "why was plate bay output 18% under target last shift". Copilot returns: Availability 78% (target 90%), Performance 88% (target 95%), Quality 96% (target 99.9%); dominant loss = 22-min crane wait on bay 2C plus quality reject burst on coil 4477; suggested action = expedite the work order on crane 2C hoist, route lab feedback to caster.
A copilot that closes maintenance tickets, releases held lots, or adjusts production targets without human review is not a copilot — it is an unvalidated controller. The Natural Language OEE Copilot has no write path to the MES, DCS, or quality release. Recommendations only. Supervisor commits on the existing system under existing authority.
What The Supervisor Actually Types — And What The Copilot Returns
A walk-through of six representative queries from a typical morning shift on a steel plate mill. Numbers are illustrative. The pattern is what matters: the supervisor asks in the language she would use over WhatsApp, the copilot returns the structured decomposition with the root-cause hint and the suggested action, and the conversation can continue as a follow-up. Different plants ask different questions; the same intent classifier handles all of them.
What you noticed in the conversation: the copilot is not just answering each question in isolation. By query 4, it is using context from query 1. By query 6, it is comparing patterns across shifts and connecting them to walk-around log entries it never saw before this session. That is the difference between a chat-based dashboard reader and a real copilot — conversation memory plus access to the full operational corpus, not just the OEE board.
A × P × Q — Three Numbers, Six Big Losses, One Multiplied Score
Every answer the copilot returns shows the OEE decomposition because that is what makes the answer auditable. Availability times Performance times Quality is the formula Seiichi Nakajima published as part of Total Productive Maintenance — world-class plants run at 85% OEE, most plants run at 40% to 65%. The gap lives in one or two of the three factors; the copilot's job is to surface which one and why. Below is what each factor means and what loss types live inside it.
- Planned downtime (changeover, maintenance windows)
- Unplanned downtime (breakdown, material starvation, operator availability)
- Setup and adjustment time
- Small stops (less than 5 min — jams, sensor trips, micro-adjustments)
- Slow cycles (running below ideal cycle time — wear, settings, material variation)
- Reduced speed running (operator throttling, tool conditioning)
- Production rejects (scrap and rework during stable production)
- Startup rejects (parts produced during ramp-up not meeting spec)
- Held lots awaiting disposition
Why showing the decomposition matters: "OEE was 66% last shift" is not actionable. "Availability was 78% because of a 22-minute crane wait on bay 2C" is. The copilot always returns the three component scores alongside the headline OEE so the supervisor knows which lever to pull.
Intent Classifier · OEE Decomposition · Attribution · Action Hint
The copilot's pipeline is built around the published LLM + RAG architecture pattern for manufacturing copilots, applied specifically to OEE inference. Five stages, each with a specific job. The whole pipeline runs on the on-prem RTX PRO 6000 Blackwell server — sub-second from question typed to answer streaming.
Fine-tuned classifier on top of the on-prem LLM. Maps the natural-language question to one of roughly 40 intent categories: oee_root_cause, availability_breakdown, performance_loss_attribution, quality_top_n, asset_history, shift_comparison, production_pace_projection, downtime_explainer, and so on. Multilingual — English, Hindi, Spanish, Mandarin, Portuguese, Tamil, Bahasa, German.
For the time window the question implied (last shift, last 24h, week-to-date, MTD), the copilot pulls the relevant historian and MES data, computes Availability, Performance, and Quality, and identifies which of the three is the dominant gap against world-class or your plant's targets. This is the structured number that anchors every answer.
Once the dominant factor is identified, attribution splits the loss across shifts, lines, assets, products, and time slices. SHAP-style feature attribution on the structured time-series; for the "why" questions, the LLM augments the structured attribution with the maintenance log entries, walk-around notes, and quality-team notes from the same window.
RAG-grounded against your CMMS work order history, walk-around logs, quality lab notes, and historical incident reports for similar patterns. Returns the most likely root cause with a confidence score and a citation pointer back to the source records the supervisor can open if she wants to verify. Multiple causes ranked when the data does not support a single dominant explanation.
Suggested action grounded against your standard operating procedures and your existing maintenance and quality workflows. Not a write — the supervisor commits the action on the existing system (CMMS work order, MES adjustment, shift handover note) under her own authority. The copilot proposes; the supervisor disposes.
Sources Already Sitting In Your Plant — Nothing New To Install
The copilot does not require a new data layer. It connects through standard read-only integrations to the systems your plant already runs — the same systems the supervisor has open across her six dashboards today. The integrations are part of the six-week deployment; iFactory's enterprise team owns them.
Production schedules, batch records, OEE timestamps, shift assignments, product hierarchy.
Time-series sensor data, run states, downtime reasons, cycle times, throughput counters — the structured layer the OEE decomposition computes against.
Lab samples, certified results, hold and release decisions, deviation records, CAPA history.
Work orders, asset history, planned maintenance schedules, spare parts movements, technician notes.
The corpus the LLM grounds against for root-cause inference. Indexed once during deployment, refreshed continuously.
Used for shift comparison queries and skills-gap inference where applicable.
Read-only by default. The copilot pulls data from these systems — it does not write back to them. Any action the copilot recommends gets committed by the supervisor on the originating system under her existing authority. No data leaves your perimeter; the corpus indexes and the model both live on the on-prem appliance.
PO Today · Live Copilot On The Floor In Six Weeks
The Natural Language OEE Copilot is the iFactory deployment with the fastest path to live. No new instrumentation. No data lake to build. The connectors to MES, historian, LIMS, and CMMS are already developed and run on the on-prem appliance from day one. The six-week schedule below is what your plant lead should expect — and what we Gantt at PO.
RTX PRO 6000 Blackwell Workstation arrives at your control room. iFactory field engineer racks, connects to your network, begins read-only connectors to MES, historian, LIMS, CMMS. Site survey for any non-standard data sources.
Historical OEE data, work orders, walk-around logs, SOPs, shift handover notes, incident reports indexed onto the appliance. Typically 6 to 18 months of history depending on what your systems retain. Quality validation against your existing OEE board.
Intent classifier fine-tuned on your plant's terminology — line names, asset names, product codes, shift labels, local language patterns. The "plate bay 2C" your supervisor types should resolve to the same line the historian calls "PB-2C-MAIN". This week is where the calibration happens.
Copilot answers questions in shadow mode. Two or three supervisors from your shift roster ask their actual end-of-shift questions; the answers are reviewed against the answers they would have given themselves. Disagreements logged as training data for week 5.
Disagreement patterns from week 4 used to refine the intent classifier and the attribution logic. End-to-end integration tested against your existing CMMS, MES, and quality systems. Operator card UI styling matched to your existing dashboard standards.
Copilot goes live across all shifts on the pilot line. Three days of on-site iFactory support — supervisor training, walk-around with each shift, last-mile fixes. By Friday of week 6, your plant is asking the copilot questions instead of digging through dashboards. Six weeks. PO to live.
RTX PRO 6000 Blackwell Workstation — The Box That Runs The Copilot
For a single-plant deployment, the workstation below is the standard. It sits in your control room, runs every iFactory AI you turn on (the copilot, the digital twin, the predictive maintenance models), and is owned outright by you. For corporate fleet rollouts where one node serves multiple plants, the NVIDIA DGX Station GB300 Ultra Desktop Superchip tier is the right answer — up to 1 trillion parameters of local inference, $85K to $100K, more capacity than your fleet will use in five years.
What this gives the plant: 96 GB of GPU memory is enough to run the copilot's intent classifier plus a 70B-parameter LLM plus the digital twin plus the OEE inference pipeline simultaneously. 24,064 CUDA cores keep the response time under 10 seconds even under multi-supervisor concurrent load. FP4 support means the LLM runs efficiently at production throughput. Sits next to the DCS rack; air-gapped by default; you own the box and the trained models.
Imagine a sleek workstation about the size of a desktop briefcase sitting at corporate. NVIDIA's DGX Station with the GB300 Grace Blackwell Ultra Desktop Superchip — 768 GB unified coherent memory, 20 petaFLOPS of AI compute, dual 400 GbE LAN. NVIDIA states the platform supports models up to 1 trillion parameters running locally without cloud infrastructure. For a multi-plant company, this is the box at headquarters that runs every plant's copilot, every plant's digital twin, the cross-plant fleet analytics, and the corporate operator copilot — all simultaneously. Roughly $85K to $100K outright, or rented through our cloud / OXMaint Server Farm. Most customers start with the RTX PRO 6000 Workstation per plant and add the DGX Station GB300 Ultra at corporate when they're ready to roll out across the fleet.
Come see us live in Orlando — interact with both servers hands-on. Touch the RTX PRO 6000 Blackwell Workstation. Touch the NVIDIA DGX Station GB300 Ultra Desktop Superchip. Type your own questions into the copilot running on a representative plate-mill model. Watch the answer render against the OEE decomposition you would actually see on your floor. Register for the booth — SAP Sapphire Orlando, May 11–13.
What Shift Supervisors & Plant Managers Ask First
Yes. English by default; Hindi, Spanish, Mandarin, Portuguese, Tamil, Bahasa, German, French, Japanese, Korean, Vietnamese supported out of the box. Other languages added during Phase 1 calibration on request — the underlying LLM handles them; the intent classifier fine-tunes on your plant's terminology in the chosen language. Multilingual queries within the same conversation are supported.
No, by architecture. All connectors are read-only. The copilot recommends actions; the supervisor commits them on the originating system. Work orders go into your CMMS as drafts only when the supervisor explicitly asks the copilot to draft one — and even then, the draft requires supervisor sign-off in the CMMS before it becomes active. There is no autonomous write path in the tool surface.
Two layers of accuracy. The OEE decomposition (A × P × Q numbers) is computed from your historian and MES data — if the underlying data is correct, the decomposition is correct. The root-cause hint is a probabilistic inference and is presented with a confidence score and citation pointers back to the source records. Below 70% confidence the copilot says so explicitly. Supervisors learn quickly which questions return high-confidence answers and which need a manual review.
No. The copilot runs entirely on-prem on the RTX PRO 6000 Blackwell Workstation (or DGX Station GB300 Ultra at corporate). Air-gapped from public internet by default. The LLM weights are on the appliance; the corpus indexes are on the appliance; the audit trail is on the appliance. We do not stream prompts to a cloud LLM. We do not collect telemetry. Your plant data and your operating recipes stay on the box you own.
That is the entire purpose of the citation pointers and the confidence scores. Every answer surfaces the source records (work orders, historian trends, lab samples, walk-around logs) the copilot used — one click opens the underlying record so the supervisor can verify. Most supervisors start sceptical and use the citations heavily for the first two weeks; by week three they trust the answers but keep the citations as audit material.
For the standard deployment (one plant, standard MES / historian / CMMS / LIMS, no exotic data sources), yes. The connectors are pre-built; the only plant-specific work is the intent-classifier fine-tuning on your terminology and the corpus indexing of your historical records. Plants with non-standard or heavily customised systems can extend by 2 to 4 weeks — we Gantt the schedule at PO and tell you up front if your environment will push past six weeks.
For one plant or single-site fleet, the RTX PRO 6000 Blackwell Workstation is the right answer. For corporate-fleet rollouts where one node at headquarters serves multiple plants and runs cross-plant analytics, the NVIDIA DGX Station GB300 Ultra is the right answer — its trillion-parameter capacity covers fleet-wide copilots plus enterprise LLM plus cross-plant digital twins on a single node. Most customers start on the per-plant tier and add the corporate tier when ready to scale.
The copilot keeps running. You own the appliance, the trained intent classifier, the indexed corpus, the audit logs. Renew support and quarterly retraining annually, run it in-house with our handover docs, or do a mix. No kill switch. The intent classifier gets sharper with continued retraining as your terminology and product mix evolve; if you stop, it freezes at the last-trained state and continues running.
Come See Us Live In Orlando — Type Your Own Questions Into The Copilot
Two ways forward. First · come see us live at SAP Sapphire Orlando, May 11–13. Walk the iFactory booth and interact with the on-prem AI server stack hands-on — touch the RTX PRO 6000 Blackwell Workstation, touch the NVIDIA DGX Station GB300 Ultra Desktop Superchip, type your own questions into the copilot running on a representative plate-mill model, watch the OEE decomposition and the root-cause hint render in real time on the screen in front of you. Bring scenarios from your floor and our plant lead will run them through the copilot at the booth. Second: a 30-minute working session with our deployment lead — bring 90 days of your plant's OEE history, a typical week of walk-around logs, and a list of the questions your supervisors actually ask. We'll project what the six-week deployment looks like for your environment.