For digital transformation leaders accountable for the OEE technology stack across a food & beverage portfolio, the gap between what SAP MII / xMII delivers and what the business actually needs has become structurally indefensible. SAP-based OEE is descriptive — it tells you availability, performance, and quality after the shift has ended, after the loss has happened, after the recovery would have been possible. F&B production runs on changeovers, sanitation cycles, sequence-dependent quality risk, and tight customer commitments that demand the ability to predict OEE impact hours ahead, not report it the next morning. The mandate facing the DT leader is no longer whether to modernize OEE off SAP MII, but how to do so in a way that delivers genuinely predictive OEE — not just a faster dashboard of the same lagging numbers, and with the uptime and data sovereignty that an F&B operation requires. iFactory AI is the AI-native predictive OEE platform purpose-built for this transition: a pre-configured NVIDIA appliance running F&B-specific predictive OEE models on-premise, replacing SAP MII / xMII / DMC and the SAP PCo (Plant Connectivity) middleware, with 99.9% appliance uptime and 6–12 week deployment. This page is the F&B digital transformation leader's guide to migrating from SAP MII OEE to iFactory Predictive OEE — the architecture, the capability difference, the F&B-specific loss patterns it addresses, and how the workload modernization actually works.
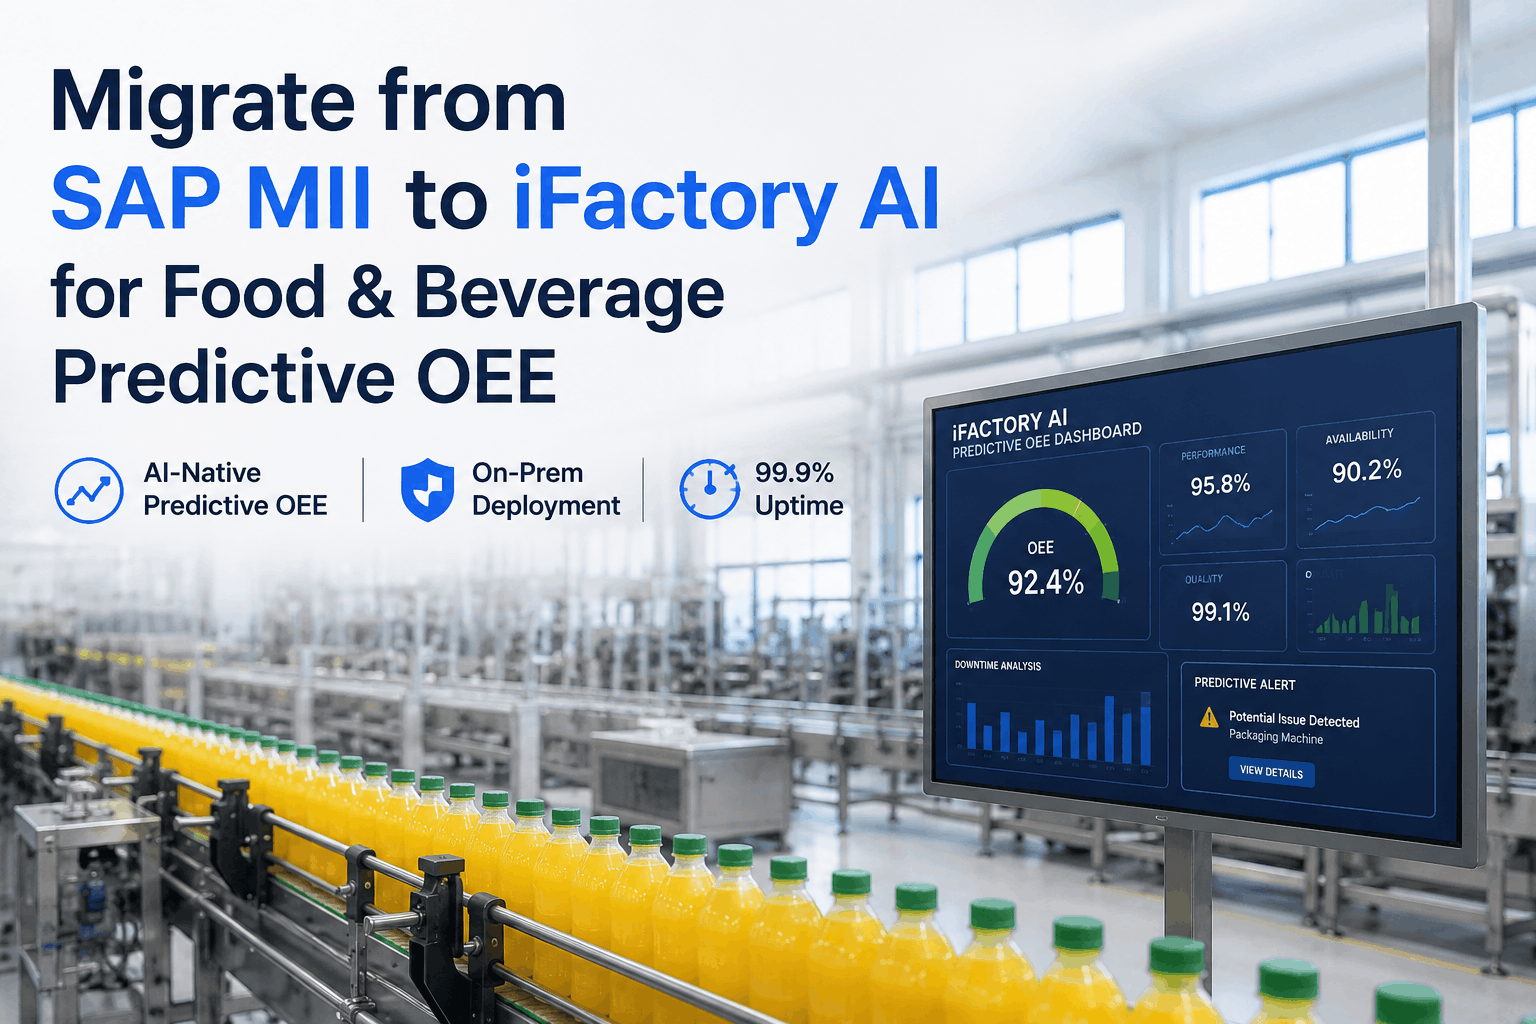
Migrate from SAP MII to iFactory AI for Food & Beverage Predictive OEE
The F&B digital transformation leader's migration guide — from SAP MII / xMII / DMC descriptive OEE to AI-native Predictive OEE on a pre-configured NVIDIA appliance. SAP PCo alternative, on-prem deployment, 99.9% uptime, 6–12 week migration. Replaces lagging shift reports with hours-ahead OEE prediction.
The OEE Modernization Architecture: SAP MII vs iFactory AI
The architectural difference between SAP MII OEE and iFactory Predictive OEE is not a feature delta — it is a fundamental change in how OEE data is captured, processed, and surfaced. The diagram below shows the two architectures side-by-side, with the workload boundaries that the DT leader's migration plan has to address.
The DT leader's migration plan does not rip out the plant floor sources — those carry across. It replaces the SAP PCo middleware and the xMII OEE workloads with the iFactory integration layer and predictive OEE engine respectively, keeping the underlying data infrastructure stable. The architectural shift is concentrated in the layer where the SAP stack was structurally limited.
Want this architecture mapped to your specific F&B plant OEE stack? Schedule the AI Manufacturing Transformation Workshop — iFactory's F&B team will diagram your current SAP MII OEE workloads and the modernized equivalent. Sessions available this week.
Predictive OEE vs Descriptive OEE — The Capability Difference
"Predictive" is the marketing word that gets used loosely. The capability difference is concrete: predictive OEE forecasts each of the three OEE factors hours ahead with cause attribution, surfaces the specific F&B-relevant loss driver (changeover slippage, sanitation cycle drift, micro-stops accumulating, sequence-related quality risk), and gives the line and the DT-level dashboard an intervention window that descriptive OEE never provides. The capability model below shows what is actually different.
The shift the DT leader is funding is on the right column of every row — auto cause attribution, multivariate root-cause, predictive intervention windows. None of this is achievable on the SAP MII architecture without years of custom development; all of it ships pre-loaded on the iFactory appliance for F&B operations from day one.
The F&B OEE Loss Profile — Where the Modernization Pays Off
How OEE losses concentrate in food & beverage operations
F&B operations have a distinctive OEE loss profile — different from automotive, different from steel, different from semiconductor. The profile is dominated by changeover, sanitation/CIP cycles, sequence-dependent quality variability, and micro-stops on packaging and filling lines. Predictive OEE addresses each loss category structurally; descriptive OEE only reports it afterwards.
The top five categories typically account for 85–90% of OEE losses in an F&B plant. Predictive OEE addresses each with a specific capability rather than a generic "AI" overlay — changeover prediction informed by historical sequencing patterns, adaptive CIP cycle duration based on actual soil-load measurement, micro-stop causal attribution rather than category aggregation, and condition-based equipment models for unplanned downtime. The migration from descriptive to predictive maps directly onto this loss profile.
Want your specific F&B plant OEE loss profile mapped against predictive capability? Send your F&B segment and current OEE numbers to iFactory support and the team will return a tailored predictive-OEE impact projection — typically within 3 business days, no obligation.
Multi-Plant OEE Intelligence for the DT Leader
For digital transformation leaders managing an F&B portfolio across multiple plants, the predictive OEE migration carries a portfolio-level benefit that single-plant deployments cannot capture — cross-plant benchmarking, shared predictive models, and unified OEE governance. The orchestration view below shows how the modernized OEE architecture extends across plants.
Three Migration Paths for F&B OEE Modernization
Stay on MII / xMII
Extended SAP maintenance, descriptive OEE only. No predictive capability, no auto cause attribution. Competitive gap widens.
SAP DMC (Cloud)
Cloud-only modernization. Faster dashboards but still essentially descriptive OEE. WAN-bound · cloud lock-in · OpEx-growing.
iFactory Predictive OEE
True predictive OEE with auto cause attribution. NVIDIA appliance, pre-loaded F&B OEE models, on-prem, 99.9% uptime, 6–12 weeks.
Six F&B Operations Where Predictive OEE Pays Back Fastest
High-Changeover Plants
Predictive changeover sequencing reduces changeover-driven availability loss. Highest payback category in F&B OEE.
CIP-Heavy Operations
Adaptive CIP cycle duration cuts over-CIP. Sanitation-driven OEE loss reduces materially. CIP cost falls in parallel.
Packaging Line Plants
Causal attribution turns aggregated micro-stop time into specific equipment causes. Targeted interventions become possible.
Quality-Constrained Plants
Predictive quality intervention cuts the quality factor in OEE. Customer scorecard improvement follows.
Multi-Site Portfolios
Portfolio-level OEE intelligence and cross-plant benchmarking. Amortizes investment across multiple appliances for stronger TCO.
Aging-Equipment Plants
Predictive maintenance reduces unplanned equipment downtime — the OEE category that hits availability hardest in older plants.
HACCP, FSMA & F&B Compliance — Through the OEE Migration
Pre-built workflows preserved and enhanced through modernization
- HACCP — critical control point monitoring
- FSMA — Food Safety Modernization Act
- SQF / BRC — global food safety standards
- Allergen management — segregation evidence
- USDA — meat & poultry inspection support
- Customer scorecards — retailer-specific specs
- Food traceability — full lot genealogy
- Production records — automated retention
The OEE migration does not disrupt compliance evidence — it improves it. The same data that drives predictive OEE also feeds HACCP, FSMA, and customer scorecard evidence as a byproduct of the modernized data flow. Audit posture improves through the migration rather than being disrupted by it.
Two Real F&B Predictive OEE Migration Outcomes
Beverage manufacturer with 14 packaging lines and a high SKU count driving heavy changeovers
A mid-size beverage manufacturer ran 14 packaging lines across one large plant producing over 80 SKUs for major retailers. OEE sat in the mid-50s due to changeover-driven availability loss and micro-stop accumulation on bottling lines. SAP MII reported the losses after each shift but the DT leader could not extract predictive insight or causal attribution from the existing stack.
Snack & bar manufacturer with multi-allergen production and sanitation-heavy OEE losses
A snack and bar manufacturer running 9 lines across multi-allergen production faced significant sanitation-driven OEE loss — fixed-time over-CIP was conservative for safety but eating into availability. Customer scorecard pressure prevented any reduction in sanitation rigor. The DT leader needed predictive OEE that could verify CIP effectiveness rather than rely on time-based assumptions.
Neither scenario matches your operation? Send your F&B segment, plant footprint, and current OEE baseline to iFactory support and the F&B team will return a customised migration analysis with 12-month roadmap — typically within 3 business days, no obligation.
iFactory's F&B Predictive OEE Deployment
Same AI-native platform on either deployment model. On-prem is recommended for F&B predictive OEE given line-speed latency requirements, recipe and customer-spec IP sovereignty, and the 99.9% uptime expectation for production OEE systems. Cloud is available for portfolio-level OEE governance across multi-plant operations.
iFactory On-Premise Appliance Recommended for F&B predictive OEE · 99.9% appliance uptime
- Pre-configured NVIDIA AI server — pre-loaded F&B OEE models, racked, ready.
- <50ms edge inference — line-speed predictive OEE decisions.
- 99.9% appliance uptime — production-grade reliability for OEE.
- SAP PCo alternative — integration layer replaces middleware.
iFactory Cloud For multi-plant F&B portfolio OEE governance
- Fully managed — no rack, no facility requirements.
- Same predictive OEE engine — full capability available.
- Portfolio-level OEE benchmarking across plants.
- Fastest deployment — first plant live in 2–4 weeks.
Predictive OEE is the migration. Descriptive dashboards are not.
SAP MII descriptive OEE was always going to be lagging. The DT leader's mandate is to move to genuinely predictive OEE — with auto cause attribution, hours-ahead forecasting, and the production-grade uptime an F&B operation requires. iFactory delivers it on a pre-configured NVIDIA appliance, on-prem, 99.9% uptime, live in 6–12 weeks. The AI Manufacturing Transformation Workshop sizes the migration for your specific F&B portfolio.
FAQ: F&B Predictive OEE Migration from SAP MII
What makes iFactory predictive OEE different from SAP MII OEE dashboards?
Three structural differences. First, auto cause attribution — micro-stops and downtime are linked to specific equipment causes rather than aggregated into categories. Second, hours-ahead forecasting — OEE risk is predicted before it materializes, giving an intervention window descriptive OEE never provides. Third, F&B-specific models — changeover prediction, adaptive CIP duration, and predictive quality intervention are pre-loaded rather than custom-built. Book a demo to see predictive OEE on representative F&B scenarios.
How does iFactory replace SAP Plant Connectivity (PCo) as the data on-ramp?
iFactory's integration layer replaces SAP PCo as the on-ramp from plant floor sources — speaking OPC UA, MQTT, and PLC fieldbus protocols natively, with the same tag-mapping and destination-routing as PCo plus direct AI consumption of the data. Existing PCo configurations are imported during deployment so tag mappings carry across. This is a workload-by-workload replacement rather than a rip-and-replace.
What is the 99.9% uptime claim based on, and how is it achieved?
99.9% applies to the iFactory appliance and the predictive OEE engine running on it. Achieved through redundant power and storage in the appliance, automatic failover, and managed software updates that do not interrupt production. The on-prem deployment is also resilient to WAN outages — predictive OEE continues operating even when external connectivity is lost. The figure is contractual in standard deployments and verifiable through the appliance's own observability stack.
How long until we see measurable OEE improvement post-migration?
Most F&B plants see measurable OEE improvement within the first 8–12 weeks post-cutover, with full year-one improvement typically in the +8 to +14 point range depending on starting baseline and loss profile. The fastest gains come from changeover prediction (when high-SKU) and adaptive CIP (when CIP-heavy). The slower gains come from predictive maintenance and quality intervention as the models tune on plant-specific data over the first 60–90 days.
Do I have to buy NVIDIA servers separately?
No. iFactory's on-premise appliance ships fully loaded — pre-configured NVIDIA AI server, F&B predictive OEE models pre-installed, network gear, cabling, edge devices for line-side inference, integration adapters for SAP MII/xMII/ERP and major plant systems. You provide rack space, line power, Ethernet, and integration points. The deployment team handles installation, validation, and configuration across the 6–12 week window. For cloud, no hardware investment.
Can we run iFactory predictive OEE alongside SAP MII during migration?
Yes — and it is the recommended migration pattern. iFactory stands up in parallel to the existing SAP MII OEE stack, runs in shadow mode while validating parity with current OEE numbers, then becomes primary at cutover. SAP MII can remain available as a fallback during a defined stabilization period. The DT leader retains full sequencing control and rollback path at every step.
What does the AI Manufacturing Transformation Workshop cover for F&B OEE?
The half-day workshop covers — current-state SAP MII OEE assessment, predictive vs descriptive capability walkthrough on your plant's loss profile, F&B OEE model demonstration (changeover, CIP, micro-stop attribution, predictive quality), three-path migration comparison with cost/timeline projections, multi-plant portfolio architecture if applicable, HACCP/FSMA evidence preservation, and ROI projection. Outcome is a concrete migration plan suitable for DT leadership, plant operations, IT/OT, and finance.
Move from descriptive OEE to genuinely predictive OEE. The DT decision is overdue.
Hours-ahead OEE forecasting, auto cause attribution, F&B-specific models for changeover and CIP, predictive quality and maintenance — all on a pre-configured NVIDIA appliance, on-prem, 99.9% uptime, 6–12 week migration. The SAP MII replacement purpose-built for F&B predictive OEE. The Workshop is the fastest way to size the migration — sessions available this week.