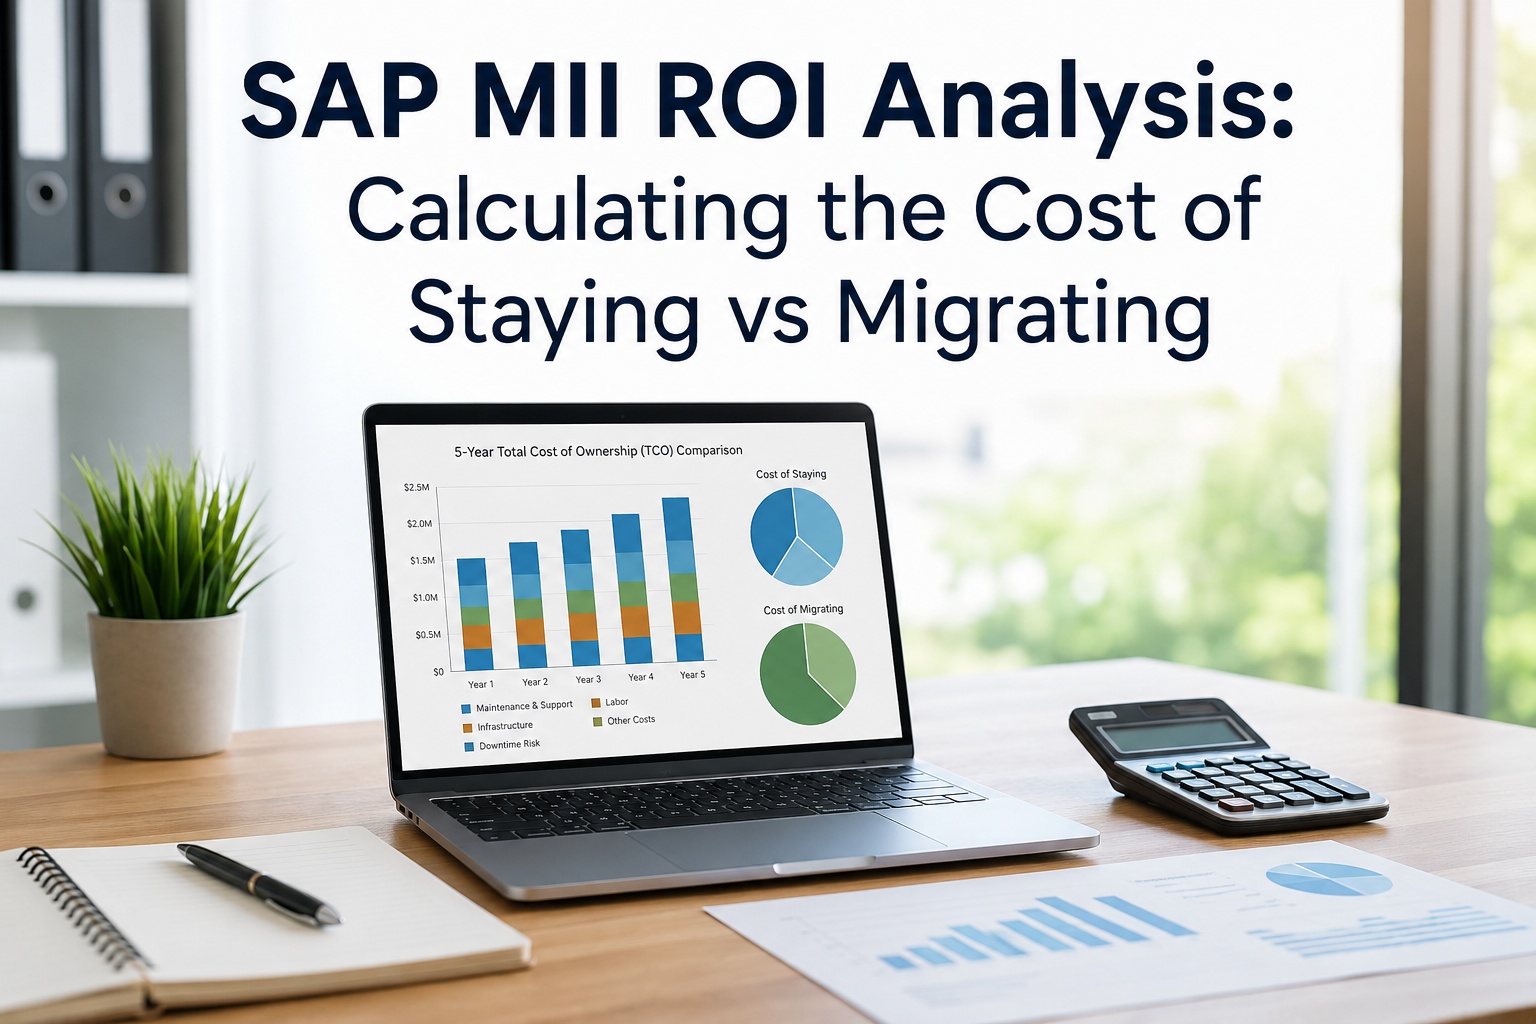
The SAP MII migration decision lands on the CFO's desk eventually, and the question is always the same — what does it actually cost to stay versus migrate, over five years, with the real numbers? This page is the framework. It walks through the 5-year TCO of staying on SAP MII through extended support, the 5-year TCO of the three viable migration paths (SAP DM Cloud, third-party MES, iFactory AI-native on-prem or cloud), and three real customer scenarios with the math shown. Use it as the structure for your own business case. The ranges given are based on industry benchmarks and recent SAP MII customer migrations — your numbers will vary, but the framework holds.
SAP MII ROI Analysis: Calculating the Cost of Staying vs Migrating
A CFO-grade framework covering support fees, technical debt, AI productivity uplift, and total 5-year TCO across every viable path — including iFactory's on-premise appliance and fully managed cloud options.
The Decision Is Financial, Not Just Technical
Most SAP MII discussions get stuck at the IT layer — which platform is technically superior, which integration is cleaner, which has the better roadmap. Those questions matter, but they're not what the CFO asks. The CFO asks four questions. What's the 5-year cost of staying? What's the 5-year cost of migrating? What's the productivity uplift either way? What's the risk-weighted answer? This page answers each one with the actual ranges.
Industry data backs the urgency — warranty and quality costs typically consume 2–3% of revenue, sometimes 5%, with the AI productivity layer being the single largest lever to reduce them. SAP DM Cloud delivers MES execution but doesn't ship deeply with the AI capabilities that move the warranty number. The 5-year TCO question really splits into two — what runs production execution, and what adds the AI uplift on top? iFactory addresses the second question on either deployment model.
5-Year TCO — The Two Sides of the Equation
Read the math, not just the totals. The staying number looks defensive but small until you include the lost-productivity row, which is the biggest single line item on either side. The migrating number looks expensive until you include the productivity-gain offset, which can flip the net to zero or negative for plants that capture the AI uplift well. The right answer for any specific plant depends on which lines apply — that's what the custom TCO assessment tunes.
Where the Real Money Is — The Productivity Uplift
License, maintenance, implementation — these are real costs, but they're not the biggest costs. The biggest single financial lever in any MES discussion is the productivity uplift the modern stack enables. Below are the typical ranges based on iFactory deployment data and industry benchmarks.
| Productivity lever | Typical baseline pain | AI-uplift opportunity (annual) | How it's captured |
|---|---|---|---|
| Warranty & quality cost reduction | 2–3% of revenue, sometimes 5% | 10–25% reduction = $200K–2M+/yr | Vision inspection (CNN+PINN), SPC, autoencoder anomaly |
| Unplanned downtime reduction | 3–10% of capacity, $/hr varies | 20–35% reduction = $500K–3M/yr | LSTM equipment health, predictive maintenance |
| First-pass yield improvement | Plant-specific, often 85–94% | +2–5 percentage points | RL Scheduler, real-time setpoint optimization |
| Energy & raw material efficiency | 5–15% above optimal | 3–8% reduction | RL energy scheduler, autoencoder efficiency |
| Operator productivity | Ramp-up time for new variants | 30–50% faster training-to-competency | Vector RAG operator copilot, grounded in plant SOPs |
| Supplier quality & PPAP | 2–6 month PPAP rework cycles | 40–60% cycle compression | LLM doc analysis + rule engine pre-validation |
The honest assessment — most plants don't capture all of these. A typical iFactory deployment captures 2–4 of the levers strongly in the first year, with the rest ramping in years 2–3 as model confidence improves and operator trust builds. Even at 2–4 levers captured, the cumulative 5-year productivity uplift typically exceeds the entire migration cost.
Build Your Business Case — Six-Step Framework
Establish baseline — current SAP MII cost & current pain
Annual license + maintenance, internal FTE allocation, current warranty cost as % of revenue, current downtime hours and $/hr, current first-pass yield. This is the "stay" baseline. Numbers should come from finance, not from vendor decks.
Project the stay-cost curve through 2030
Years 1–2 — standard SAP maintenance. Years 3–5 — premium extended support (2–4% uplift). Add a technical debt accumulation factor (5–10% annual on internal labor). Add an opportunity-cost line for AI productivity NOT captured. This is the do-nothing baseline.
Get firm quotes for migration paths
SAP DM Cloud (subscription + implementation). Third-party MES (Plex, Opcenter, Proficy, Apriso, Tulip — quotes vary 5x for the same plant). iFactory on-prem appliance (CapEx, one-time) or iFactory Cloud (subscription). The migration-cost number isn't a guess — vendors will quote.
Calculate productivity uplift conservatively
Pick 2–3 productivity levers your plant can capture in year 1 (warranty reduction, downtime reduction, yield improvement). Apply ranges from the table above to your specific revenue and capacity numbers. Use the low end of the range. This is your conservative ROI side.
Build the net 5-year TCO comparison
Stay-cost (Step 2) versus migrate-cost (Step 3) minus productivity uplift (Step 4). Show NPV at your corporate hurdle rate. Show payback period. Show the breakeven scenario — what productivity uplift needs to be captured for migration to break even.
Add the risk-weighted overlay
Staying past 2030 = unsupported platform risk (audit, security, integration). Migrating now = execution risk. Both are real. Most business cases quantify the unsupported-platform risk as a 10–20% probability-weighted cost premium on the stay-cost; quantify execution risk as a 15–25% premium on the migrate-cost. This is where the CFO will look first.
The 5-year stay-versus-migrate equation
For most mid-to-large industrial plants with current warranty cost at 2%+ of revenue, the equation is net-positive for migration by year 3.
Three Real ROI Scenarios — With the Math
Three customer profiles with the actual 5-year TCO comparison. Numbers are representative ranges, not exact quotes — your situation will differ but the structure shows what an honest analysis looks like.
Heavy MII customization, complex multi-site, $2B annual revenue
A multi-plant industrial enterprise with 5 production sites, deeply customized SAP MII running across all of them. Annual MII license + maintenance ~$800K. 4 FTE dedicated to MII/PCo across IT. Warranty currently 2.4% of revenue ($48M/yr exposure).
Light MII customization, $180M revenue, no internal MII team
A specialty manufacturer with one plant. SAP MII used primarily for SAP ERP integration and OEE reporting. Minimal custom logic. Annual MII maintenance ~$80K. 0.5 FTE on MII (shared with other SAP work). Warranty 2.8% of revenue ($5M/yr exposure). No SAP DM appetite — overkill for the operation.
Highly customized SAP MII for batch records, validated state, $600M revenue
A pharmaceutical API manufacturer running heavily customized SAP MII under GxP validation since 2011. Annual MII maintenance ~$300K. 3 FTE dedicated. Cloud not permitted under current GxP validation policy. Warranty cost ~1.5% of revenue but regulatory compliance is the bigger risk.
Why iFactory Tilts the ROI Math
The math above shows iFactory's role consistently — it's the productivity-uplift component that moves the net TCO from neutral to positive. The reason it's structurally cheaper than building the same uplift inside an MES migration is twofold. First, iFactory ships as a turnkey appliance or fully managed cloud — 6 to 12 weeks to deployment, not 12 to 24 months like enterprise MES rollouts. Second, the deployment model is your choice — on-prem or cloud — which means you don't have to fight your data residency rules or cloud policy to capture the AI value.
iFactory On-Prem Appliance CapEx-heavy, lowest 5-year TCO, full data sovereignty
- $80K–500K CapEx typical, depending on plant size — amortizes over 4–5 years.
- Pre-configured NVIDIA AI server — racked, software-loaded, ready to plug in.
- Sub-50ms inference at the line — vision, RL scheduling, adaptive robotics.
- Works during WAN outages — no cloud-round-trip dependency.
- Lowest 5-yr TCO for high-utilization production workloads.
iFactory Cloud OpEx-heavy, fastest deployment, elastic scale
- $2K–50K+/mo OpEx depending on plant count and consumption.
- Fully managed — no rack, no facility requirements.
- First pipeline live in 2–4 weeks — fastest path to ROI realization.
- Fleet benchmarking across multi-plant deployments in a single tenant.
- Lowest 5-yr TCO for multi-site fleets and greenfield plants.
Stop guessing. Get the numbers for your plant.
The 60-minute TCO assessment plugs your actual numbers into this framework — current MII cost, plant revenue, warranty rate, downtime hours, FTE allocation. Output is a customized 5-year TCO comparison across the four paths, a sensitivity analysis on the productivity uplift assumptions, and a recommended deployment model with NPV and payback period.
Frequently Asked Questions
Are these numbers real or marketing-padded?
The ranges given are based on industry benchmarks and recent SAP MII customer migrations — they're representative, not exact for any specific plant. The wide ranges (e.g., $200K–$2M for warranty reduction) reflect genuine variability across plant sizes and industries. Your business case needs your numbers plugged into the framework — that's what the custom TCO assessment does.
What's the single biggest line item in this analysis?
The productivity uplift — almost always. License fees, maintenance costs, and implementation are real, but the 5-year cumulative productivity uplift (warranty reduction, downtime reduction, yield improvement, energy optimization) typically exceeds all other line items combined on the migration side. The opposite is also true — the opportunity cost of NOT capturing that uplift is the biggest hidden cost of staying.
Do I have to buy NVIDIA servers separately?
No. iFactory's on-prem appliance CapEx ($80K–500K typical) includes the pre-configured NVIDIA AI server, software pre-installed, network gear, cabling, and edge devices. You provide rack space, line power, and Ethernet. For cloud deployment, there's no hardware investment at all.
How do I decide between iFactory on-prem and iFactory Cloud for TCO?
The general rule — on-prem has lower 5-year TCO for sustained high-utilization production workloads (above ~70% GPU utilization) and for plants with data residency requirements. Cloud has lower 5-year TCO for multi-site fleets, lower-utilization use cases, and customers preferring OpEx over CapEx. The 60-minute TCO assessment computes the crossover point for your specific situation.
Is staying on SAP MII through 2030 really viable?
For some plants — yes. Especially regulated industries where revalidating an entirely new MES is more expensive than the extended support fees. Mid-market operations where the migration economics don't pencil. Or plants where the productivity uplift can be captured via an AI layer (iFactory) without disrupting the underlying MES. The framework above shows the math — for many plants, staying is the right answer for 2 to 3 more years while modernizing the AI layer first.
What's the typical payback period for a migration?
Varies widely. iFactory-only deployments (replacing MII directly or layering on existing MES) typically show payback in 10–18 months. SAP DM Cloud migrations alone typically show payback in 24–36 months, often longer. Combined SAP DM + iFactory deployments show payback in 18–30 months, with the iFactory side capturing the productivity uplift faster than the SAP DM side.
How conservative should I be in the productivity uplift assumptions?
For the CFO-facing version of the business case, use the low end of each range and assume only 2–3 of the 6 productivity levers are captured in year 1. Even with that conservative posture, most plants show migration as net-positive within 24–36 months. Higher capture rates (4–5 levers) drive payback under 18 months but those numbers need to be defended with plant-specific data.
What about NPV at our corporate hurdle rate?
Apply your corporate hurdle rate (typically 8–12% for industrial enterprises) to both the stay-cost cash flow and the migrate-cost net cash flow. The framework above shows undiscounted figures for clarity, but the discounted version typically still favors migration for plants where productivity uplift is real and capturable. The custom TCO assessment includes NPV at your specific hurdle rate.
The CFO will ask for numbers. This is how you have them ready.
Stay or migrate is a 5-year financial decision, not just a technical one. iFactory's 60-minute TCO assessment plugs your plant's actual numbers into this framework and produces a defensible business case — across all four paths, with NPV, payback, and sensitivity analysis. On-prem appliance or fully managed cloud.