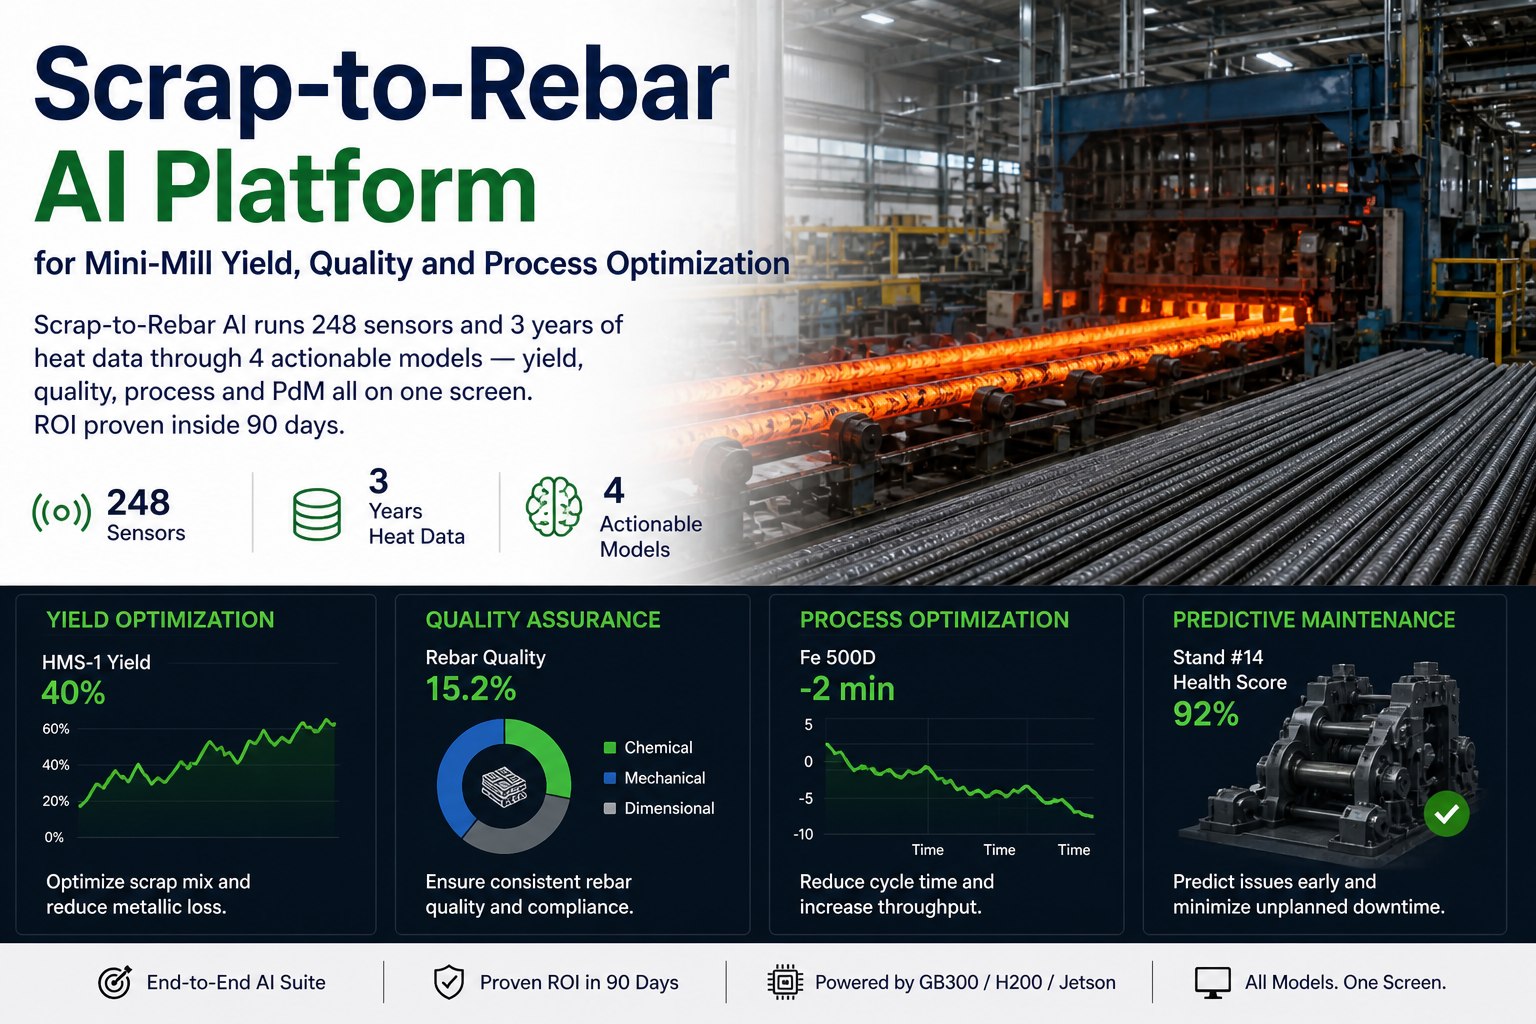
The scrap-to-rebar route is one of the most data-rich production chains in heavy industry — and one of the most under-instrumented in terms of how that data actually drives decisions. A modern mini-mill running scrap yard, EAF, ladle furnace, continuous caster, and rolling mill generates a continuous stream from hundreds of sensors, but most of it lives unused on disk. iFactory's Scrap-to-Rebar AI Platform reads 248 sensors continuously, learns from three years of historical heat data, and runs four actionable model suites on a single operator screen: YIELD optimization, QUALITY prediction, PROCESS efficiency, and PREDICTIVE MAINTENANCE. Each suite ships with a measurable target. The full platform reaches ROI in under 90 days.
Upcoming iFactory AI Live Webinar:
Scrap-to-Rebar AI — One Screen, Four Suites, 90-Day ROI
Join the iFactory steel team for a live walk-through of an AI platform purpose-built for the scrap-to-rebar route. 248 sensors · 3 years of heat data · 4 actionable suites — YIELD, QUALITY, PROCESS, PdM — running together on the operator's primary screen.
248 Sensors. Three Years of Heats. One Continuous Digital Thread.
Most mini-mill AI projects fail at the data layer — not the model layer. They underestimate how scattered scrap-to-rebar process data really is: scrap yard scales, EAF transformer logs, ladle furnace temperature probes, caster mold thermocouples, rolling mill stand torques, finishing line dimensional gauges, ERP charge records, lab analyzer outputs, and SAP QM holds. iFactory's platform begins by stitching all 248 of these signals into one heat-ID-anchored timeline, then trains every model on three years of complete heat records — a foundation no point-tool can match. Book a 30-minute review for a sensor-mapping walkthrough on your specific mill.
Four Modules. Four Specific Deliverables. One Operator Screen.
Every iFactory scrap-to-rebar deployment ships with the same four model suites. Each one has a specific, measurable target tied to a specific decision the operator makes today. None of them are research demos. All of them run on the same platform, sharing the same heat-ID-anchored data foundation, surfaced through one operator console.
EAF charge constitutes about 76% of total liquid steel cost — and the charge mix decision is where yield, residuals, and energy use are jointly determined. The Scrap-Mix ML model takes today's grade requirement, scrap yard inventory, supplier price/quality data, and 3 years of historical charge-yield outcomes, then recommends a charge mix per heat that hits target chemistry while minimizing HMS-1 dependency. Plants typically run 50–60% HMS-1 today. The AI brings it down toward 40% by intelligently substituting AIS (PI/DRI), shred, and bundles where chemistry permits — without compromising residuals.
An artificial neural network trained on 50,000+ heat records correlates chemistry (C, Mn, Si, S, P), rolling exit temperature, quenching rate, and final mechanical properties. The network predicts yield strength, ultimate tensile strength, and elongation per heat to within ±15 MPa at 95% confidence — before the bar reaches the testing lab. That means heats projected to drift out of Fe 500D / IS 1786 / ASTM A615 spec are caught at the caster, not at customer ship. Mill test certificates are generated automatically from the same record.
Modern EAFs target tap-to-tap times under 45 minutes. iFactory's SPC suite watches the live distribution of every Fe 500D heat against the 3-year historical envelope and flags the specific stage — power-on, refining, slag conditioning, ladle wait — where current heats are running long. Recommendations surface to the EAF operator in real time. Two minutes saved per heat across 30+ heats per day is roughly an hour of additional capacity recovered without changing the EAF.
Rolling mill stand failures are among the most disruptive mini-mill events. An LSTM trained on three years of stand torque, vibration, bearing temperature, and roll gap data — anchored to the heat ID and bar size being rolled — predicts approaching mechanical issues 48–72 hours in advance. Demonstration deployments routinely surface specific stands (Stand #14 is the canonical example) where the model identifies degradation patterns invisible to threshold alarms. Maintenance moves from reactive to scheduled.
All Four Suites — On the Operator's Primary HMI
The reason this works is the single screen. Operators don't context-switch between four tools. They see all four suites — yield, quality, process, PdM — on the same console, with the heat ID linking everything. Below is a representation of the operator console as it runs in production deployments.
Edge + Plant + Enterprise — Sized for Mini-Mill Workloads
- Real-time SPC inference
- Per-stand LSTM execution
- Sub-second sensor ingestion
- IP65 / mill-environment hardened
- ANN quality prediction live
- Scrap-Mix ML per-heat decisions
- Operator console & HMI
- Heat-ID-anchored data lake
- 3-year heat data retraining
- Multi-mill model registry
- Plant LLM (Llama 3.1 70B)
- Mill test certificate generation
Spreadsheets · Point Tools · iFactory Suite
| Capability | Spreadsheets & SCADA | Single-Stage Point Tool | iFactory Suite |
|---|---|---|---|
| Sensor coverage | ~30–50 manually entered | One stage at a time | 248 sensors continuous |
| History depth | Last 24h on screen | Vendor-specific window | 3 years heat-anchored |
| Charge-mix optimization | Recipe sheets | EAF-only burden tools | Scrap-Mix ML · per heat |
| Quality prediction | Lab test post-cast | Single chemistry model | ANN · ±15 MPa @ 95% |
| Tap-to-tap analytics | End-of-shift report | Heat-by-heat charts | SPC · stage-level live |
| Stand failure prediction | None | Vibration thresholds | LSTM · 48–72h lead |
| Heat-ID traceability | Manual log | Stage-only | Continuous · 15-20 steps |
| Operator surface | Multiple HMIs | Vendor portal | Single screen · 4 suites |
| Cloud dependency | None | Vendor-specific | None — fully on-prem |
| Time to ROI | — | 12+ months typical | < 90 days |
From Sensor Audit to Full Suite Live in 12 Weeks · ROI in <90 Days
The 90-day ROI claim assumes deployment in priority order — yield first (largest cost lever), quality next (defends margin), process third, predictive maintenance last (longest data baseline). Schedule a deployment review with our steel team.
Deployment cost recovers inside the first quarter on yield savings alone; quality, process, and PdM are pure margin from there. The exact numbers depend on your scrap mix, grade portfolio, and mill capacity — we model them site-specifically during the assessment.
What Mill GMs Ask First
The platform deploys against whatever depth you have. Yield, Quality, and Process suites become measurably better as more heats accumulate; PdM needs at least 6–12 months of stand telemetry to be useful. Many mills start with 12–18 months of recoverable data and add fidelity over the first year of operation.
The Scrap-Mix ML model retrains weekly on incoming heat outcomes and incorporates supplier delivery records. Seasonal shifts in HMS-1 quality, shred composition, or AIS pricing are exactly the kind of dynamic the model is built to track.
No — and it's not designed to. Lab testing remains the compliance-of-record source for mill test certificates. The ANN catches drift before the lab test, allowing earlier intervention at the caster and reducing the volume of out-of-spec material. The lab confirms; the ANN prevents.
Yes. The architecture is grade-agnostic — wire rod, sections, structural bars all use the same four model suites with grade-specific thresholds. Rebar happens to be the densest deployment domain because the volumes and standardization (Fe 500D / IS 1786 / ASTM A615) make outcome measurement clean.
Built for Mini-Mills — Not Adapted From a Generic Manufacturing Tool
Get the Sensor Map and 90-Day ROI Plan for Your Mill
Thirty minutes with our steel engineering team. Bring your sensor inventory, scrap mix history, recent grade portfolio, and any stand failure records from the last 24 months. We'll map the realistic 248-sensor coverage across your specific scrap-to-rebar route, model the yield/quality/process/PdM benefit per suite, and outline a 12-week deployment to a single operator console. Talk to support for preliminary scoping if you'd prefer to start there.