It is 14:32 on a Tuesday afternoon at a Grade B500B 20 mm rebar mill. The latest tensile-test sample comes back from the lab — elongation 15.2%. The minimum spec is 14.5%. On paper the bar passes. In SPC reality, the chart tells a different story: this is the seventh consecutive sample drifting downward, the moving average has shifted nearly two sigma below the historical mean, and the silicon reading on the same heat is 0.28% — the upper boundary of the operating window. By every Western Electric rule, this is a process going out of control before it goes out of spec. The iFactory SPC Quality Predictor — running on an on-site NVIDIA H200 inference node — saw the drift four samples ago, correlated it to the rising Si trend, and at 14:32 issued a single, actionable recommendation: cut FeSi addition on the next heat by 1.4 kg per tonne, expected elongation recovery to 16.4% within three heats, confidence 88%. No quality hold. No customer downgrade. No 200-tonne rework batch. Just one tap-room setpoint nudged before the SPC chart actually breaks.
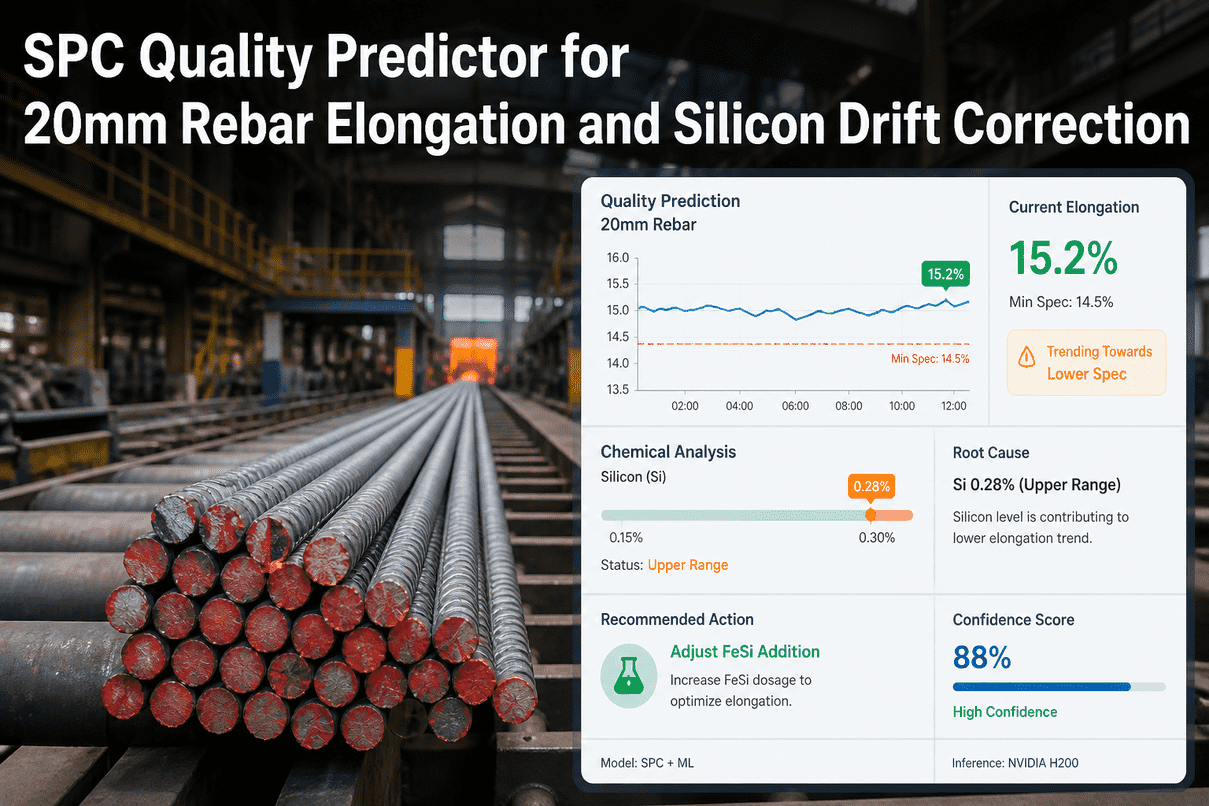
SPC Quality Predictor for 20 mm Rebar Elongation
and Silicon Drift Correction
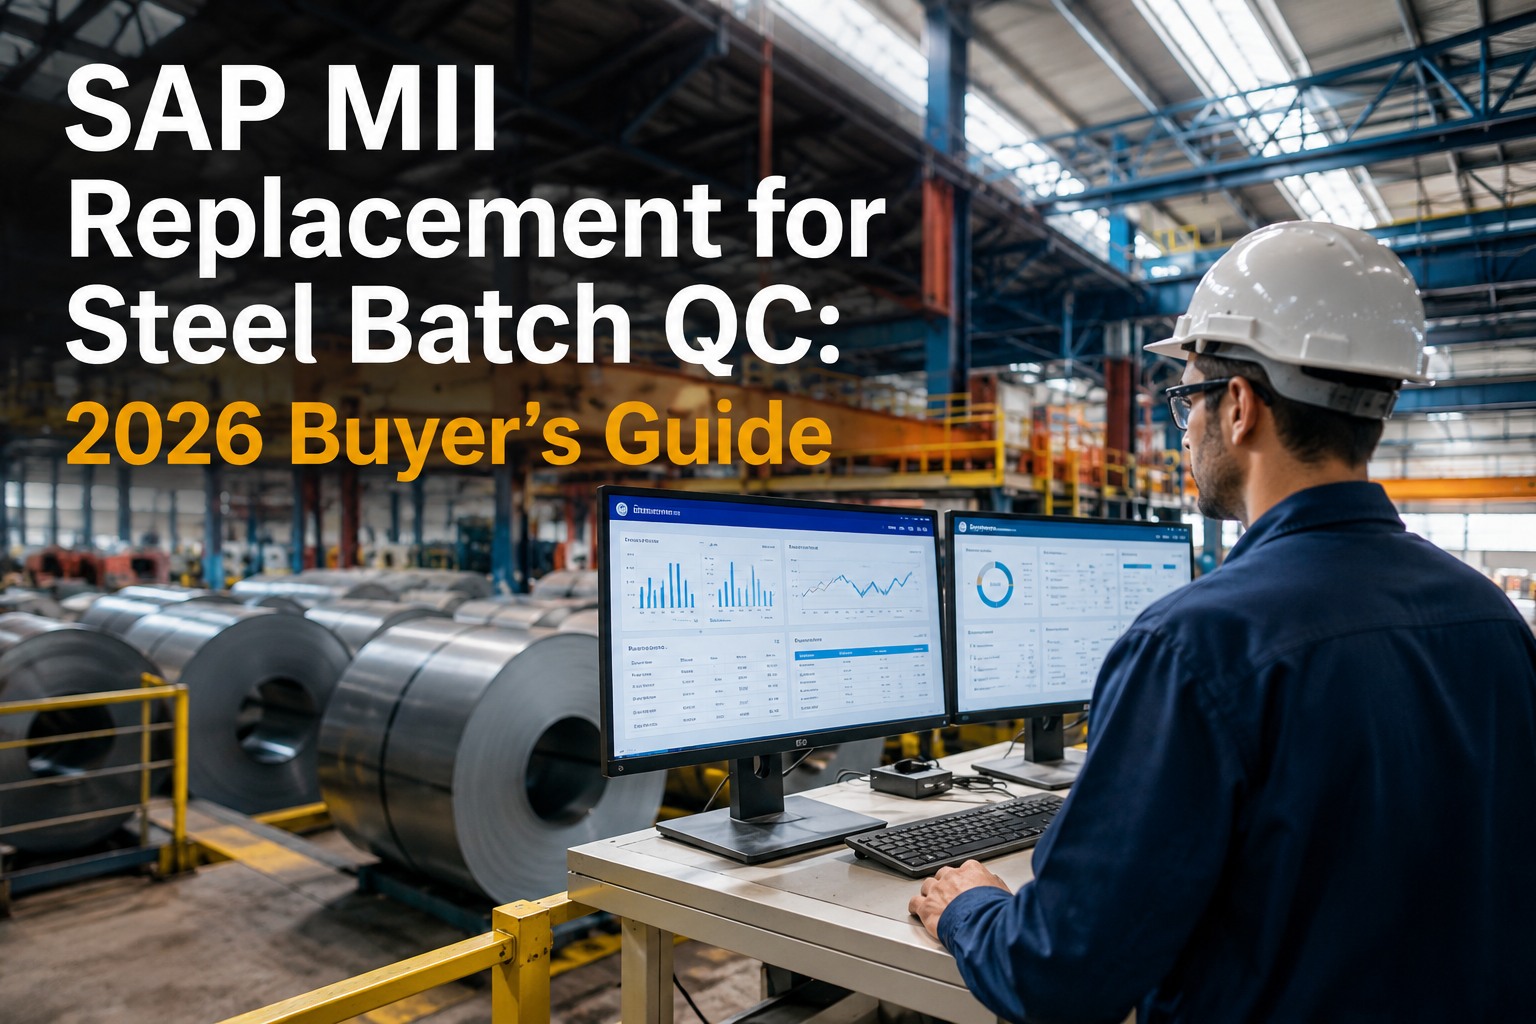
Hybrid Western Electric SPC + gradient-boosted ML detects elongation drift 4–7 heats before a hold. Roots cause to a single chemistry variable. Recommends the FeSi tap-room correction. Pre-trained on rebar mill data, runs on your on-site H200 inference node. Owned by you outright.
A Bar That Passes The Test, But Is About To Fail The Process
A 20 mm rebar with 15.2% elongation is in spec — barely. BS 4449 Grade B500B requires a minimum of 14.5%. That sounds safe until you watch the trend: it has been dropping every shift for two days. Talk to a metallurgist on our team about your Si window.
Pull a rebar in a tensile test. The percentage it stretches before snapping is the elongation. Higher number = more ductile = the bar bends in a structure rather than shatters. For seismic and structural use, ductility is non-negotiable.
Silicon is added in the ladle as ferrosilicon (FeSi) to deoxidise the steel and tune its strength. Too little — the steel oxidises and inclusions form. Too much — the bar gets stronger but loses ductility. Elongation drops. The rebar mill walks a tight line every heat.
One bad sample is a quality department's nightmare. A slow drift over 30 heats is a metallurgist's nightmare. By the time the SPC chart actually breaks, you've already shipped 18 tonnes of borderline product to a customer. The Quality Predictor catches the trend long before the wall.
What The Predictor Saw At 14:32 Today
Elongation samples plotted against the lower spec limit. The last seven points form a clear downward trend — Western Electric Rule 3 violation: six or more points trending in one direction. The Predictor flagged this at sample 23, four heats before the visible drift was obvious to the operator.
Operator's view at heat 29: "Still in spec, no alarm." Predictor's view at heat 25: "Drift trajectory will breach 14.5% at heat 33. Confidence 88%. Action: trim FeSi by 1.4 kg/t on next heat."
The Predictor Doesn't Just Spot Drift. It Names The Variable.
A traditional SPC chart tells you something is wrong. It does not tell you which of 23 process variables is responsible. The hybrid SPC + gradient-boosted ML model in the iFactory Quality Predictor ranks the contribution of every input variable to the predicted elongation drop — and shows the math behind the conclusion.
Read it like this: the model attributes 88% of the predicted elongation drop to silicon trending toward the upper boundary of the operating window. Other variables contribute, but Si is the lever. Adjust Si and the elongation curve recovers — confirmed against three months of historical heats with the same drift signature.
Silicon Up, Elongation Down — A Curve The Mill Lab Already Knows
Pull 24 months of heats from the historian and plot Si content against elongation A5. The relationship is real, repeatable, and the reason your metallurgist worries about FeSi dosing every shift. The Quality Predictor uses this same curve, but evaluates it on every heat in real time.
| Si content | Si zone | Mean elongation A5 | SPC behaviour | Risk |
|---|---|---|---|---|
| 0.15 – 0.18% | Lower normal | 17.4 – 17.8% | Stable, mid-range | Low |
| 0.18 – 0.22% | Target band | 16.6 – 17.2% | Centred on mean | Low |
| 0.22 – 0.25% | Upper normal | 15.8 – 16.4% | Healthy variability | Watch |
| 0.25 – 0.30% | Upper range | 15.0 – 15.6% | Drift toward LSL | High — current |
| > 0.30% | Out of range | 14.0 – 14.8% | Likely SPC break | Critical |
A Setpoint, Not A Sermon
When the Predictor flags a drift, it does not produce a 12-page report. It outputs one card on the metallurgist's screen, with the action, the expected result, the confidence, and the alternative if the recommendation is rejected. The whole interaction is under 30 seconds.
Two Models, Working In Layers
SPC alone is fast but blind to causation. ML alone is powerful but opaque. The Quality Predictor stacks them: SPC first for speed and explainability, ML second for variable attribution. Both run on the same H200 inference node, both audit-logged, both visible to your QA team.
Runs on every new sample. 8 classical SPC rules — single point beyond 3σ, 2 of 3 beyond 2σ, 6 in a row trending, 8 on one side of mean, mean shift detection. Fast, explainable, defensible to an auditor.
XGBoost regressor trained on 24 months of heat-level data — chemistry, temperatures, tap-to-cast, casting speed, mould oscillation, billet reheat profile. Outputs SHAP values for every variable's contribution to the predicted elongation.
Maps the top root-cause variable to the operator-actionable lever (FeSi rate, tap-to-cast time, finishing temp). Uses a constrained optimiser that respects your mill's metallurgical guardrails. Always offers an alternative.
What A Single Quality Hold Actually Costs A Rebar Mill
When elongation breaches 14.5% on a Grade B500B 20 mm batch, the consequences cascade quickly. Indicative numbers from a 1.2 million-tonne-per-year integrated rebar producer, drawn from in-production iFactory deployments.
Hardware, Models, Integration, Training — All In One PO
The SPC Quality Predictor is not a SaaS subscription. It is a turnkey deployment: an on-site H200 inference appliance pre-loaded with the rebar Quality Predictor, plus our engineers on the floor for integration and operator training. Six to twelve weeks from PO to live. Owned by you.
NVIDIA H200, racked and burn-in tested. Ships to your plant ready to power on. SPC + ML stack pre-installed. Audit-logged. Air-gapped from the public internet.
Pre-trained on a multi-mill rebar dataset covering 12+ heats per shift across 18 chemistry variables. Fine-tuned on your historian during weeks 9–12 to match your specific mill's drift signatures.
Our engineers connect the Predictor to your LIMS, plant historian (PI / Ignition / Aveva), tap-room HMI, and SAP QM. Western Electric SPC rules pre-configured. Recommendation cards land where the metallurgist already works.
Metallurgists, QA engineers, and tap-room operators go through a structured rollout — interpret the chart, action the recommendation, log the outcome, run audit reports for ISO 9001 / IATF 16949.
24×7 monitoring of the inference node, monthly model retraining on your latest heats, and quarterly drift-pattern reviews with our metallurgy lead. Optional after year one — the platform keeps running either way.
What QA & Plant Heads Ask First
No — it informs the lab. Tensile tests still happen on the same schedule. The Predictor reads the lab results plus the chemistry plus the process data, and tells the metallurgist where the next sample is heading. The lab is the truth source. The Predictor is the early warning.
The model trains per grade and per diameter. We deploy with the dominant SKU (often 20 mm B500B or 16 mm B500C) and add additional SKUs over the first 90 days as we collect their drift signatures. One H200 node handles 12+ SKUs comfortably.
SHAP attribution from the gradient-boosted model, weighted by the number of historical heats with the same drift signature. We expose the math, not just the percentage — your metallurgist can drill into which past heats the model is reasoning from. Talk to a deployment engineer for a model walkthrough on your data.
That is a feature, not a failure. Every override is logged with the operator's reason. The model retrains on overrides every month — they are some of the highest-value training data, because they capture mill-specific knowledge the dataset doesn't have yet.
Never. The H200 node sits inside your IEC 62443 zone. Heats, chemistry, lab results, and recommendations all stay on-prem. Audit logs are exportable for ISO 9001 / IATF 16949 reviews, but no raw data is uploaded to any cloud.
The Predictor keeps running. You own the appliance, the SPC engine, the trained model, and every recommendation card it has ever issued. Renew support & monthly retraining annually, run it in-house with our handover docs, or mix both.
Send Us 90 Days Of Heat Data. We'll Show You The Drift.
A 30-minute working session: bring 90 days of heats — chemistry, temperatures, lab elongation, lab yield. Our metallurgy team runs the Quality Predictor on your data offline and shows you exactly when the predictor would have caught your last three quality holds. No commitment, no slides, just the math on your data.