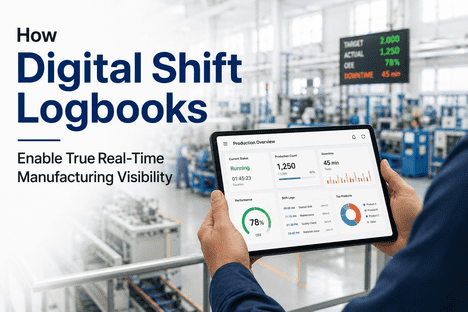
Most manufacturers do not have a data problem — they have a decision problem. Equipment streams sensor data continuously, MES systems log every cycle, and operators record observations every shift. Yet plants still lose between 16 and 28% of production capacity annually to data fragmentation and insight blindness, not from catastrophic failures but from disconnected SCADA, MES, and ERP systems that no manual report or monthly dashboard catches in time. Shift logbook data is where the operational truth lives — what actually happened on the floor, why a line slowed, which operator noticed a deviation, what the next shift inherited — but in most facilities that data dies in paper books or static PDFs and never reaches analytics. Manufacturing analytics built on structured shift logbook data closes that gap, turning every shift entry into a measurable input for OEE improvement, downtime root cause analysis, and KPI-driven decision making. Book a Demo with iFactory to see how shift logbook data becomes the foundation of a production intelligence layer in 8 weeks.
Why Shift Logbook Data Is the Most Underused Analytics Asset in Manufacturing
Manufacturing analytics platforms typically ingest data from three sources: machine sensors, MES production counts, and ERP transactional records. What they almost never ingest is the operator and supervisor context that explains why those numbers look the way they do. A line that ran 12% below target last Tuesday shows up in the OEE dashboard as a performance loss — but the reason is in the shift logbook entry where the operator noted a recurring material feed jam at 3:17 AM. Without that contextual layer, analytics can describe the problem but not diagnose it. Plants end up generating reports that flag symptoms while the root causes remain invisible to anyone outside the shift that experienced them.
Digital shift logbooks change this by converting every operator observation, deviation, downtime event, and handover note into structured data fields — line ID, equipment ID, deviation category, root cause code, action taken, time-stamped and attributed to a user. That structured data flows into the same analytics layer as sensor and MES data, giving plant leaders the full operational picture in a single view. iFactory's Shift Logbook is purpose-built for this integration: structured templates at the point of capture, direct connectors into BI platforms and analytics dashboards, and cross-shift pattern analysis that surfaces recurring issues no single operator could see on their own. Book a Demo to see how shift data fills the analytics gap in your current reporting.
From Raw Shift Entries to Actionable Insights: The Manufacturing Analytics Stack
A shift logbook entry on its own is a single data point. The value emerges when that entry connects to machine data, quality records, and historical patterns through a layered analytics stack. The following framework describes how iFactory transforms shift logbook data into the four tiers of insight that drive measurable KPI improvement.
Structured shift logbook data feeds directly into OEE component breakdowns — availability, performance, quality — with downtime categorized by root cause code at the point of operator entry. Plant managers see Pareto charts of downtime reasons across shifts, lines, and product families without analyst reconciliation. Shift-to-shift comparisons reveal which crews, equipment, or product changeovers are driving variation in real time rather than at month-end review.
Shift logbook context — operator notes, deviation categories, action codes — combined with sensor data turns "Line 3 lost 47 minutes" into "Line 3 lost 47 minutes due to recurring material feed jam during product changeover on third shift, third occurrence in 14 days." Pattern detection across structured shift entries identifies the recurring issues that any single operator would miss, and which generic OEE dashboards mask as random variation.
Months of structured shift data become a training set for predictive models that flag equipment degradation, quality drift, and shift-handover risk before they impact production. A pattern of three small leak observations on one pump over four shifts becomes a predictive maintenance trigger. Quality deviation entries clustering on a specific raw material lot become a supplier alert before customer complaints arrive.
When the analytics layer recognizes a recurring pattern, it surfaces the action that has historically resolved it — pulled directly from prior shift logbook entries where operators recorded successful corrective actions. Best practices stop living in tribal knowledge and start propagating across shifts and sites. New operators inherit the institutional memory of every shift that came before them, instead of relearning it through downtime.
Paper Logbooks vs Analytics-Ready Shift Data: What Plant Leaders Are Missing
The cost of paper-based or unstructured shift logging is rarely visible in line items — it shows up as decisions made on incomplete data, KPI reports that everyone agrees are "not quite right," and improvement programs that never quite move the needle. The following comparison shows what analytics-ready shift data unlocks. Book a Demo to see iFactory's Shift Logbook applied to your specific KPI gaps.
| Analytics Capability | Paper or Unstructured Logs | iFactory Shift Logbook Analytics | KPI Impact |
|---|---|---|---|
| OEE Component Visibility | OEE calculated from MES counts only; loss reasons absent | Availability, performance, quality losses linked to specific shift-logged root causes | Targeted OEE improvement |
| Downtime Root Cause | Generic codes entered hours after event with low accuracy | Root cause captured at point of occurrence with operator context | 5x faster diagnosis |
| Cross-Shift Comparison | Manual reconciliation at month-end with inconsistent categories | Real-time shift, line, and operator benchmarking dashboards | Performance variance reduction |
| Quality Deviation Tracking | Paper deviation logs reviewed weekly; lot linkage often missing | Structured deviation entries linked to lots, suppliers, and equipment | Scrap and rework reduction |
| Pattern Detection | Recurring issues invisible until they cause major incident | AI surfaces recurring patterns across shifts in days, not months | Earlier intervention windows |
| Best-Practice Capture | Tribal knowledge lost at retirement or shift change | Successful corrective actions captured and propagated across shifts | Operator onboarding speed |
| Compliance Documentation | Manual transcription for audits with attribution gaps | Immutable digital records with e-signatures and ALCOA+ alignment | Audit-ready in seconds |
How iFactory Turns Shift Logbook Data Into a Production Intelligence Layer
Manufacturing analytics only delivers measurable KPI improvement when the underlying data is captured at the point of occurrence, structured consistently, and integrated with existing operational systems. iFactory's deployment model follows a four-stage path that the most successful manufacturing analytics programs share — connect data first, deploy analytics second, validate against actual operating conditions third, scale across the asset fleet fourth.
Shift Logbook Analytics in Action: Use Cases Driving Measurable KPI Improvement
The following outcomes reflect documented patterns from digital shift logbook deployments where structured shift data is now driving plant-level decision making across food and beverage, pharmaceutical, chemical, and discrete manufacturing operations.
A discrete manufacturing plant running 14 production lines was tracking OEE at 62% with no clear improvement pathway — monthly OEE reports showed availability losses but downtime reason coding from paper logs was too inconsistent for meaningful Pareto analysis. After deploying iFactory's Shift Logbook with structured root cause codes captured at the point of downtime, the analytics layer surfaced that 41% of availability losses across three lines traced to two specific changeover sequences. Targeted SMED improvements driven by the analytics raised OEE from 62% to 71% within six months. Book a Demo to see how this applies to your OEE program.
A pharmaceutical site was experiencing intermittent batch quality holds tied to viscosity variation in a critical raw material, but the connection to specific supplier lots was lost in paper logbook entries with inconsistent terminology. After iFactory's Shift Logbook was deployed with structured deviation categories and lot ID capture, pattern analytics flagged a 12% increase in viscosity deviations correlated with one supplier's process change. Procurement engaged the supplier with data within two weeks instead of the typical 6 to 10 week paper-based lag, reducing annual quality hold costs by $1.8M.
A food and beverage plant running three rotating shifts had a persistent 14% throughput variance between best and worst performing shifts, attributed broadly to "operator experience" without specifics. iFactory's shift analytics revealed that the variance traced to three specific procedural differences in changeover sequencing that one shift had developed informally. Those practices were captured as structured action codes and propagated to all shifts through the digital logbook, compressing shift-to-shift variance to 4% and lifting weekly throughput by 9%.
A continuous chemical process plant was managing equipment health through scheduled inspections and vibration data alone. Operator observations of minor leaks, unusual noises, and temperature variances were recorded in shift logs but never connected to maintenance planning. After iFactory's Shift Logbook flowed structured observation data into the predictive maintenance layer, the analytics engine identified that three of four major pump failures in the prior year had clustered shift-logged warnings 6 to 14 days in advance. Maintenance now triggers on observation clusters as well as vibration thresholds, eliminating two unplanned shutdowns valued at $640K combined in the first nine months.
Manufacturing Analytics KPIs Powered by Shift Logbook Data
The most impactful manufacturing KPIs are not the ones in the monthly executive deck — they are the ones that connect plant-floor reality to business outcomes. iFactory's Shift Logbook feeds the following ISO 22400-aligned KPIs with structured data captured at the point of operation, eliminating the manual reconciliation and category drift that undermines most KPI programs.
| KPI Category | Specific KPI | Shift Logbook Data Contribution | Decision Use |
|---|---|---|---|
| Equipment Effectiveness | OEE (Availability × Performance × Quality) | Downtime root cause codes, micro-stoppage notes, quality deviation entries | Targeted improvement project selection |
| Downtime | MTBF and MTTR | Failure event timestamps, repair action codes, root cause attribution | Maintenance strategy refinement |
| Quality | First-Pass Yield and Scrap Rate | Quality deviation entries linked to lots, equipment, and operators | Root cause investigation prioritization |
| Throughput | Parts per shift and cycle time variance | Shift-level throughput context with operator and changeover notes | Shift benchmarking and best-practice capture |
| Changeover | Average and worst-case changeover duration | Structured changeover start/end markers with deviation notes | SMED program targeting |
| Compliance | Audit response time and deviation closure rate | Immutable timestamped entries with e-signatures and ALCOA+ trail | Regulatory and customer audit readiness |
| Workforce | Handover compliance and open issue closure | Issue carry-forward records with ownership and resolution timestamps | Shift leadership accountability |
Expert Perspective: Why KPI Reports Without Shift Context Don't Drive Improvement
The gap between what the KPI dashboard says and what the shift supervisor knows is the single largest blocker to manufacturing improvement programs. Most plants are not short on data — they are short on the contextual layer that makes the data interpretable. When OEE drops 4 points week over week, the dashboard tells you availability is the driver. The shift logbook tells you that a specific changeover sequence on third shift failed three times because a fixture was out of calibration after a maintenance event nobody flagged. Without that second layer, the analytics produce reports that everyone agrees are "interesting" and that nobody acts on. The plants making real progress on OEE, scrap, and downtime KPIs in 2025 are not the ones with the most sophisticated dashboards — they are the ones who put structured shift data into the same analytics layer as their sensor and MES data and act on what the combination reveals.
Conclusion: Shift Logbook Data Is the Missing Layer in Your Analytics Stack
The manufacturers driving measurable KPI improvement in 2025 are not the ones with the largest analytics budgets — they are the ones who recognized that the most valuable data in the plant is not in the SCADA historian or the MES database. It is in what operators see, decide, and act on every shift. Until that data is captured in structured form and connected to the analytics layer, every dashboard tells half the story, every report drives general conversation rather than specific action, and every improvement program runs slower than it should.
iFactory's Shift Logbook delivers the specific capabilities required to close that gap: structured capture at the point of occurrence, direct integration with SCADA, MES, ERP, and BI platforms, real-time KPI dashboards aligned with ISO 22400 definitions, AI pattern detection across months of shift data, and full ALCOA+ compliance documentation. Cloud-based deployment means the platform goes live in 1 to 2 weeks with no on-premise infrastructure required, and measurable analytics outputs begin within the first month of operation. Book a Demo with iFactory to see how shift logbook analytics maps to your current KPI program.
Frequently Asked Questions
MES captures machine-level production counts, cycle times, and downtime codes — the what and how much. Shift logbook data captures the operator and supervisor context — the why behind deviations, what action was taken, what was handed over to the next shift. Analytics built only on MES data describes symptoms; analytics that combines MES with structured shift data diagnoses root causes.
Yes. Structured shift data flows through API connectors into Power BI, Tableau, and other BI platforms, and into SAP, Oracle, and major MES systems. iFactory also provides built-in dashboards for OEE, downtime Pareto, shift benchmarking, and quality deviation tracking that go live with no additional BI development required.
OEE component breakdown, downtime root cause Pareto, and shift-to-shift performance variance typically show measurable improvement within 60 to 90 days of deployment. Predictive maintenance and quality deviation pattern detection follow as the pattern detection layer accumulates sufficient structured shift history — typically 90 to 120 days.
Yes. iFactory's analytics layer is built on ISO 22400-aligned KPI definitions for OEE, MTBF, MTTR, first-pass yield, and throughput, ensuring consistent interpretation across lines, plants, and reporting periods. ALCOA+ data integrity requirements are satisfied through immutable digital records with e-signatures and full user attribution.
iFactory typically deploys in 1 to 2 weeks per site with no on-premise infrastructure required. Day 1 benefits show up as faster shift handovers and structured data capture. Within 30 days, OEE root cause Pareto analytics surface targeted improvement opportunities. Full ROI on platform investment typically lands at 4 to 6 months through downtime reduction, administrative time savings, and KPI improvement.