A spinning supervisor notices motor temperature creeping up on Ring Frame 12 at 2:15 AM. She jots it down in the paper logbook. By 6:00 AM when the next shift arrives, the note is buried under nine other entries — no one checks the temperature trend. By 9:30 AM the motor bearing fails. Downtime: 6 hours. Lost production: 3,800 kg of yarn. With real-time visibility in a digital shift logbook, that same temperature spike triggers an instant alert to the maintenance team, a timestamped escalation, and a predictive work order — before the bearing even shows stress.
DIGITAL SHIFT LOGBOOK · REAL-TIME VISIBILITY GUIDE FOR MANUFACTURERS
Real-Time Visibility: The Shift Intelligence Layer Your Plant Is Missing
When every shift event — machine alarms, quality deviations, operator observations — becomes visible the moment it is logged, your entire plant operates on shared intelligence. Not yesterday's data. Not last handover's notes. Now.
4.5 hrs
avg. delay with paper logbooks before escalation
35 sec
avg. escalation time with real-time digital logbook
58%
of critical events missed without real-time alerts
3.4×
faster incident resolution with live shift data
What Is Real-Time Visibility in a Shift Logbook?
Real-time visibility in a shift logbook means every event logged by any operator — on any shift, in any department — is immediately visible to supervisors, maintenance planners, quality teamsand plant managers the moment it is submitted. No waiting for the handover meeting. No filtering through 14 pages of handwritten notes. No "I thought someone else was handling it."
In a textile plant running three shifts across spinning, weaving, dyeing, and finishing, real-time visibility is the difference between acting on an issue at 2:15 AM — when it is a minor motor temperature alert — and discovering it at 10:00 AM as a full bearing failure and 6-hour production stoppage. A digital shift logbook with live visibility does not just store information. It surfaces, prioritises, and routes the right information to the right person at the right moment.
True real-time shift visibility means automatic escalations, live OEE feeds, cross-shift pattern detection, and AI-generated alerts — all triggered the instant an operator logs an observation, a SCADA sensor threshold is crossed, or a quality deviation is flagged on the dye line or the weave room floor.
The Cost of Delayed Shift Visibility in Textile Manufacturing
Every hour a critical shift event sits unread in a paper logbook — or in an un-escalated digital form that no one has checked — costs your plant money. In textile manufacturing, where process continuity drives margin, delayed visibility has four distinct failure modes:
⏳
Cascade Failures from Missed Alerts
A yarn break frequency spike on Ring Frame 7 logged at 11 PM does not reach the maintenance team until 7 AM. By then, the ring travellers have worn to the point of requiring full replacement — not just adjustment. Downtime: 6 hours instead of 45 minutes.
?
Quality Batches Ruined by Invisible Drift
A pH deviation in the dyeing bath logged by the night operator never surfaces to the quality supervisor. The morning shift runs three more batches on the same parameters. Colour delta: 2.1 ΔE. Result: 4,200 metres of off-shade fabric rejected at inspection.
?
Compliance Blind Spots
GOTS, OEKO-TEX, and buyer audits require timestamped, traceable process records. When shift events live in paper logbooks or siloed digital forms, audit preparation takes 3 days — and gaps in the record create compliance risk that can cost export orders.
?
Reactive Maintenance Cycles
Without real-time visibility across shifts, maintenance teams only see individual events — not patterns. Ring Frame 7 had 14 bearing-related observations across three shifts. Each shift supervisor saw their own two or three entries. No one saw all fourteen until the bearing failed.
Recognise any of these failure modes in your plant? Book a demo and see how iFactory's real-time visibility layer surfaces exactly these issues — before they become production losses.
6 Dimensions of Real-Time Shift Visibility
Real-time visibility in a shift logbook is not a single feature — it is a stack of connected capabilities that together give every stakeholder a live, accurate picture of plant operations at any moment. iFactory's digital shift logbook delivers visibility across six dimensions simultaneously.
1
Asset-Level Live Status Dashboard
Every logged event is linked to a specific asset — Loom 12, Ring Frame 7, Dye Vat B3. Supervisors see a live asset health map: green, amber, red. Any asset with an open, unacknowledged event is flagged immediately on the floor plan dashboard — visible from any device.
Asset heat map
Live status indicators
Unacknowledged alerts
2
Cross-Shift AI Pattern Detection
AI reads across all entries from all shifts simultaneously. When Ring Frame 7 logs its third yarn break in 18 hours — logged by three different operators on three different shifts — the system flags it as a pattern and escalates it to maintenance automatically. No single operator needs to spot the trend.
Multi-shift analysis
Frequency detection
Auto-escalation
3
Live OEE and Production Feed
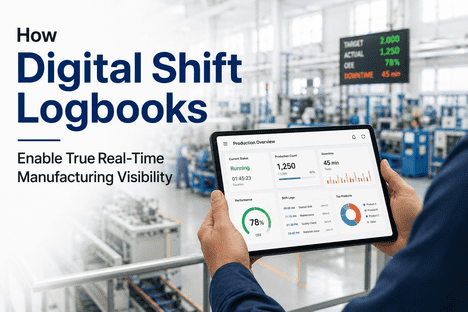
Every downtime reason logged, every speed reduction, every yield deviation feeds the OEE dashboard in real time — without a separate data entry step. Plant managers see live efficiency numbers, not yesterday's report. Shift supervisors see their section's performance as it happens — per loom, per ring frame, per dye batch.
Live OEE display
Downtime trending
No double-entry
4
Instant Role-Based Escalation
Threshold-based escalation routes critical events to the correct role within seconds — not when someone happens to read the logbook. A motor overload alert goes to the electrical maintenance team; a colour deviation goes to the dyeing supervisor and quality manager simultaneously. Configurable per event type and severity level.
Role-based routing
SMS/email/app push
SLA enforcement
5
Quality Parameter Live Monitoring
Process parameters — dyeing bath pH, warp tension, ring frame speed, sizing recipe concentration, loom rpm — are logged against batches and monitored against SPC limits in real time. A drift triggers an immediate alert before the batch is committed. Not at inspection — at the point of deviation.
SPC live charts
Batch traceability
Drift alerts
6
Smart Shift Handover Intelligence
At shift changeover, real-time visibility does not pause. The incoming supervisor receives an AI-generated brief ranked by priority — open issues, ongoing escalations, machine status, quality holds — before the shift even starts. The handover is not a verbal briefing; it is a live, structured data transfer with accountability confirmation.
Auto-brief generation
Priority ranking
Confirmation receipt
Want to see all six dimensions working together? Book a demo — we will walk through a live shift scenario using your exact asset types and alert conditions.
SEE REAL-TIME VISIBILITY IN ACTION
Watch a Live Shift Alert Reach the Right Person in Under 60 Seconds
See how iFactory captures a loom alarm, classifies it by severity, and routes it to the correct maintenance technician — with full shift context attached — before the operator even steps away from the machine.
Real-Time Visibility vs. Passive Digital Logging: The Difference That Matters
Not all digital shift logging tools provide genuine real-time visibility. Many are digital notepads — they capture events but do not surface, route, or act on them. Here is what separates passive digital logging from active real-time shift intelligence.
PASSIVE DIGITAL LOGGING — WHAT YOU STILL MISS
Events captured but supervisor must manually check to see them
No cross-shift pattern detection — each shift sees only its own data
Escalation depends entirely on human review timing
Quality deviations visible at end-of-shift report, not mid-process
OEE updated manually or batch-synced — always hours behind
Handover summary written by the outgoing supervisor — incomplete by design
IFACTORY REAL-TIME VISIBILITY — WHAT CHANGES
Every event surfaces to relevant roles via push alert sub-second
AI reads all shifts simultaneously — patterns flagged automatically
Threshold-based escalation fires within 60 seconds — no human review
SPC alerts trigger mid-batch, before quality is committed
OEE live feed updates in real time from every logged shift event
AI-generated handover brief — priority-ranked, pushed before shift starts
What Real-Time Visibility Delivers: The Numbers
The impact of real-time shift visibility shows up across multiple KPIs — and it happens fast. These are the metrics textile and process manufacturers report after enabling live shift intelligence through iFactory.
Mean Time to Escalate Critical Events
-99%
Shift Issues Caught Before Cascade Failure
+225%
Fabric Quality Rejection Rate
-40%
Unplanned Maintenance Downtime
-61%
Supervisor Time Spent Chasing Shift Updates
-86%
Overall Equipment Effectiveness (OEE)
+19%
Want to model what these numbers mean for your plant? Book a demo and our team will build an ROI estimate specific to your shift structure, asset count, and current defect rates.
How Real-Time Visibility Works Across Your Textile Plant
Here is how the same shift events play out differently — with and without real-time visibility — across the specific scenarios your supervisors face every week in spinning, weaving, dyeing, and finishing.
Scroll horizontally to view all details
Recognise your plant in this table? Book a demo — we will show you exactly how each of these scenarios plays out in iFactory using your specific asset types and shift structure.
What to Look for When Evaluating Real-Time Visibility in Shift Logbook Platforms
Many digital shift logging tools claim real-time visibility — but the architecture underneath determines whether you get passive data storage or active shift intelligence. Here is a capability-level evaluation framework for any platform you are assessing.
Evaluating shift logbook platforms for your plant? Book a demo and get a side-by-side comparison built for your specific requirements — loom monitoring, spinning frames, dye lines, or any process equipment.
Frequently Asked Questions
How quickly does iFactory surface a logged event to the relevant supervisor?
The moment an operator submits a log entry, it is processed and visible to all authorised roles in under one second. For threshold-triggered escalations — where a sensor reading or manually entered value exceeds a configured limit — the alert is routed and delivered via push notification, SMS, or email within 60 seconds. Critical safety events have mandatory acknowledgement timelines enforced by the system, with escalation to the next level if not acknowledged on time.
Does real-time visibility work in areas with poor connectivity — like the middle of a weaving shed?
Yes. iFactory supports full offline event logging — operators capture events in areas with no signal, and data syncs automatically the moment the device reconnects. For production environments where connectivity is consistently weak, iFactory also supports edge caching and local LAN sync options. Escalation alerts are queued and sent as soon as network is available. No data is lost in an offline window.
Can different roles see different levels of visibility — or does everyone see everything?
Visibility is role-based and fully configurable. Machine operators see their section's live status. Shift supervisors see their department's full shift picture. Maintenance planners see asset events and work order status. Quality managers see defect and SPC alerts. Plant managers get aggregated OEE and critical alert dashboards. Each role sees exactly what they need — not an overwhelming data dump from the entire plant. Data sensitivity rules can restrict certain entries to specific roles only.
How does the AI cross-shift pattern detection actually work for textile assets?
iFactory's AI reads every event logged across all shifts for a given asset and classifies patterns based on frequency, severity, and event type. If Ring Frame 7 has three vibration observations logged across three consecutive shifts by three different operators, the AI flags it as a recurring pattern and escalates it to maintenance with the full event history attached — even though no single operator saw more than one or two entries. The AI is trained on your historical maintenance records and failure modes during onboarding, so it understands your specific asset behaviour from day one of go-live.
Does iFactory integrate with SCADA and MES for real-time sensor data — or is it only operator-logged events?
iFactory connects bi-directionally with SCADA, DCS, MES, loom monitoring systems, and IoT edge devices. Machine alarms, sensor threshold crossings, loom stop codes, and automated OEE data are pulled in directly — operators do not need to manually log what sensors already capture. The combination of automated sensor data and operator observations gives you the most complete real-time picture of shift operations possible. Supported integrations include SAP, Oracle, Infor, and most major SCADA platforms.
How long does it take to get real-time visibility live across our plant?
Most textile plants have basic real-time visibility running within 2 weeks — asset registry imported, mobile app deployed to the pilot team, live dashboard visible to supervisors, and threshold escalation rules configured. Full implementation with SCADA or MES integration, AI training on historical data, and all alert routing rules finalised typically takes 4 weeks for a single plant. Multi-site rollouts across multiple plants run 6–8 weeks depending on system complexity. Dedicated implementation support and a named customer success manager are included for 90 days post-go-live.
READY FOR REAL-TIME SHIFT INTELLIGENCE?
Stop Managing Your Plant on Delayed, Incomplete Shift Data
Every minute a critical shift event sits unread in a logbook, your plant is operating blind. iFactory gives every supervisor, technician, and plant manager a live, structured view of every shift event — in real time, on any device, from any department.