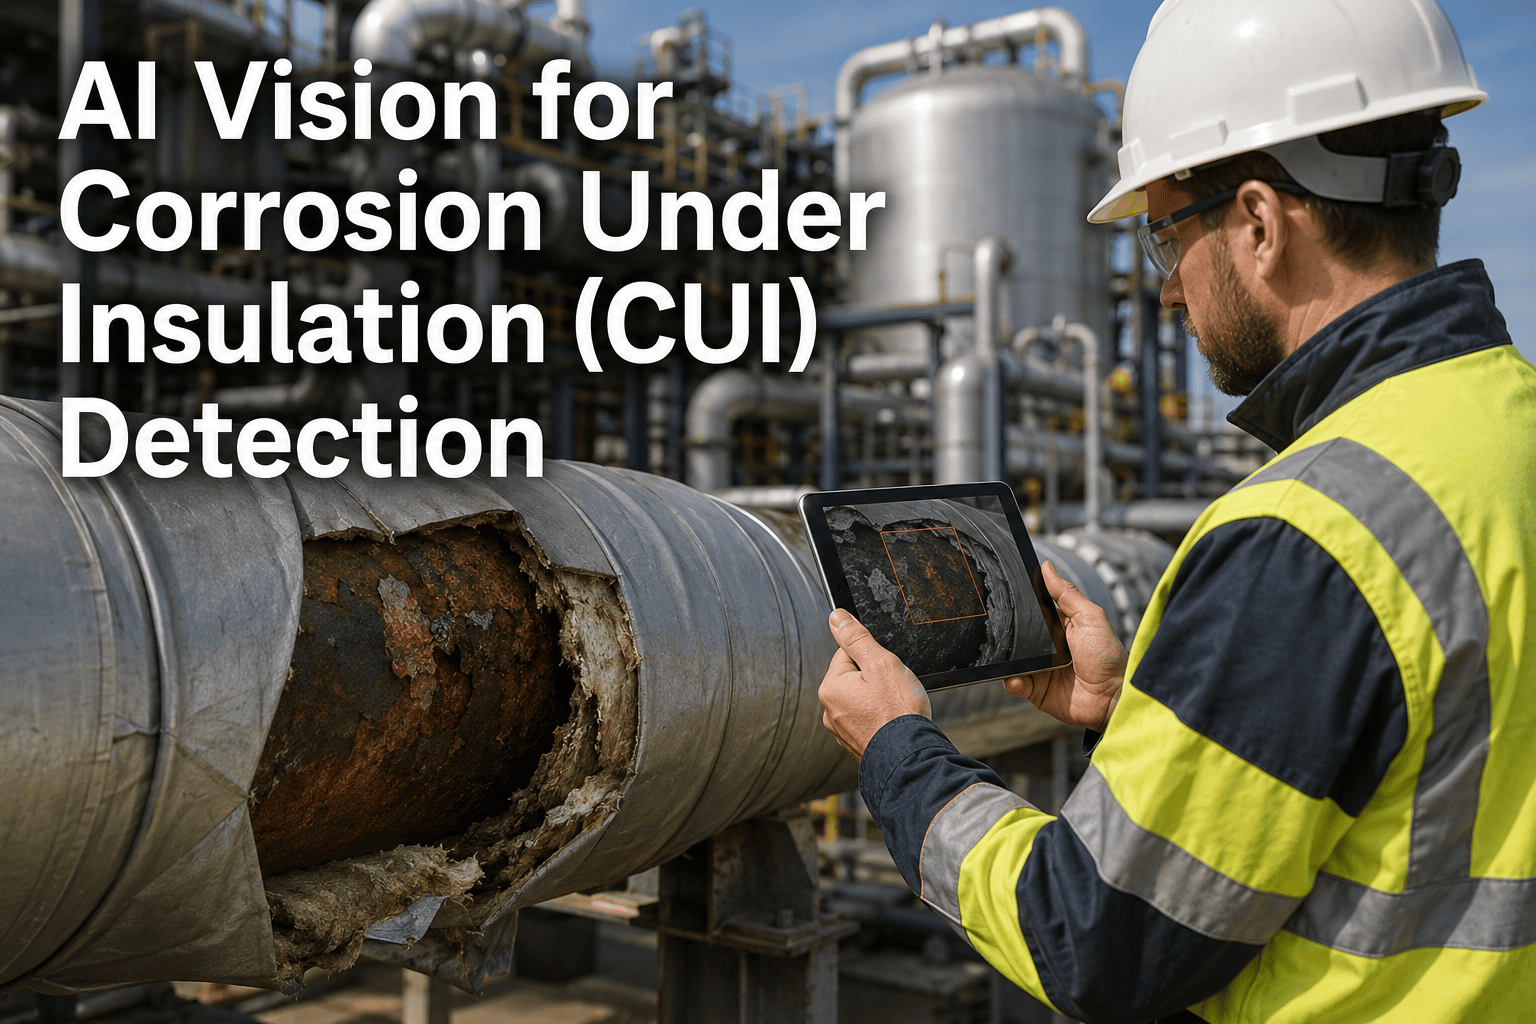
Corrosion under insulation is the most expensive and insidious form of degradation in process plants because it is completely hidden. Water enters through damaged weatherproofing, collects against the pipe or vessel wall, and corrodes the steel from the outside in. By the time a leak appears or insulation is removed for a scheduled check, the wall thickness can be reduced to a fraction of its original specification, forcing emergency repairs, unplanned shutdowns, and in the worst cases, catastrophic failure. Traditional inspection relies on removing insulation at random or predetermined intervals, which means inspectors examine only a small percentage of the asset surface and frequently miss the exact spots where moisture is trapped. AI-enhanced thermal cameras detect the temperature anomalies caused by wet insulation without removing the metal jacket, scanning 100 percent of the visible surface and flagging the specific locations where water has penetrated, enabling targeted, evidence-based insulation removal instead of blind guessing.
AI Thermal CUI Detection
AI Vision for Corrosion Under Insulation (CUI) Detection
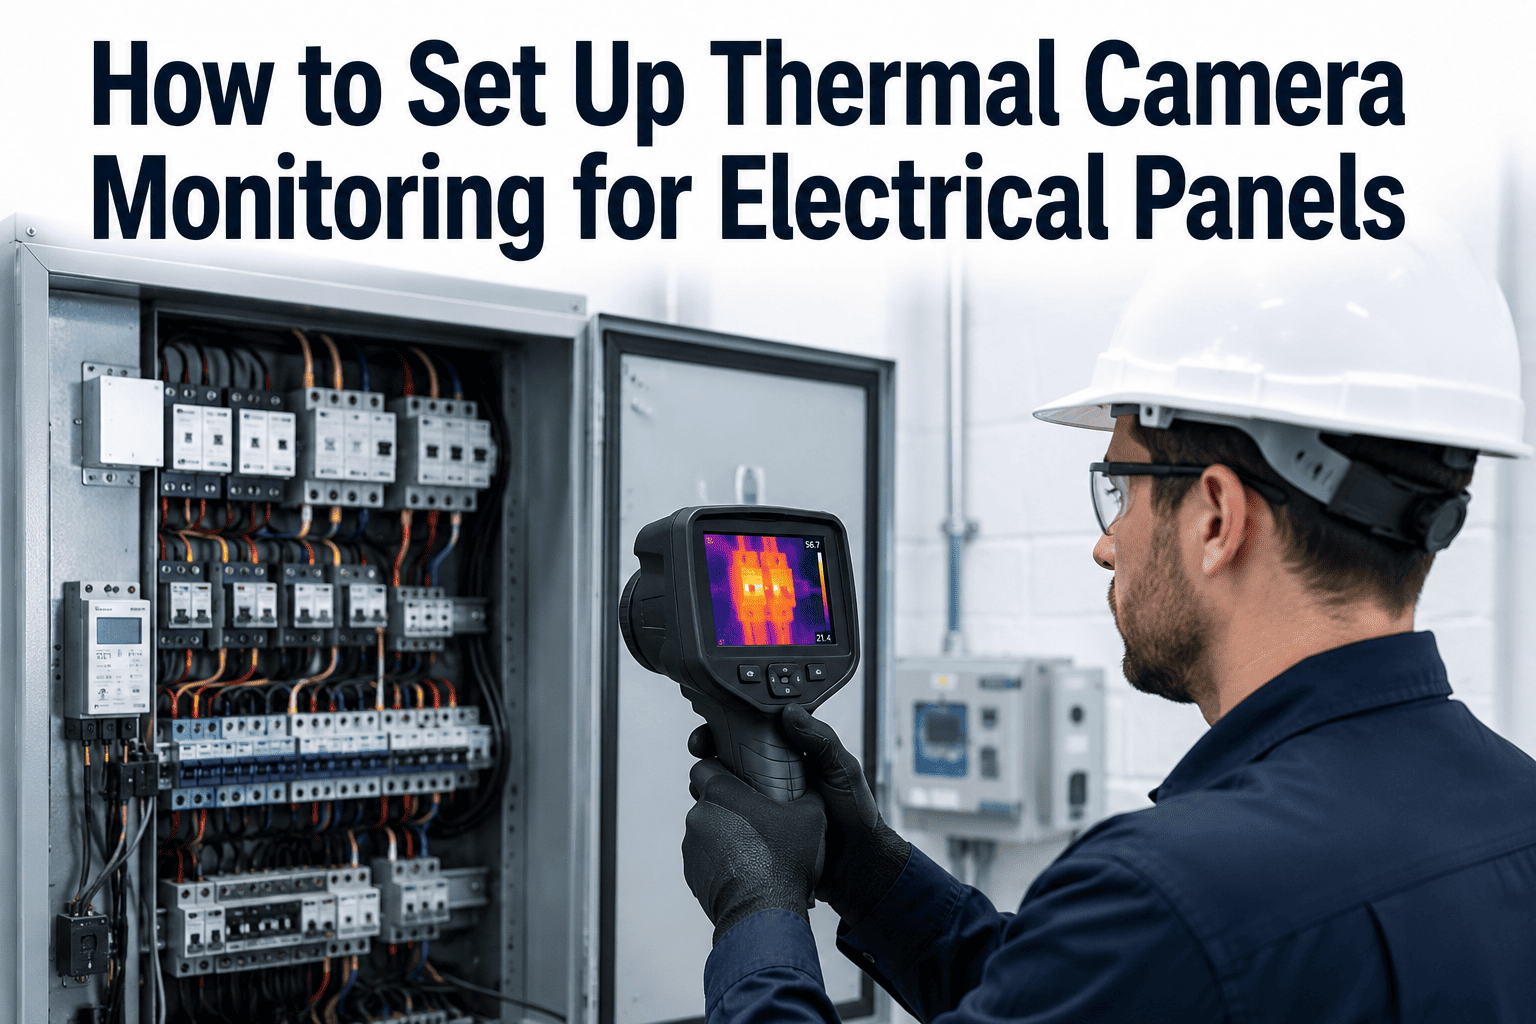
Thermal AI cameras detect moisture penetration and temperature anomalies beneath insulation on pipes and vessels — scanning 100% of the surface without removing lagging, and pinpointing exactly where to inspect.
60%
Of process plant pipe leaks caused by CUI
100%
Surface scanned non-destructively
10-15%
Typical coverage with random removal
Zero
Insulation removed for initial screening
The Five Stages of Corrosion Under Insulation
CUI does not happen overnight. It follows a predictable progression from initial water entry to ultimate failure, and the window for detection narrows as the degradation advances. Understanding this progression makes clear why early detection — before wall loss becomes critical — is the only strategy that actually prevents failures rather than just finding them. The visual below maps the progression from a sealed system to a ruptured pipe, showing where thermal AI intervenes to break the chain.
1
Water Entry
Moisture penetrates through damaged weatherproofing, unsealed terminations, or mechanical damage to the outer jacket
No Corrosion Yet
2
Insulation Saturation
Water is absorbed into the insulation material, creating a localized wet zone that alters the thermal conductivity of the lagging
Thermal AI Detects Anomaly
3
Corrosion Initiation
Wet insulation holds moisture against the steel surface, initiating oxidation or chloride-induced stress corrosion cracking under the lagging
Wall Loss Begins
4
Significant Wall Loss
Corrosion progresses, often localized in pitting form, reducing wall thickness below minimum required by code. Still invisible externally
Critical Thinning
5
Failure
Remaining wall thickness cannot withstand operating pressure, resulting in leak, rupture, or catastrophic release of process fluid
Leak or Rupture
Why Random Insulation Removal Is Structurally Inadequate
The traditional approach to CUI inspection involves selecting removal points based on statistical sampling, visual observation of jacket condition, or a fixed percentage of the insulated length — typically 10 to 15 percent of the asset. This means 85 to 90 percent of the insulated surface is never examined during a turnaround. Since CUI is highly localized — a single breach in the weatherproofing can create a corrosion cell covering just a few square feet — random sampling has a high probability of missing the exact locations where damage is occurring. The consequence is that plants remove and replace insulation on 15 percent of their piping, spend millions on the labor and materials, and still experience CUI failures on the 85 percent they did not inspect. AI thermal scanning inverts this model by examining 100 percent of the surface first and then directing removal only to the specific locations flagged as suspicious.
Random Removal
Blind Sampling
Inspects only 10-15% of the insulated surface per turnaround cycle
Destructive process — insulation must be cut away, inspected, and replaced even if no damage is found
High probability of missing localized CUI that exists between sample points
Cost scales with the length of pipe removed, not with the amount of damage found
No residual data — once insulation is replaced, there is no record of the scan for future comparison
AI Thermal Scanning
Targeted Detection
Scans 100% of the visible insulated surface from the exterior, non-destructively
Insulation is removed only at AI-flagged locations, minimizing unnecessary destruction
Detects moisture anomalies at the exact point of water penetration, not random intervals
Cost scales with the number of anomalies found, which is typically a small fraction of total length
Full thermal record retained for baseline comparison across successive inspection cycles
The Thermal Physics: How Wet Insulation Becomes Visible
The detection principle relies on a physical property that changes when insulation gets wet. Dry insulation is a poor thermal conductor — it traps air and acts as a barrier between the process temperature and the ambient environment. When water enters the insulation, it replaces the trapped air, and because water has roughly 20 times the thermal conductivity of still air, the wet zone conducts heat much more effectively. On a thermal camera, this creates a visible temperature difference on the outer surface of the metal jacket. For hot pipes, the wet area appears cooler because heat is escaping faster through the wet insulation. For cold pipes, the wet area appears warmer because ambient heat is penetrating faster. AI vision is trained to recognize these thermal patterns, distinguishing true moisture anomalies from the normal temperature variations caused by supports, valves, ambient wind, and solar loading.
Thermal Signature of Wet vs Dry Insulation
Dry Insulation
Thermal conductivityLow
Surface temperatureUniform
Thermal camera viewConsistent pattern
AI classificationNormal baseline
Wet Insulation (CUI Risk)
Thermal conductivity20x higher
Surface temperatureAnomalous spot
Thermal camera viewVisible hotspot/coldspot
AI classificationMoisture anomaly flagged
Hot process: wet zone appears cooler on surface. Cold process: wet zone appears warmer on surface. AI models are trained for both operating regimes.
The AI Thermal Analysis Pipeline
Raw thermal video contains temperature variations from many sources — structural supports, pipe bends, changes in insulation thickness, ambient conditions, and solar radiation. A human operator looking at a thermal feed cannot reliably distinguish moisture-induced anomalies from this background noise across miles of piping. The AI pipeline is designed to filter out known non-defect temperature patterns and isolate only the signatures that match the profile of moisture penetration beneath insulation.
From Thermal Feed to Moisture Map
1
Capture
Radiometric thermal camera records temperature data across the insulated pipe surface, outputting a calibrated thermal video stream
2
Filter
AI model suppresses temperature patterns from known non-defect sources — supports, valves, thickness changes, and solar effects
3
Detect
Anomaly detection network identifies localized temperature deviations that match the thermal profile of wet insulation for the specific process temperature
4
Score
Each anomaly receives a confidence score based on pattern strength, size, and context, ranked by probability of actual moisture presence
5
Report
Flagged locations are mapped to pipe isometric drawings with thermal images, GPS coordinates, and removal priority recommendations
Every foot of insulation you remove without finding damage is wasted labor, wasted material, and a new joint that can leak in the future. Every foot you do not remove might be the foot hiding a 70 percent wall loss. AI thermal scanning gives you the information to make that decision precisely instead of guessing.
Book a 30-minute demo to see AI analyze thermal CUI footage.
Risk Prioritization: Where CUI Hits Hardest
Not all insulated assets are equally vulnerable to CUI. The risk is determined by the operating temperature range, the insulation type, the environment, and the condition of the weatherproofing. API RP 583 defines the temperature ranges where CUI is most aggressive, and AI thermal scanning is most valuable when deployed against the highest-risk categories first. The matrix below maps CUI susceptibility by temperature range and asset criticality, showing where thermal AI delivers the highest return on inspection investment.
CUI Risk Matrix by Temperature and Criticality
| Temperature Range |
CUI Susceptibility |
Thermal AI Value |
Recommended Action |
| -4C to 60C (25F to 140F) |
Very High |
Critical |
Full thermal scan — highest moisture intrusion risk zone |
| 60C to 120C (140F to 250F) |
High |
Critical |
Full thermal scan — temperature cycling drives water ingress |
| 120C to 175C (250F to 350F) |
Moderate |
High |
Targeted scan at vulnerable locations — valves, elbows, drains |
| 175C to 260C (350F to 500F) |
Lower |
Moderate |
Scan during outages when surface temp drops into detectable range |
| Above 260C (Above 500F) |
Minimal |
Low |
CUI unlikely — moisture evaporates before contacting steel |
The highest CUI risk zone (-4C to 120C) is also where thermal AI is most effective, because the temperature differential between wet and dry insulation is largest and most detectable.
Alignment with API RP 583 Inspection Methods
API RP 583 provides guidance on inspection techniques for CUI, and thermal imaging is explicitly recognized as a screening method. AI enhancement does not change the fundamental compliance framework — it dramatically improves the effectiveness of the thermal screening method that the standard already endorses. The table below maps how AI thermal scanning aligns with specific API RP 583 recommendations and the practical advantages it provides over unassisted thermal inspection.
API RP 583 Section 7.2
Visual and Thermal Screening of Insulated Equipment
AI automates the thermal screening interpretation, removing operator dependency and providing a permanent, auditable record of the scan with every anomaly location documented
API RP 583 Section 8
Condition Monitoring and Inspection Planning
Thermal AI data feeds directly into risk-based inspection planning, prioritizing removal locations by anomaly severity rather than arbitrary percentage-based sampling
API RP 583 Section 9
Inspection of Damaged or Missing Weatherproofing
AI scans the full length of weatherproofing to detect subtle damage, discoloration, and joint separation that indicate water ingress paths before CUI initiates
API 580 / 581 RBI Framework
Risk-Based Inspection for Process Equipment
Quantified thermal anomaly data improves the probability of failure assessment for CUI damage mechanisms, producing more accurate risk rankings
Frequently Asked Questions
Can thermal imaging actually see through metal jacketing to find wet insulation?
Thermal imaging does not see through the metal jacket in the optical sense. What it detects is the surface temperature effect caused by the wet insulation behind the jacket. When insulation becomes saturated with water, its thermal conductivity increases dramatically, which changes the rate at which heat flows from the process pipe to the outer surface. The metal jacket, being thin and highly conductive, quickly equilibrates to the temperature of the insulation surface beneath it. The thermal camera reads this surface temperature, and the AI model identifies the localized spots where the temperature deviates from the expected pattern of dry insulation. The metal jacket actually helps by providing a smooth, uniform surface that eliminates the texture variations that complicate direct insulation surface readings.
See this detection process demonstrated on real CUI thermal footage.
How does AI distinguish a moisture anomaly from a normal temperature variation like a pipe support?
This is the core value of AI over a human operator looking at a thermal screen. Unassisted thermal inspection produces many false positives because pipe supports, valves, elbows, thickness changes, and even wind direction create temperature variations that look similar to moisture on the thermal display. An experienced operator learns to filter some of these out mentally, but the process is slow, subjective, and inconsistent across different operators and different days. The AI model is trained on thousands of thermal images of insulated piping that include all of these non-defect features alongside confirmed moisture anomalies. It learns the spatial patterns, shapes, and thermal gradients that distinguish a moisture plume from a support shadow or a valve body heat sink. The model applies this learned filter consistently across every foot of pipe, eliminating the guesswork and reducing false positive rates to a manageable level.
Ask our engineers about false positive performance in your operating environment.
Does thermal AI replace the need for ultrasonic thickness testing?
No. Thermal AI is a screening tool that identifies where moisture has penetrated the insulation, which indicates locations where corrosion may be occurring. It does not measure the actual remaining wall thickness of the pipe. Once the AI flags a moisture anomaly, the standard practice is to remove the insulation at that specific location and perform ultrasonic thickness testing or other NDT methods to quantify the actual wall loss. The value of AI thermal screening is that it directs the ultrasonic testing to the exact spots where damage is most likely, eliminating the random removal approach and ensuring that inspection resources are spent on the highest-risk locations. In effect, AI thermal scanning and ultrasonic testing are complementary — thermal finds where to look, and ultrasonic confirms what is there.
What operating conditions are required for an effective thermal CUI scan?
Thermal CUI detection requires a temperature differential between the process fluid and the ambient environment — without this differential, there is no thermal pattern for the camera to read. For hot service, the pipe must be operating at a temperature sufficiently above ambient to create a measurable surface temperature difference between wet and dry insulation, which generally means above 40 to 50 degrees Celsius above ambient. For cold cryogenic service, the pipe must be below ambient. Scans are most effective during steady-state operation when temperatures have stabilized, and least effective during transient conditions like startup, shutdown, or rapid ambient temperature changes. Wind, rain, and direct sunlight can complicate the thermal pattern, but the AI model is specifically trained to account for these environmental factors. Nighttime scanning is often preferred for outdoor installations to eliminate solar interference entirely.
How is the thermal survey data integrated into our asset integrity management system?
The output of an AI thermal CUI survey is a structured dataset that maps each flagged anomaly to a specific location on the asset — typically referenced by line number, station number, and elevation on the pipe isometric. Each anomaly record includes the thermal image, the temperature differential measured, the confidence score, and the recommended priority for removal and inspection. This dataset is exported in standard formats that integrate with common asset integrity management software like Meridium, HYSYS, or custom ERP systems. The thermal images and anomaly locations are stored as part of the permanent inspection record for that asset, creating a baseline that can be compared against future scans to track whether moisture anomalies are growing, shrinking, or stable over time. This historical comparison is a powerful predictive tool that goes beyond what any single-point inspection can provide.
Discuss integration architecture with our team in a demo session.
Stop Removing Insulation That Is Perfectly Dry
See AI Detect Moisture Under Insulation — on Your Thermal Footage
If you have radiometric thermal video from past CUI inspections, bring it to a demo session. We will run the AI anomaly detection pipeline on your footage, show you every moisture signature it identifies, and demonstrate how the results map to your pipe isometrics for targeted removal planning. If you do not have footage yet, we will show you the system operating on representative industrial CUI data so you can evaluate the detection quality before committing to a survey.
100%
Surface scanned non-destructively
Targeted
Removal only at flagged locations
API 583
Aligned screening method
Baseline
Historical comparison across turns