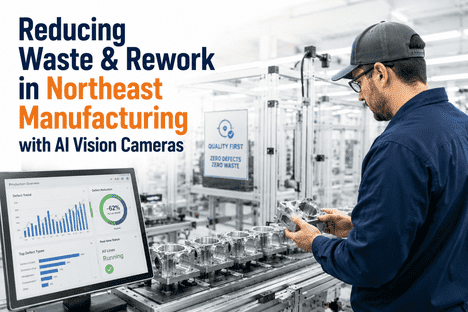
Rework is one of the most financially destructive and operationally invisible cost categories in precision manufacturing. Unlike scrap — which generates a tangible disposal record — rework absorbs direct labor, machine time, consumables, and production capacity while remaining dispersed across shift logs, maintenance records, and labor cost reports that no single quality metric consolidates. For the majority of mid-to-high-volume manufacturers, rework costs represent between 5% and 15% of total production cost, and the structural cause is almost always a detection gap: defects that formed at a specific point in the production process, progressed undetected through multiple value-adding operations, and required correction only after significant cost had already been embedded in each affected unit. This case study documents how a precision components manufacturer supplying automotive and industrial OEM customers deployed iFactory's AI Vision Camera platform across four active production lines and reduced total rework expenditure by 73% within two quarters — through real-time inline defect detection, process correlation analytics that exposed the root causes of each rework category, and automated work order generation that compressed the response window from 12 hours to under 60 seconds. To assess what iFactory's AI Vision Camera platform would deliver against your facility's specific rework profile, Book a Demo with iFactory's industrial analytics team.
73%
Rework rate reduction achieved across all four production lines
$904K
Annual rework cost savings documented in first 12 months
−92%
Reduction in customer quality escapes from 240 ppm to under 18 ppm
5.8 mo
Full platform ROI payback period from deployment date
Is Rework Silently Consuming Your Production Budget?
iFactory's AI Vision Camera platform detects defects at the point of origin — before they advance through value-adding stages and become rework. Real-time visual analytics built for manufacturers who need measurable cost reduction, not just quality reports.
Book a Demo to see live detection on your defect types.
01 / The Facility
Facility Profile: Mid-Volume Precision Components Manufacturer
The manufacturer at the center of this case study produces precision mechanical components for automotive Tier 1 supply and industrial equipment OEM channels. Operating across four dedicated production lines — machining, stamping, assembly, and surface treatment — the plant produces approximately 420,000 components annually across 35 active SKUs, running three shifts six days per week. With OEM quality agreements imposing contract penalties at defect rates above 150 parts per million, and warranty claim averages of $900 per escape event, the financial consequences of quality failures extended well beyond internal rework costs into customer relationship exposure that threatened contract renewals.
Facility TypeIntegrated precision components manufacturing facility — machining, stamping, assembly, and surface treatment lines. Four production lines operating three shifts, six days per week.
Annual OutputApproximately 420,000 components annually across 35 active SKUs. Primary customers in automotive Tier 1 supply and industrial equipment OEM channels.
Quality Model Pre-DeploymentEnd-of-line visual inspection by dedicated QC personnel. Statistical sampling at 10–15% batch coverage. Manual defect logging on paper traveler cards. No real-time inline monitoring or process correlation capability.
Pre-Deployment Rework RateBlended rework rate of 6.8% across all four production lines. Surface treatment and stamping lines at 9.1% and 8.4% respectively — the two highest individual rework cost categories.
Annual Rework CostTotal documented rework expenditure of $1.24 million annually — covering direct rework labor, machine re-run time, material reprocessing cost, and quality escape costs from defects reaching the customer prior to detection.
Inspection TeamEight dedicated QC inspectors across three shifts. End-of-line inspection only — no inline monitoring capability. Zero automated defect classification or process correlation data being generated under prior model.
02 / The Challenge
Why Rework Costs Were Rising Despite an Active Quality Program
The facility's quality program was not absent — it was structurally misaligned with the actual origin of rework cost. Eight trained inspectors, paper traveler cards, and end-of-line sampling at 10–15% coverage represent a meaningful investment in quality infrastructure. But every element of that model operates retrospectively, after defects have already accumulated cost through multiple processing stages. By the time a surface treatment coating irregularity was identified at the end-of-line inspection station, the affected component had already passed through two subsequent operations — absorbing the labor and machine time of each. The rework cost was not simply the correction of one defect; it was the reversal and reprocessing of everything built on top of it before detection occurred.
The sampling gap compounded the structural problem. At 10–15% inspection coverage on a batch of 500 components, only 50 to 75 units received meaningful visual assessment. Of the defective units present within the uninspected 85–90%, a significant proportion advanced to packaging, outbound logistics, and ultimately to the customer — generating warranty claims averaging $900 per escape event, sorting events at the customer's facility, and contract penalty exposure that substantially exceeded the internal rework cost on a per-unit basis.
6.8%
Blended Rework Rate Across All Lines
The facility's blended rework rate of 6.8% was consuming an estimated 28,500 production hours annually in rework cycles — capacity unavailable for productive output during peak-demand windows when the lines were already running at maximum schedule.
10–15%
Inspection Coverage on Prior Sampling Model
Statistical sampling at 10–15% of output meant 85–90% of each production batch advanced to the next stage without meaningful defect assessment — creating a structurally guaranteed quality escape rate regardless of inspector skill or effort level.
$900
Average Warranty Claim Cost Per Escape Event
Defects reaching the customer averaged $900 in direct warranty claim cost before accounting for sorting premiums, premium freight for replacements, and contract penalty clauses triggered at defect rates exceeding 150 ppm under active OEM quality agreements.
12 hrs
Average Lag Between Defect Origin and Detection
Under the paper-based, end-of-line sampling model, the average time between a process deviation generating defective output and a QC inspector identifying the problem was 12 hours — during which the affected process continued running and accumulating rework inventory.
"We had eight inspectors, traveler cards, and a sampling program. By every conventional measure, we had a quality program. What we didn't have was visibility into where defects were actually forming. That gap was costing us $1.24 million a year in rework alone — before a single customer claim."
03 / The Solution
iFactory AI Vision Camera Deployment Across All Four Production Lines
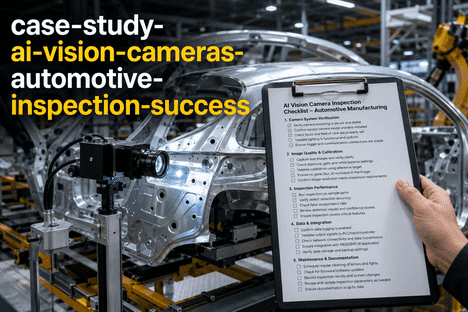
Following evaluation of industrial inspection platforms, the facility selected iFactory's AI Vision Camera system for its ability to deliver 100% inline inspection coverage at full production speed, combined with an analytics layer that links defect data to upstream process parameters in real time. The deployment covered all four production lines simultaneously, with camera positions engineered for each line's specific defect categories, inspection geometry, and production speed. iFactory's edge-native architecture — running on NVIDIA GPU-powered on-premise hardware — delivered sub-50ms detection latency with zero cloud dependency, ensuring no production data left the facility and the system operated without interruption regardless of network conditions.
100% Inline Inspection
AI cameras replaced the 10–15% sampling model with full production coverage at sub-50ms inference latency. Every component, every shift, every surface angle inspected at 99.4% detection accuracy — no sampling gaps, no blind spots.
99.4% detection accuracy
AI Defect Classification
Every detected defect classified by type, severity, and exact surface location with annotated bounding boxes and confidence scores. Distinguishes cosmetic non-conformances from structural defects requiring immediate line intervention.
Severity-scored classification
Process Correlation Analytics
Real-time engine links defect patterns to tool wear cycles, shift timing, material batch IDs, and machine parameter logs — exposing that 71% of stamping rework originated from just three specific die stations.
Root-cause identification
Automated Work Orders
Defect detection triggers automatic work order generation with annotated photographic evidence, asset linkage, and AI-suggested corrective action — synced to the facility CMMS via REST API in under 60 seconds.
Detection to alert in <60 sec
Digital Compliance Records
Every inspection event generates a time-stamped digital record with defect classification, severity score, and annotated photographic evidence — replacing paper traveler cards with a permanent audit-ready quality trail.
100% digital audit trail
CMMS & ERP Integration
Platform integrates with existing CMMS, MES, and ERP systems via OPC-UA, MQTT, and REST API. Works with existing IP cameras via ONVIF/RTSP — no proprietary hardware lock-in required for deployment.
OEM-agnostic integration
Ready to see how iFactory's platform maps to your production line's specific defect types and inspection geometry? Book a Demo and iFactory's team will run a live demonstration on production-representative samples from your environment.
04 / Implementation
From Evaluation to Full Four-Line Coverage in 21 Days
iFactory's structured deployment process delivered live defect detection on the two highest-rework-cost lines within 10 days, and full four-line coverage by Day 21 — with no line stoppages required at any stage of the installation.
Days 1–5
Production Line Audit and Camera Architecture
Full production audit across all four lines — documenting inspection geometry, defect sample libraries from prior rework records, and process parameter data sources per line. Camera mounting positions confirmed for each station with no production interruption. NVIDIA GPU edge device installed and connected to facility network. CMMS integration via REST API initiated on Day 3.
Days 6–10
Camera Installation and Live Detection on Priority Lines
Industrial cameras and precision lighting arrays installed on the stamping and surface treatment lines first — the two highest rework cost operations. AI detection models pre-trained on facility-supplied defect samples began live classification within 48 hours of camera installation. First real-time defect alerts generated on Day 8, with accuracy validated against the QC defect sample library.
Days 11–17
Machining and Assembly Line Integration
Camera deployment extended to machining and assembly lines. Process correlation engine activated — linking defect occurrence data to upstream tool wear cycles, machine parameter logs, and material batch identifiers across all four lines. Alert workflows, rejection routines, and CMMS work order integration tested and confirmed. QC team trained on the analytics dashboard during active production runs.
Days 18–21
Full Facility Handoff and Reporting Activation
100% inline inspection running at full production speed across all four lines. Quality dashboards, defect trend analytics, and first-pass yield reporting live. First condition-based process intervention completed on Day 19 — a stamping die wear signature detected and corrected before generating a rework batch. Platform fully handed off to the facility's quality and operations team.
05 / Results
12-Month Measured Outcomes Across Rework, Quality Escapes, and Operational Cost
The transition from end-of-line statistical sampling to 100% AI inline inspection produced measurable improvements across every tracked quality and cost metric within the first two quarters. The blended rework rate across all four lines dropped from 6.8% to 1.84% by the end of Month 6 — a 73% reduction translating directly into recovered production capacity, reduced labor expenditure, and elimination of the warranty claim exposure that had been accumulating invisibly under the prior detection model.
| Performance Metric |
Before iFactory |
After iFactory |
Net Change |
| Blended rework rate (all lines) |
6.8% avg |
1.84% avg |
−73% reduction |
| Stamping line rework rate |
9.1% avg |
1.6% avg |
−82% reduction |
| Surface treatment rework rate |
8.4% avg |
2.1% avg |
−75% reduction |
| Inspection coverage (% of output) |
10–15% sampled |
100% inline at speed |
Full coverage achieved |
| Defect detection accuracy |
~80% (human, end-of-line) |
99.4% (AI, inline) |
+19 percentage points |
| Mean time to defect detection |
12+ hours (manual) |
<60 seconds (AI alert) |
Real-time prevention |
| Customer quality escapes |
~240 ppm avg |
<18 ppm avg |
−92% escape reduction |
| Annual warranty claim cost |
~$216,000/yr |
~$22,000/yr |
−90% cost reduction |
| Rework labor hours per month |
2,380 hrs avg |
644 hrs avg |
−73% labor recovery |
| Annual rework cost |
$1.24 million |
$336,000 |
$904K annual saving |
| Platform ROI payback period |
N/A |
5.8 months |
Full ROI under 6 months |
−73%
Rework Rate Reduction
$904K
Annual Cost Savings
−92%
Quality Escape Reduction
"The stamping line result alone justified the entire deployment. iFactory's process correlation analytics identified that three specific die stations were generating 71% of our rework — a pattern we had never been able to isolate under our sampling model. We addressed those stations and the line's rework rate dropped by 82% in six weeks. The platform paid for itself before the end of the first quarter."
06 / Key Analysis
Why the Rework Reduction Was Structural, Not Incremental
THE CORE INSIGHT BEHIND EVERY REWORK REDUCTION ACHIEVED
Rework is not an inherent cost of precision manufacturing — it is a symptom of a detection gap. Every component that enters a rework cycle was first a process deviation that formed at a specific point in the production sequence and went undetected long enough to accumulate cost through subsequent operations. Closing that gap is the only path to structural rework reduction.
Moving detection upstream eliminated the cost multiplication effect of late discovery. Every processing stage a defect advances through before detection multiplies the correction cost. A dimensional deviation caught at the machining station costs the time to re-machine one component. The same deviation caught after cleaning, surface treatment, and assembly positioning costs the reversal and reprocessing of three additional operations. By detecting defects at point of origin rather than end of line, iFactory eliminated the cost multiplication driving rework expenditure far above the underlying defect rate.
Process correlation analytics converted rework from a symptom into a solvable engineering problem. The facility's prior model identified defects but generated no data connecting them to their process origins. iFactory's analytics engine correlated defect patterns with die wear cycles, shift timing, and material batch identifiers — revealing that 71% of stamping line rework originated from three specific die stations running past their optimal replacement threshold. Addressing those three stations eliminated the dominant rework source for the entire line — converting an ongoing monthly cost into a resolved process engineering item.
100% inspection coverage eliminated the statistical guarantee of quality escapes inherent in sampling. A 10–15% sampling rate leaves 85–90% of production output uninspected. Under the prior model, it was mathematically certain that defective components would advance to the customer in every production batch, regardless of inspector skill. Moving to 100% AI inline inspection eliminated that structural escape pathway, reducing customer defect rates from 240 ppm to under 18 ppm and cutting annual warranty expenditure by 90%.
Automated work order generation compressed the response window from hours to seconds. Under the paper-based logging model, a process deviation could run for 12 hours before detection, correction, and containment — generating thousands of potentially affected units requiring sorting and rework disposition. iFactory's automated alert and work order generation compressed that window to under 60 seconds, eliminating the rework inventory accumulation embedded in the facility's $1.24 million annual rework cost.
07 / Business Impact
Operational, Financial, and Strategic Outcomes Beyond the Rework Rate
Production Capacity Recovery
Reducing rework labor from 2,380 to 644 hours per month recovered 1,736 monthly production hours — equivalent to one full production shift per week — available for scheduled output without overtime or headcount expansion.
1,736 hrs/month recovered
OEM Contract Protection
Reducing customer defect rates from 240 ppm to under 18 ppm eliminated contract penalty exposure at the 150 ppm threshold and qualified the facility for preferred supplier status with two OEM customers — opening new business previously withheld.
Preferred supplier status achieved
QC Team Redeployment
With AI handling 100% inline inspection, eight QC inspectors shifted from physically demanding visual scanning to higher-value analytical work — defect trend analysis, supplier quality development, and process engineering. No headcount reduction required.
Zero headcount reduction
Audit and Compliance Readiness
Every inspection event generates a time-stamped digital record with defect classification, severity score, and annotated photographic evidence — replacing paper traveler cards with a permanent audit-ready trail for every OEM customer review.
100% digital audit trail
Maintenance Cost Reduction
Process correlation analytics flagged tooling degradation patterns weeks before failure — converting emergency repair events into planned maintenance during scheduled downtime windows and eliminating production stoppages previously embedded in rework cost calculations.
Planned vs reactive maintenance
First-Pass Yield Improvement
Inline defect detection at origin prevented non-conforming units from advancing through subsequent operations, improving first-pass yield across all four lines and directly reducing the consumable and energy cost embedded in every rework cycle.
+14 ppt first-pass yield gain
08 / Conclusion
Rework Is a Detection Problem. AI Vision Cameras Are the Solution.
The central finding of this case study is straightforward: rework is not an inherent cost of precision manufacturing — it is a symptom of a detection gap. Every component that enters a rework cycle was first a process deviation that formed at a specific point in the production sequence, under specific conditions, that the existing quality model could not identify before cost was embedded. The facility documented here had invested meaningfully in quality infrastructure. Its rework costs were not the result of insufficient effort — they were the result of a detection model that was structurally incapable of catching defects before they accumulated cost across multiple processing stages.
iFactory's AI Vision Camera platform closed that detection gap by moving inspection from the end of the line to the point of production, expanding coverage from 10–15% sampling to 100% inline inspection, and layering a process correlation analytics engine that identified the specific conditions driving the majority of rework on each line. The result was a $904,000 annual saving, a 73% rework rate reduction, and a 5.8-month full ROI payback. To assess what iFactory's platform would deliver against your facility's specific rework and defect profile, Book a Demo with iFactory's industrial analytics team.
09 / FAQ
Frequently Asked Questions
How does iFactory AI Vision Camera reduce rework costs in manufacturing?
iFactory reduces rework costs by moving defect detection from end-of-line sampling to inline inspection at the point of production. By catching defects before they advance through additional value-adding stages, the system eliminates the cost multiplication that makes rework so expensive. The real-time process correlation analytics layer additionally identifies the specific process conditions generating defects, enabling root-cause elimination rather than ongoing defect sorting and rework cycles.
What rework reduction results can manufacturers realistically expect?
This case study documented a 73% blended rework rate reduction across four production lines, with individual lines achieving 75–82% reduction. Results are consistent with documented outcomes across iFactory's manufacturing customer base. The magnitude of improvement depends on the facility's baseline rework rate and the proportion driven by detectable surface defects — facilities with high rework rates caused by process deviations typically see the largest reductions, as the analytics engine eliminates dominant defect sources rather than simply detecting them faster.
How quickly does iFactory deploy on a production line?
Most iFactory deployments achieve full inline inspection coverage within 14–21 days. The facility in this case study reached full four-line coverage in 21 days. Camera installation takes approximately 30 minutes per camera with no line stoppage. AI detection models pre-trained on facility-specific defect samples begin live classification within 48 hours of installation. The platform integrates with existing CMMS, MES, and ERP systems via OPC-UA, MQTT, or REST API throughout the deployment window.
Does the platform work with existing production line cameras?
Yes. iFactory AI Vision is hardware-agnostic and integrates with existing IP cameras via ONVIF and RTSP protocols — including Hikvision, Dahua, Axis, Bosch, and Sony devices. For sub-millimetre surface defect detection or high-speed stamping inspection applications, iFactory recommends 4K+ industrial cameras with precision lighting arrays. The edge processing system runs entirely on-premise on NVIDIA GPU hardware with zero cloud dependency and full support for air-gapped deployments.
What is the typical ROI payback period for iFactory AI Vision Camera deployment?
The facility in this case study achieved full platform ROI in 5.8 months. Across iFactory's manufacturing customer base, payback periods range from 4 to 12 months depending on baseline rework rate, production volume, and quality escape cost structure. High-volume facilities with significant warranty claim exposure or OEM contract penalty structures typically see the shortest payback periods, as the combined reduction in rework cost and quality escape cost is most concentrated in those environments.
$904K Saved. 73% Rework Reduction. Full ROI in Under 6 Months.
iFactory AI Vision Cameras deliver 100% inline inspection at full production speed — catching defects at their point of origin before they accumulate rework cost across subsequent processing stages. Measurable results from week one of deployment.
99.4% defect detection accuracy
100% output coverage vs 10–15% sampling
Real-time process correlation analytics
Full deployment in 14–21 days