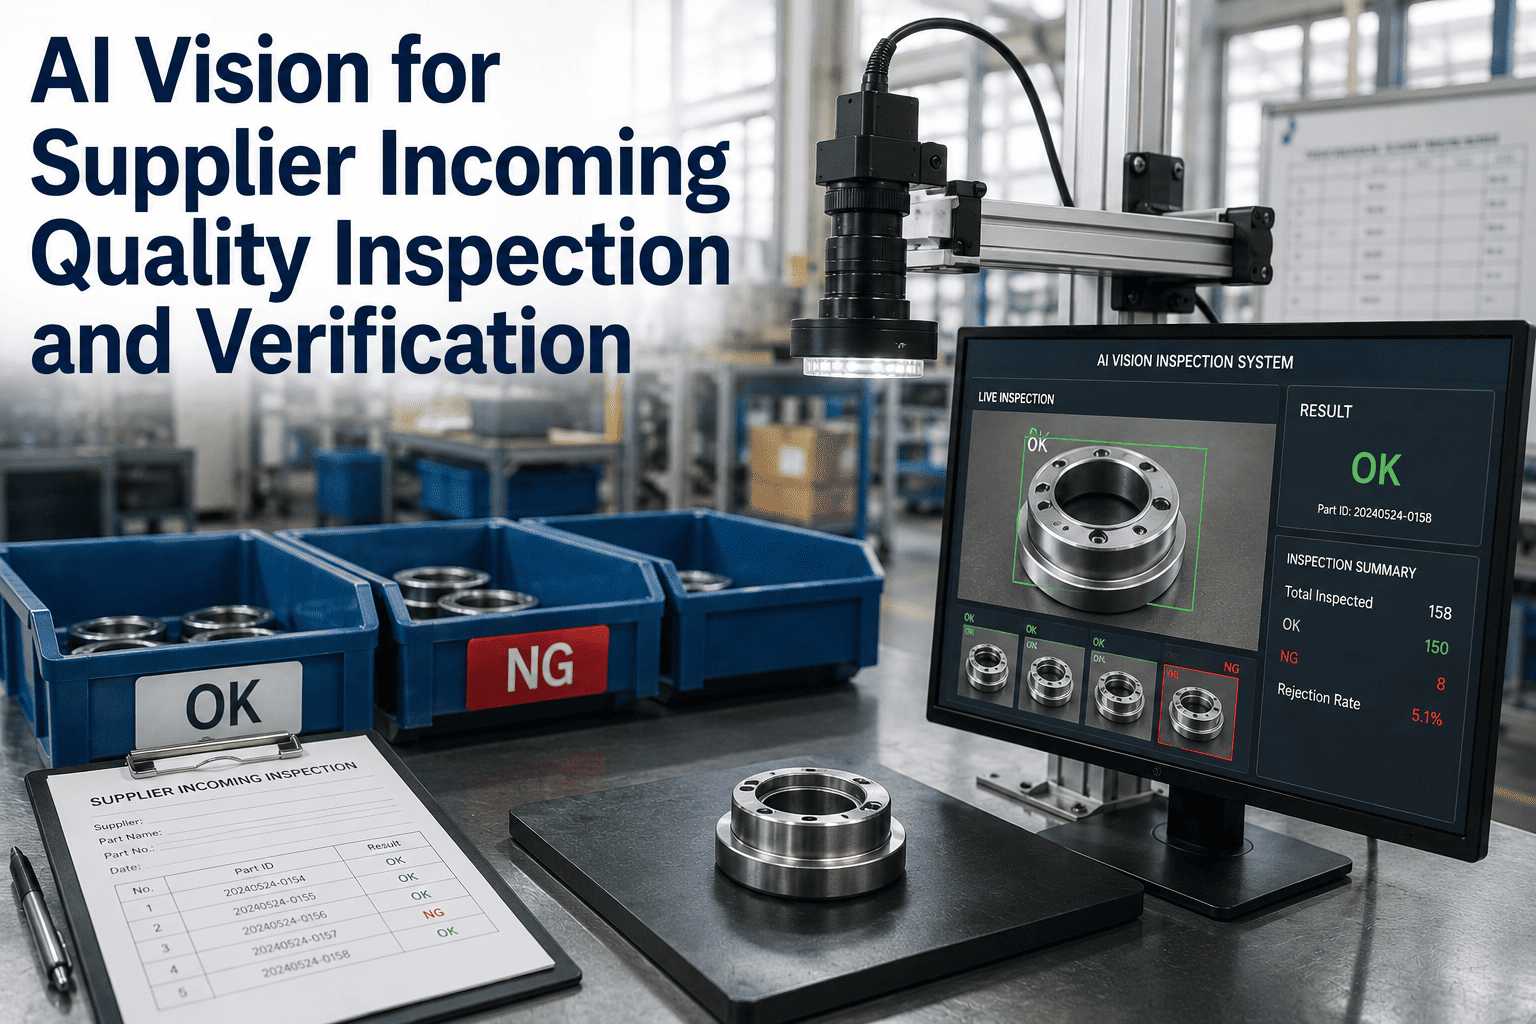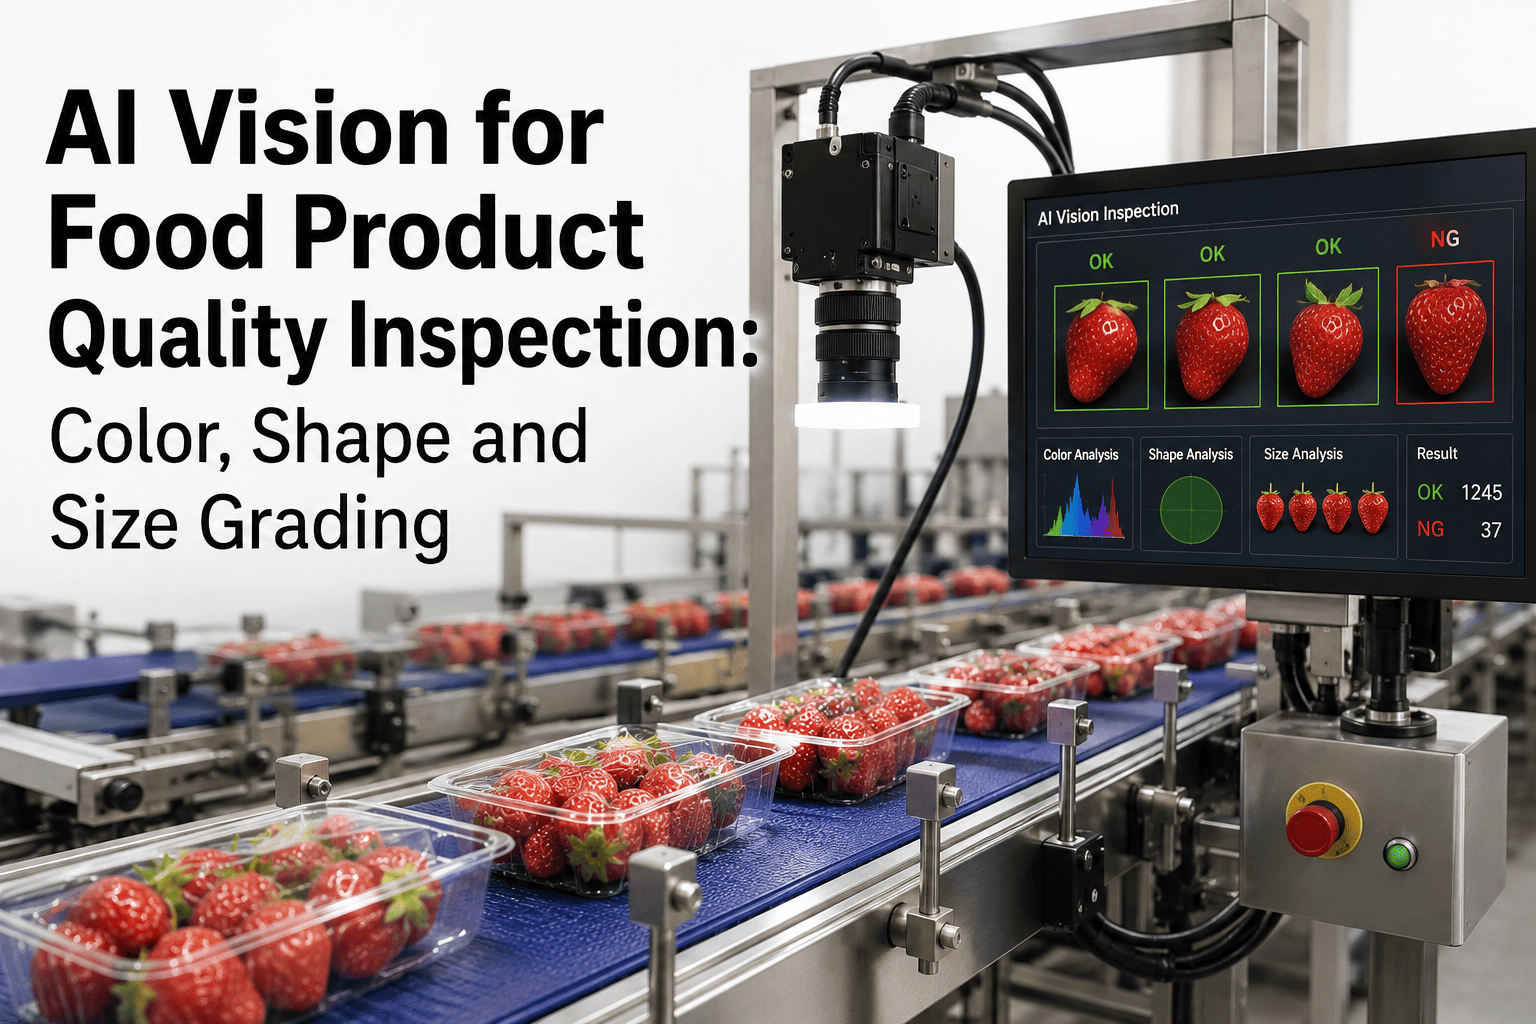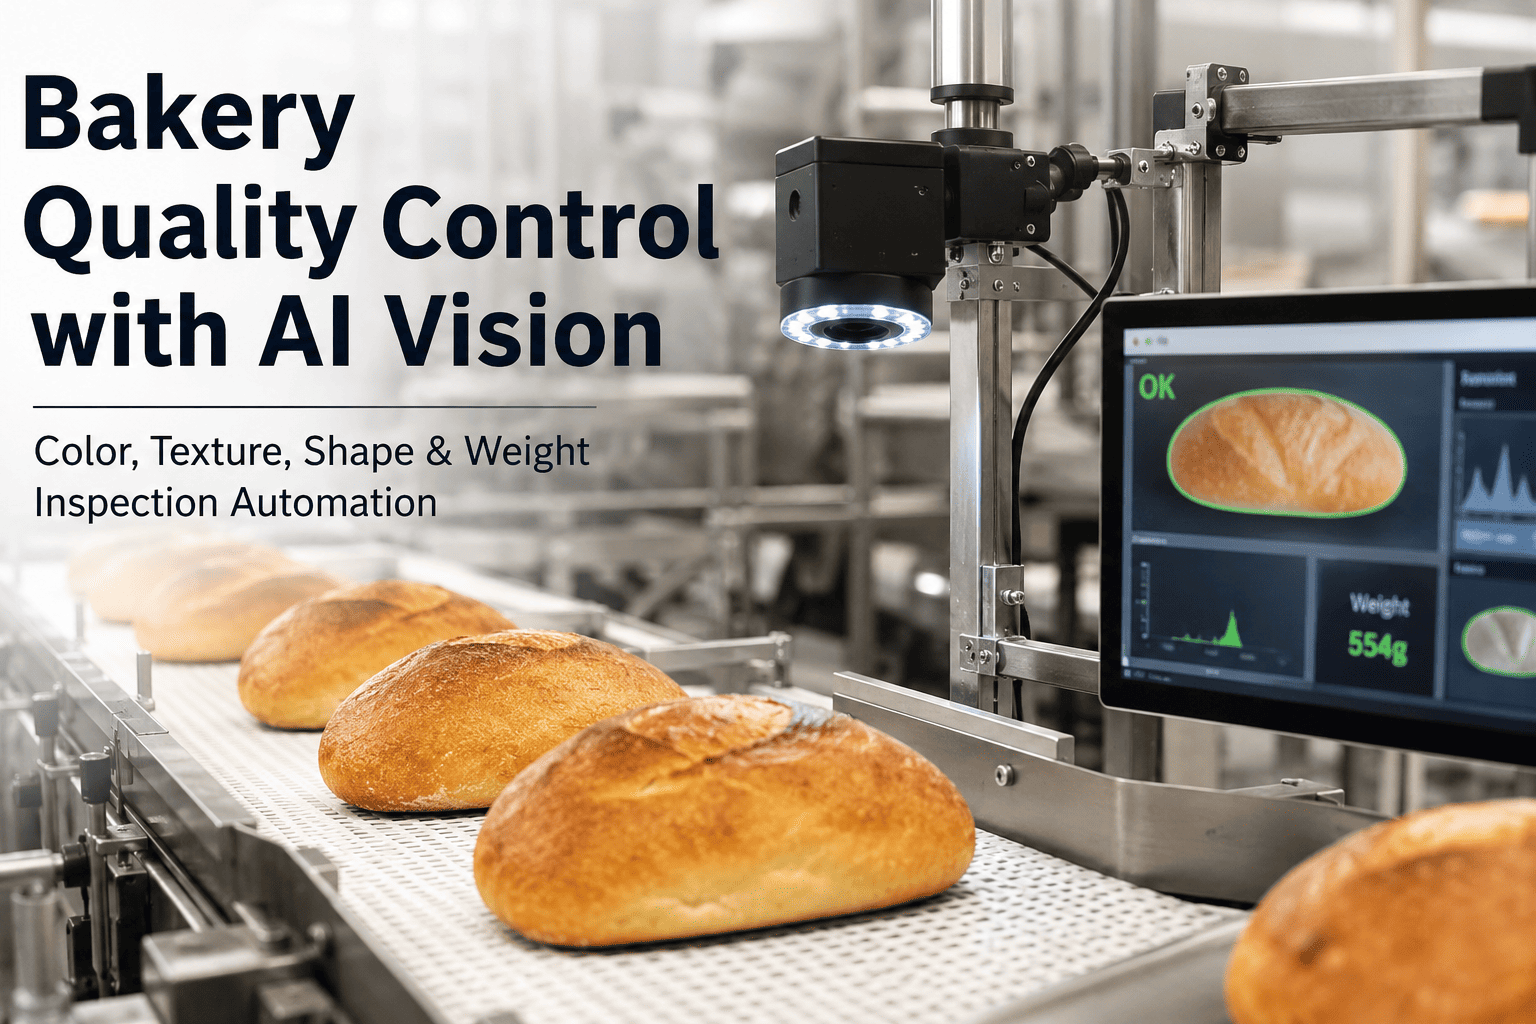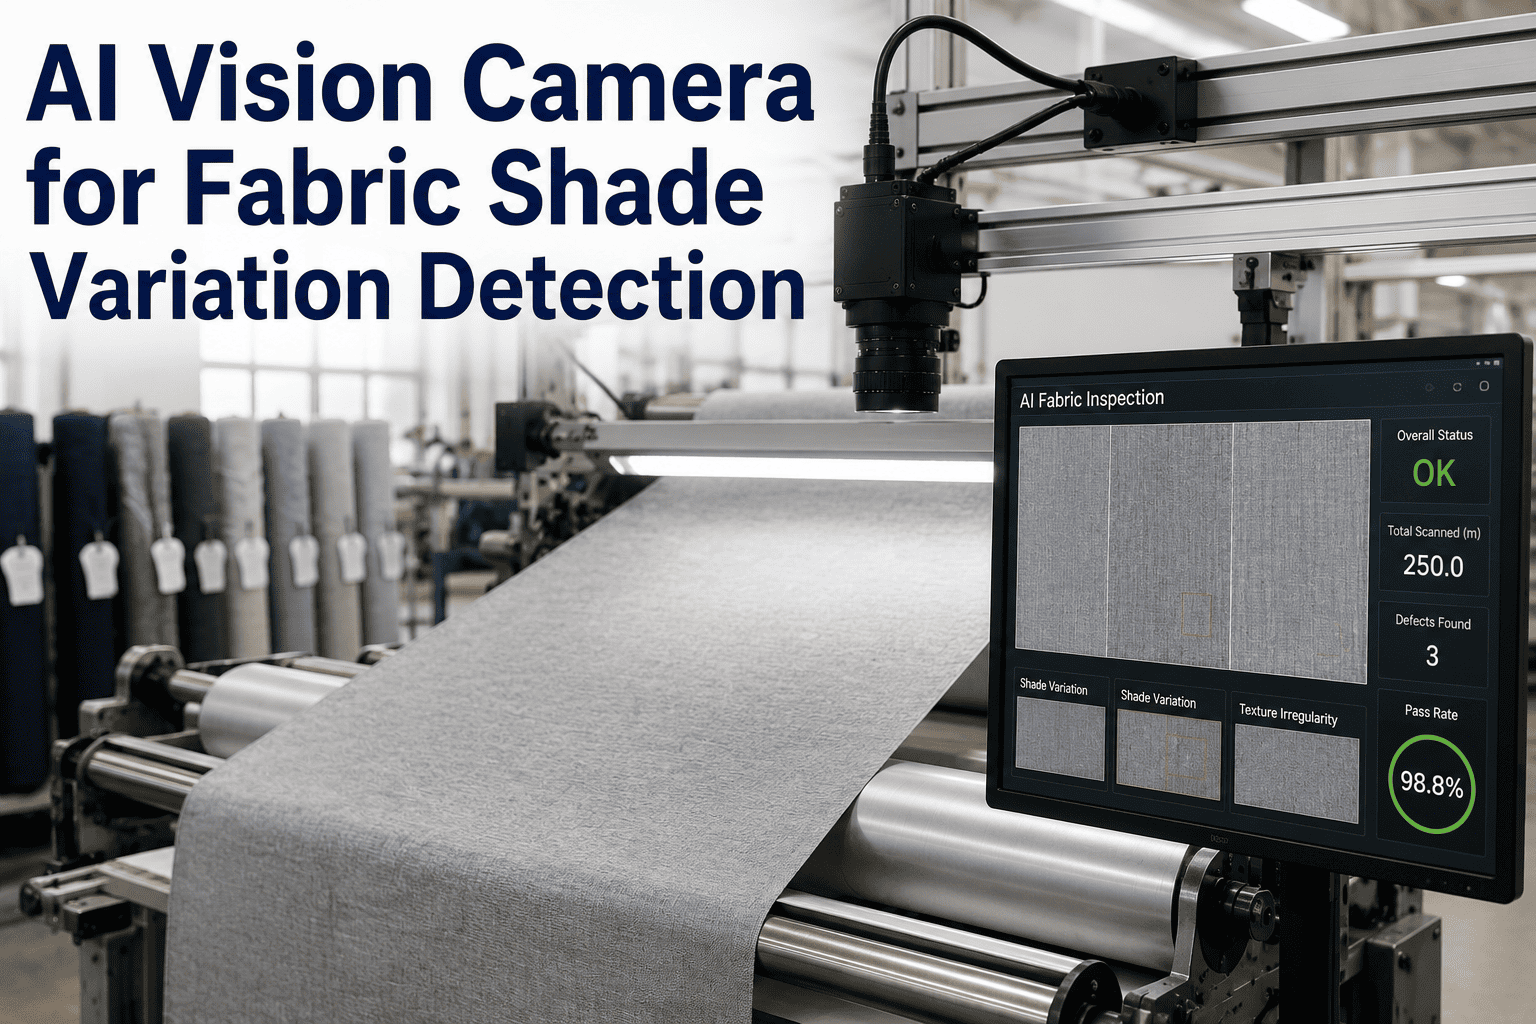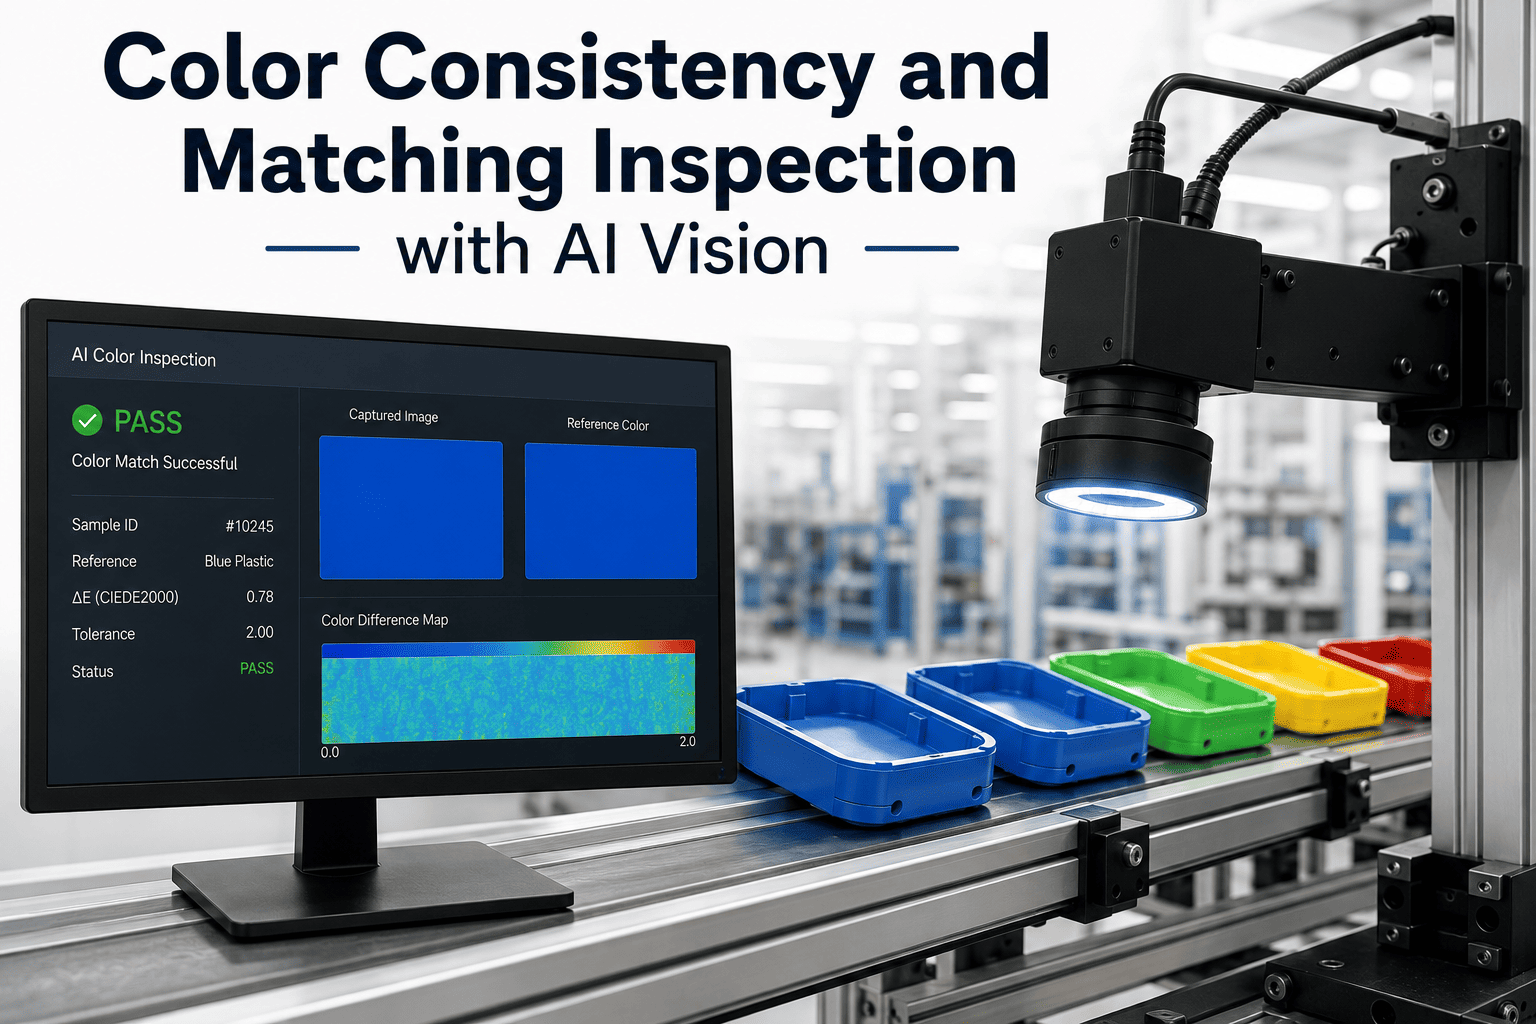
Color is the first thing a customer notices and the first thing they distrust when it drifts. A luxury lipstick with a half-shade shift, a beverage bottle with two-tone caps across a pallet, a car door that reads warmer than its fender under showroom light — none are ingredient failures, and none are dimensional failures. They are color-measurement failures, and they trigger returns, chargebacks, and quiet loss of brand equity long before quality even hears about them. iFactory's AI color vision brings spectrophotometer-grade Delta E judgment onto the production line, on every unit, at line speed. Book a color-vision assessment to see live scans on your own product.
Every Unit Measured. Every Batch Verified. Every Shade Locked to Standard.
Calibrated multi-spectral cameras plus deep-learning ΔE evaluation catch color drift in milliseconds, in-process, without pulling samples to the color lab.
The Cost of Color Drift on a Production Line
Color failures are rarely about ingredient, pigment, or ink. They are about how often you measure, how consistently you measure, and who is doing the looking. The numbers below explain why every FMCG, packaging, coatings, and print operation eventually moves from visual QC to instrumented color control.
of FMCG color failures trace to measurement-interval gaps, not formulation
higher return rate for products with visible batch-to-batch color variation
of total sales absorbed by cost-of-poor-quality across scrap and warranty
the threshold at which the human eye begins to perceive a color difference
The Perception Gap: What Human Inspectors Miss, and What AI Vision Catches
Even trained inspectors fatigue within minutes when judging subtle color differences across thousands of units per hour. Lighting shifts, viewing angle, personal color memory, and end-of-shift exhaustion all compound. AI vision under calibrated D65 illumination removes every one of those variables.
- Detects ΔE 3–5 reliably; below that, inspector disagreement runs high
- Fatigue sets in within 15–20 minutes of continuous color judgment
- Perception shifts with ambient light, wall color, and time of day
- Two inspectors on the same sample often disagree by ΔE 1–2
- Cannot quantify — only pass, fail, or "close enough"
- Resolves ΔE 0.5–1.0 across every unit, every cycle
- No fatigue, no drift, no shift-to-shift variability across 24/7 operation
- Fixed spectral illumination; ambient light isolated from the tunnel
- Deterministic to five decimal places on L*, a*, b* per capture
- Numeric output enables SPC, Cpk, and trend analysis on color
Inside the L*a*b* Color Space the AI Actually Sees
Since 1976 CIELAB has been the industrial standard for describing color numerically. It is device-independent, roughly perceptually uniform, and covers the full range of human vision. Every measurement iFactory's system produces lives on these three axes.
The Delta E Scale: From Imperceptible to Clearly Wrong
Delta E (ΔE) is the distance between two colors in L*a*b* space — the universal number that turns "close enough" into a pass or fail. The scale is not linear in perception; what looks tiny mathematically can still be brand-damaging on a shelf.
Below the human threshold. Only instruments detect it.
Trained eye under bright, controlled light may spot it.
Most people see the difference in side-by-side comparison.
Obvious even without a reference; usually rejected.
Reads as a different SKU. Chargebacks and returns follow.
Four Delta E Formulas, One Right Choice for Your Line
"Delta E" is not one formula. Since 1976 the math has been refined four times to better match how the human eye perceives color difference. The formula you choose changes which parts pass and which fail — sometimes dramatically.
ΔE76
The original CIE formula. Simple square root of squared L*, a*, b* deltas. Legacy specs still reference it, but disagrees with human perception in blue and neutral regions.
ΔE94
First perception-corrected formula. Weighting factors so a lightness shift is not scored the same as a chroma shift. A step up for textile and paint of the era.
ΔE CMC
From the Colour Measurement Committee of the UK Society of Dyers. A 2:1 lightness-to-chroma ratio matching how the eye tolerates lightness better than saturation shifts.
ΔE 2000
Current default in packaging, print, automotive, and coatings. Corrects hue-rotation, chroma-dependency, and neutral-region errors of prior formulas. iFactory's default engine setting.
Stop Chasing Batches. Lock Every Shade to Standard.
See a live ΔE scan on your own product against your master reference under a calibrated D65 tunnel. iFactory scopes camera, spectro reference, and integration for a fixed-price 10-week pilot.
Industry Delta E Tolerance Benchmarks
Every industry has settled on a working Delta E range through decades of returns and PPAP submissions. Your tolerance is set by your customer, not by physics — and the tightest customers now demand ΔE 1.0 or better on every unit.
Six Ways Color Fails Before Anyone Notices
Color drift is rarely a single event. It is the compounding of small process variables that were within spec individually but combine into a shade the customer flags. Here is the taxonomy of failure modes iFactory's AI is trained to catch.
Ink or pigment viscosity drift
Thicker or thinner ink lays down at a different optical density. ΔE creeps 0.3–0.8 within an hour of an unnoticed viscosity change.
Substrate lot variation
A new roll of film, board, or fabric with a fractionally different base tone shifts final printed color even when the ink is identical.
Pigment batch shift
Master-batch supplier variation or a fresh drum with a slightly different pigment loading pushes plastic parts off standard.
Anilox or plate wear
On flexo lines, cell wear gradually reduces ink transfer. Color starts on-target and slides off by the end of the roll.
Metamerism
Two samples match under warehouse fluorescents but diverge under retail LED. Only spectral measurement catches this before shipment.
Operator visual drift
Inspectors adapt to color over the shift. The pass threshold silently loosens by ΔE 1–2 across an eight-hour shift on repetitive work.
The iFactory Color Inspection Architecture
Every unit passes through a controlled optical tunnel where camera, illumination, spectrophotometer reference, and AI model work together. Each stage is deterministic, logged, and auditable back to the raw spectral signal.
Calibrated D65 capture
Multi-spectral cameras image the unit under fixed D65 illumination inside a light-sealed tunnel. Ambient light, operator shadows, and reflections are isolated out of the exposure.
Spectrophotometer reference
A traceable spectrophotometer measures periodic golden samples through the same tunnel, anchoring the vision system to a certified reference for audits and PPAP.
L*a*b* extraction & AI match
The deep-learning model computes L*, a*, and b* per unit, then compares to master reference using the configured ΔE formula. Region-of-interest masks isolate the controlled area.
Verdict & SPC write
Every unit gets a pass, warn, or fail verdict plus numeric ΔE, L*, a*, b*. Values stream into SPC to build live X-bar-R and Cpk charts per SKU and line.
Process feedback loop
When ΔE trend crosses the warning band, alerts route to the operator with the direction of drift — lighter, warmer, more saturated — so correction happens before rejects stack up.
What Changes with Inline AI Color Inspection
Numbers from typical FMCG, packaging, and coatings deployments within 120 days of go-live. Drift is caught in seconds, and the color lab shifts from firefighting to reference work.
The 10-Week Fixed-Price Color Pilot
One line, one product family, one fixed price. Ten weeks from kickoff to live ΔE feedback on 100% of your production. Here is what happens each phase.
Golden samples, spectrophotometer reference, ΔE tolerance definition per SKU.
Light-sealed D65 tunnel, multi-spectral cameras, calibration cycle on offline samples.
Deep-learning model trained on your product images, tuned against spectro L*a*b* ground truth.
Batch tagging, per-unit L*a*b* logging, real-time SPC dashboards in your quality stack.
Parallel run against lab, gauge R&R against spectrophotometer, quality/ops sign-off.
A Quality Manager's View on Inline Color AI
Our color lab used to review pulled samples three times a shift. On a bad day we would catch drift at hour two and scrap two hours of production. On a really bad day the customer would find it. Now every bottle gets its L* and a* checked as it passes the tunnel, the operator sees the trend on his screen, and if b* creeps yellow, he corrects before we have made a single reject. Our spectrophotometer still runs in the lab, but now it verifies the vision system on morning golden samples.
reduction in color-related complaints within four months
measured correlation between AI vision and lab spectrophotometer
of production units L*a*b* verified, versus 1–2% before
Frequently Asked Questions
Does inline AI vision replace our spectrophotometer, or work with it?
It works with it. The spectrophotometer remains the traceable reference for PPAP, customer submissions, and calibration. What changes is that instead of measuring pulled samples every hour, it measures periodic golden samples that verify the vision system. Vision then handles 100% inline coverage on every unit, while the spectrophotometer stays as the certified reference. Book a scoping call to map the split for your line.
Which Delta E formula does the system use, and can we change it?
iFactory defaults to ΔE 2000 because it delivers around 98% agreement with visual assessment and is the current specification in packaging, print, automotive, and coatings. The engine also supports ΔE76, ΔE94, and ΔE CMC 2:1 for lines where a customer specification requires them. Formula and tolerance are configurable per SKU, so a private-label SKU on ΔE CMC and a brand SKU on ΔE 2000 run on the same line without conflict.
How does the system handle metamerism between store and warehouse lighting?
Metamerism is a strong reason to move beyond RGB cameras. iFactory's multi-spectral capture samples the full visible spectrum, not just three primary channels, so the L*a*b* calculation reflects true spectral behavior. When needed, the system computes ΔE under multiple simulated illuminants (D65, A, CWF) from the same capture, flagging colors that match under one and diverge under another.
What accuracy can we expect versus a benchtop spectrophotometer?
Under properly configured D65 tunnel conditions with a calibrated multi-spectral camera and traceable golden samples, inline correlation to a lab spectrophotometer lands at ΔE 0.5–0.8 on the same unit. That is inside the human perception threshold and well below the tolerance most customers demand. A gauge R&R study during pilot scoping quantifies exactly what your line will deliver before commitment.
Can the system handle multi-SKU lines with different color standards per product?
Yes. Every scan begins with SKU identification tied to the MES order or a readable identifier on the unit. The corresponding color master, ΔE formula, tolerance band, and region-of-interest mask load automatically. Mixed-flow lines running six or more SKUs back-to-back are common; changeover is measured in seconds. Talk to a specialist about your SKU mix and line topology.
The Bottom Line on Inline AI Color Vision
Color is a brand asset that fails invisibly and expensively. Human inspection cannot scale to 100% coverage, cannot quantify what it sees, and cannot survive an eight-hour shift without perception drift. Instrumented color vision — cameras and AI anchored to a traceable spectrophotometer — moves quality from reactive sampling to real-time control. The lab keeps its role as reference authority; the line finally gets the coverage it always needed.
See ΔE 2000 Running on Your Own Product
Book a 30-minute scoping call. Share a product sample and your target color master. iFactory demonstrates a full inline capture, ΔE 2000 evaluation, and L*a*b* trend chart on your geometry, then builds a fixed-price 10-week pilot proposal with an ROI worksheet tied to your color-return rate.