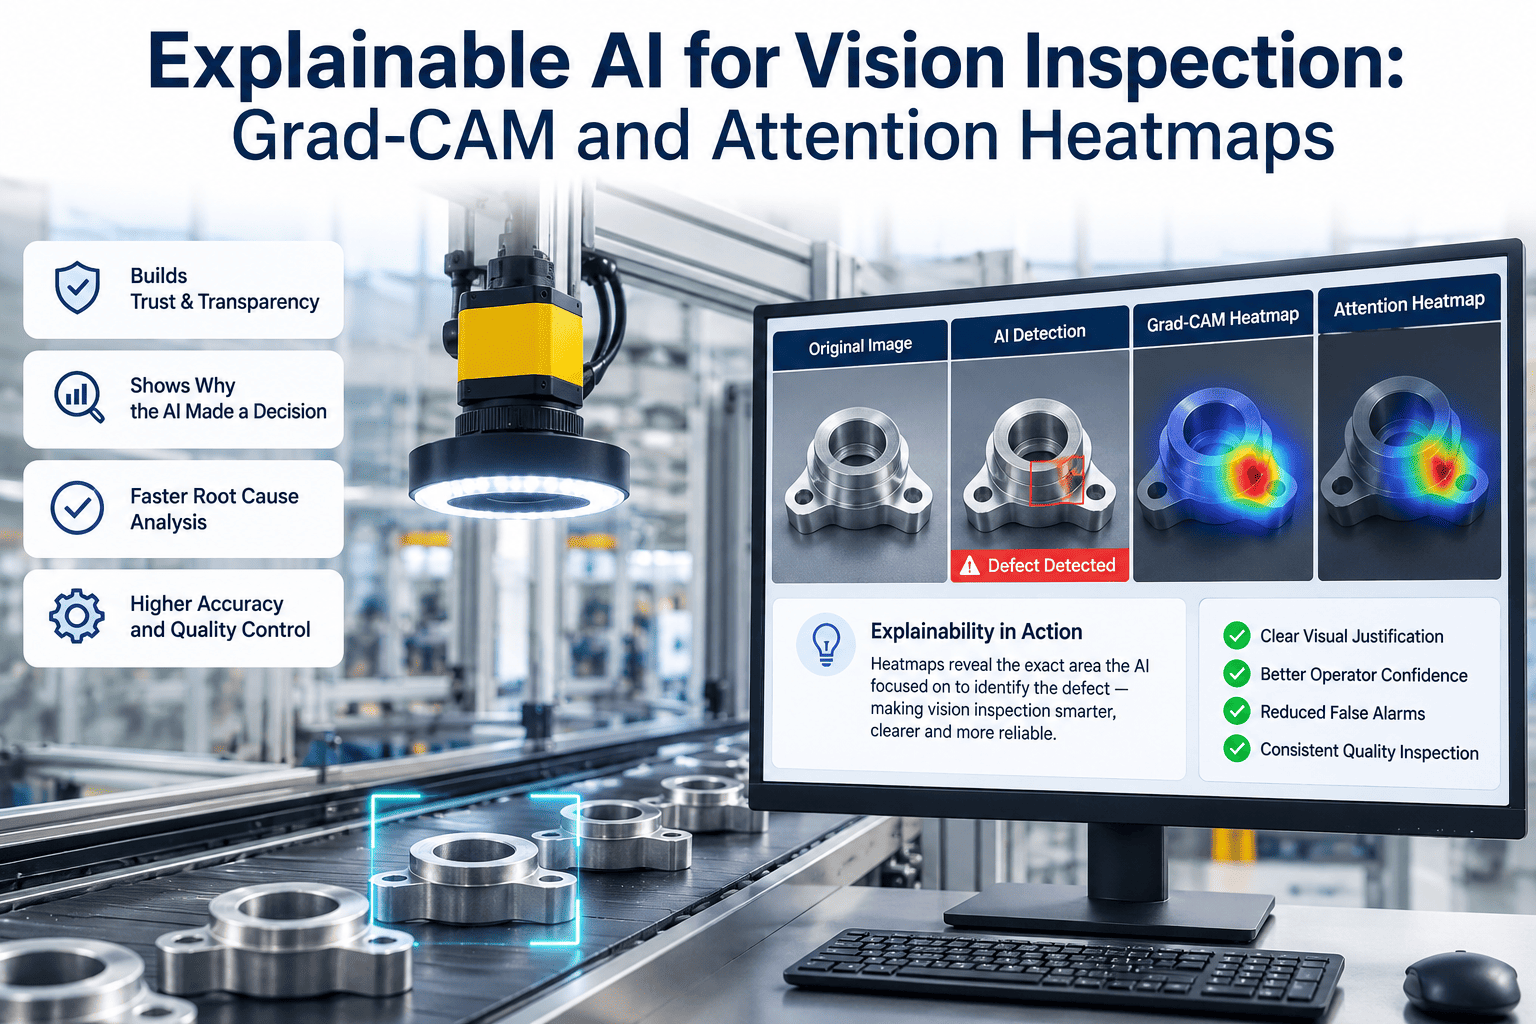
When an AI vision model flags a bearing as defective at 300 parts per minute, the engineer at the line has one question the model rarely answers: why? Traditional deep learning outputs a class label and a confidence score — and stays silent about the reasoning. That silence is the single largest barrier to industrial AI adoption, because engineers, auditors and regulators cannot approve what they cannot inspect. Explainable AI techniques like Grad-CAM and attention heatmaps break that silence by drawing exactly which pixels drove the decision. To see an explainable inspection layer running on your own images, book a demo with our vision team.
Explainable Vision AI
Grad-CAM and Attention Heatmaps: How to Make an AI Vision Model Explain Every Reject Decision
Quality engineers, plant managers and regulators need to understand why the model flagged a defect. Heatmaps show exactly which pixels drove the call — pixel by pixel, class by class.
73%
Of QC teams distrust unexplained AI rejects
40%
Faster model debugging with heatmaps
7
EU Trustworthy AI requirements XAI supports
The Black-Box Problem: Why Unexplained AI Fails on the Shop Floor
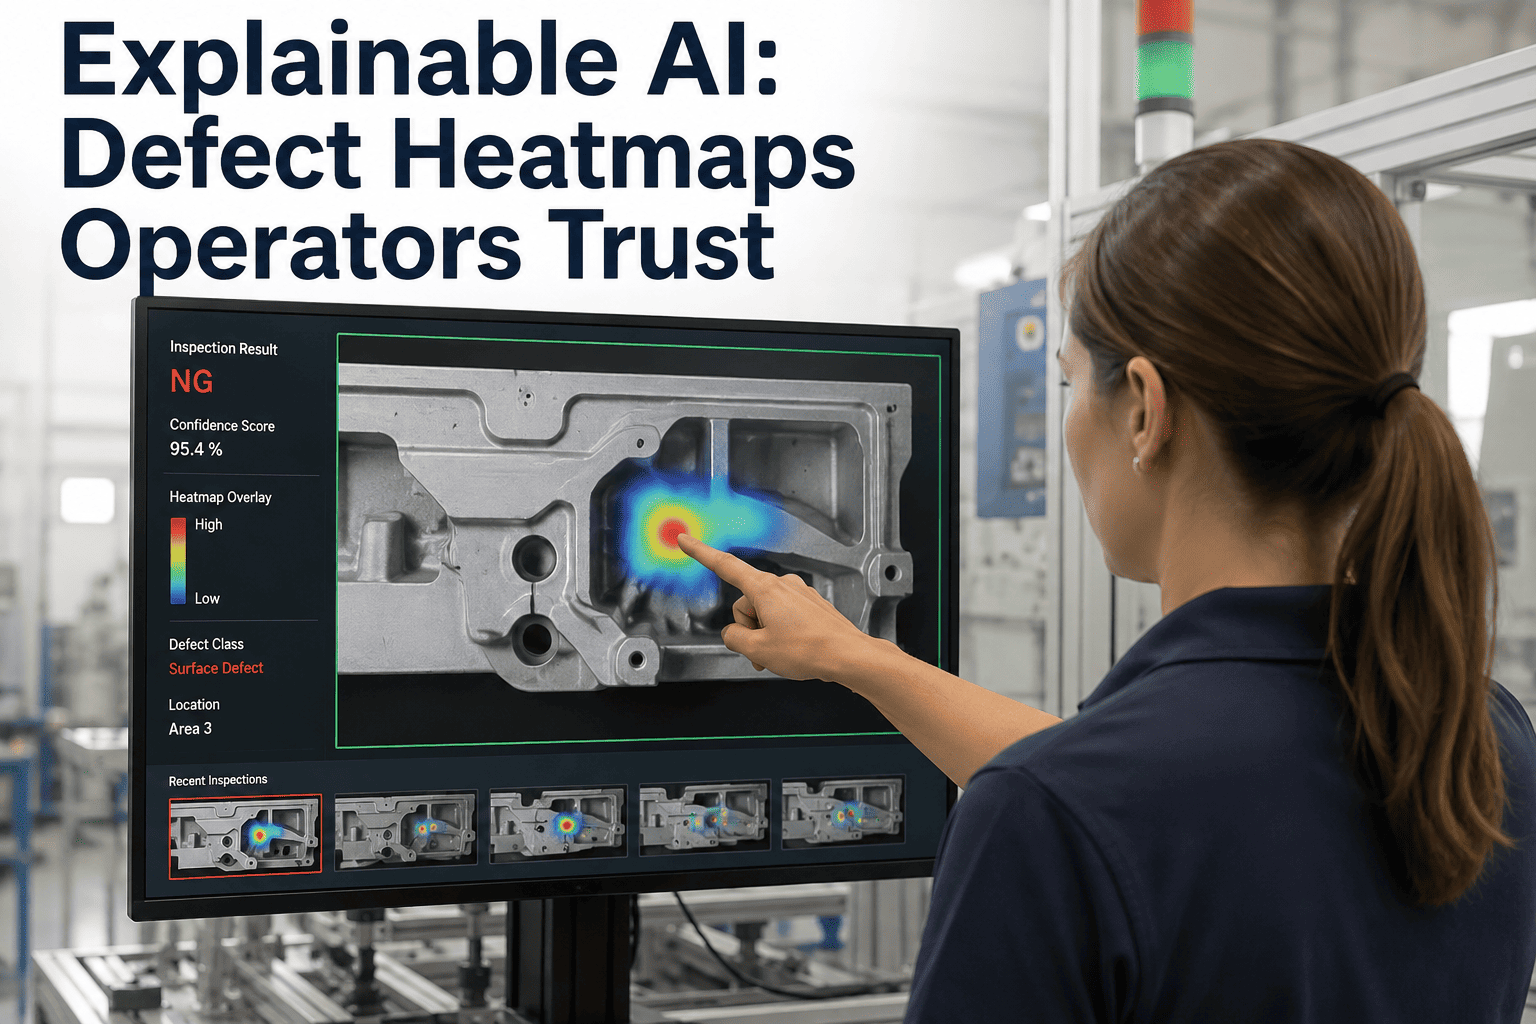
Every quality team has lived this scene. A vision model rejects a part. Operator asks why. The engineer opens the dashboard and sees only a class label and a confidence score. Nobody can point to what the model actually saw, so the reject either gets accepted on faith or overturned on gut. Multiply that friction across a shift and unexplained AI slowly gets ignored — even when it is right.
Without XAI
Inspection Image
Bearing surface
REJECT
Confidence: 0.94
Operator asks “why?” Nobody can answer. The reject gets overturned on gut instinct.
With Grad-CAM
Inspection Image + Heatmap
Bearing surface
REJECT — Scratch, upper-left
Confidence: 0.94
Operator sees the hot region, verifies the scratch, and approves the reject in seconds.
How Grad-CAM Turns a Neural Network Transparent
Grad-CAM — Gradient-weighted Class Activation Mapping — is the most widely used technique for extracting a spatial explanation from a CNN. It traces the gradient of a target class back through the last convolutional layer, weighs each feature map by contribution, and projects the result onto the input image as a heatmap. The whole calculation runs in a single backward pass, adding milliseconds to inference.
1
Forward Pass
The image runs through the CNN as normal, producing a class prediction and a confidence score at the output layer.
›
2
Gradient Extraction
Grad-CAM computes the gradient of the chosen class score with respect to each feature map in the last convolutional layer.
›
3
Weighted Combination
Feature maps are averaged using the gradient magnitudes as weights, producing a single spatial map of class-relevant activations.
›
4
Heatmap Overlay
The map is upsampled to the input resolution, colour-mapped, and overlaid on the original image — hot pixels drove the decision.
What a Heatmap Actually Looks Like on a Defect
Rather than describe a heatmap in words, look at one. Below is a simulated Grad-CAM output on a bearing surface where the model detected a scratch. Each cell represents a pixel patch of the feature map, coloured by attention intensity — from cool blue where the model paid no attention, to burning red on the pixels that drove the reject verdict.
Grad-CAM Attention Intensity
Low
High
The concentrated hot zone in the upper-left corresponds to a lateral scratch on the bearing race. A quality engineer looking at this heatmap can validate the reject in one glance — no ambiguity about what the model saw.
The XAI Technique Family: Choose the Right Lens for the Job
Grad-CAM was the breakthrough, but it is not the only tool. The XAI family has grown to solve specific weaknesses — coarse resolution, noise sensitivity, transformer incompatibility. Choosing the right technique depends on your model architecture and the defect type you are explaining.
Grad-CAM
2017
Best for CNN classification with clear class-region association. Fast, single backward pass, works out of the box on ResNet, VGG, MobileNet.
Coarse resolution — limited to last conv layer feature map size. Weak on small or multiple defects in the same image.
Grad-CAM++
2018
Improves gradient weighting to handle multiple instances of the same defect and small-object localisation better than the original.
Still gradient-based, so still shares Grad-CAM's sensitivity to noisy gradients. Marginal cost over base Grad-CAM.
Score-CAM
2020
Gradient-free — uses forward-pass activation scores to weight feature maps. More stable and less noisy heatmaps than gradient methods.
Slower than Grad-CAM because it requires many forward passes per explanation, which matters on high-throughput lines.
EigenCAM
2020
Uses principal components of feature maps. Excellent for sparsely distributed defects — subtle cracks, small speckles on industrial surfaces.
Interpretation is less class-specific — highlights salient regions rather than class-discriminative ones.
LayerCAM
2021
Combines heatmaps from multiple layers to preserve fine spatial detail. The pick when defects are pixel-thin and Grad-CAM blurs them out.
Multi-layer aggregation adds compute and tuning complexity. Requires careful layer selection per model.
Attention Rollout
2020
The right tool for Vision Transformers (ViT). Aggregates attention across all heads and layers into a single interpretable map.
CNN-only teams need not apply. Requires transformer architecture and different tooling than gradient-based CAMs.
Ready to See Heatmaps on Your Own Production Images?
Send us a small batch of your accepted and rejected inspection images. Our engineers will run Grad-CAM and Score-CAM against them and return the visualisations — so you can see exactly what an explainable inspection layer would look like on your line before you commit.
Five Real Scenarios Where Heatmaps Change the Outcome
Explainability is not an academic feature — it changes decisions on the shop floor every shift. These are five moments where an operator, engineer or auditor stops trusting the model until a heatmap resolves the question in seconds.
Scenario 01
Operator overturns a reject
Without XAI: operator eyeballs the part, sees nothing, accepts it back on the line. With heatmap: operator sees the hot region on a hairline scratch invisible to the naked eye, agrees the reject was correct, updates the SOP.
Scenario 02
Model catches the wrong feature
Heatmap reveals the model is focused on a bright reflection from the conveyor belt, not the part. Root cause is now obvious — mask the belt region or fix lighting. Without the heatmap this bias would generate false rejects for months.
Scenario 03
Auditor requests documentation
FDA or notified-body auditor asks how the AI made a specific reject on a batch record. Heatmap plus confidence score gives a defensible visual audit trail. Without XAI, the answer is a black-box shrug and a compliance risk.
Scenario 04
Training data bias detected
Systematic heatmap review across the accepted class shows the model has learned to trust the part fixture rather than the part itself. Discovered before the model shipped — instead of after quality complaints. Explainability pays for itself on catches like this.
Scenario 05
Model drift after supplier change
Reject rate spikes 4x overnight. Heatmaps on new rejects show the model attending to surface texture that differs from the previous supplier. Diagnosis takes an hour instead of a week — targeted retraining ships next day.
The Model-Debugging Workflow With Heatmaps
Heatmaps are not just for the shop floor — they restructure how vision AI teams debug models. Before XAI, debugging meant staring at confusion matrices and hoping for insight. With heatmaps, root cause becomes visual.
Step 1
Log every reject with its heatmap
Store the input image, prediction, confidence score and Grad-CAM output as one record. This creates the audit trail regulators want and the debugging dataset engineers need.
Step 2
Cluster heatmaps by attention pattern
Group rejects by where the model looked. Clusters reveal whether it is attending to real defects, lighting artifacts, fixture shadows or noise. Each cluster becomes a debugging hypothesis.
Step 3
Investigate misfocused clusters
Any cluster attending to background or fixture is a bias signal. Fix upstream — adjust lighting, mask the region, augment training data — instead of retraining blindly.
Step 4
Retrain and verify with heatmaps
After retraining, re-run heatmaps on the same reject set. A model that now attends to the defect rather than the background will generalise. This visual sanity check catches regressions no metric alone will.
Compliance and the Audit Trail Advantage
Explainability is moving from best practice to legal requirement. The EU AI Act, FDA AI/ML guidance and automotive safety frameworks now expect deployed models to produce human-interpretable explanations for high-stakes decisions. Heatmaps are the currency that satisfies these requirements without slowing production.
EU AI Act
Classifies industrial quality AI as high-risk in many contexts, mandating transparency, human oversight and technical documentation — all directly served by heatmap logs.
FDA AI/ML Guidance
Predetermined Change Control Plans require justification of model decisions. Grad-CAM outputs form part of the Predetermined Change Control documentation package.
ISO/IEC 42001
AI management system standard requires explainability procedures. Heatmap generation and archiving satisfies the traceability clauses cleanly.
Automotive ISO 21448
Safety of the Intended Functionality standard requires interpretable failure modes. XAI heatmaps document how the model responds to edge cases in production.
Where Heatmaps Fall Short — and What to Do About It
Heatmaps are powerful but not magical. Every serious deployment needs to understand their limitations before treating them as ground truth.
Coarse resolution
Grad-CAM heatmaps are limited to the last convolutional layer — often 14 by 14 pixels upsampled. For pixel-thin defects like hairline cracks, use LayerCAM or Score-CAM instead.
Model-specific attention
Two CNNs with identical accuracy can produce completely different heatmaps for the same image. Treat heatmaps as evidence, not proof — always corroborate with domain knowledge.
CNN bias
Classical Grad-CAM does not work on Vision Transformers without adaptation. Use Attention Rollout or specialised ViT interpretability tools for transformer-based inspection models.
Confirmation bias in review
Engineers reviewing heatmaps tend to see what they expect. Cluster heatmaps by attention pattern before human review to surface anomalies the eye would otherwise miss.
Frequently Asked Questions
Does adding Grad-CAM slow down real-time inspection?
In production, no. Grad-CAM adds a single backward pass on top of inference — typically five to fifteen milliseconds on an edge GPU. Most deployments run it only on rejected parts rather than every frame, dropping average cost well below one millisecond per part. The heatmap is stored alongside the reject record for downstream review, not blocking the line decision. To see real overhead on your line,
book a benchmark session.
Can Grad-CAM be used with Vision Transformer models?
Not directly. Grad-CAM was designed around convolutional feature maps, and Vision Transformers use attention blocks instead. The standard replacement is Attention Rollout, which aggregates attention weights across transformer layers into an interpretable spatial map. For hybrid CNN-transformer models, combine Grad-CAM on the stem with Attention Rollout on the transformer body. iFactory supports both automatically.
How reliable are heatmaps as an explanation of model behaviour?
Heatmaps are the best available approximation of model attention, but they are not literal decision maps. Recent research shows two CNNs with identical accuracy can produce very different Grad-CAMs on the same input, because gradient paths depend on architecture. In practice heatmaps are useful for debugging, bias detection and human review — but should not be treated as mathematical proof of what the network learned. Always corroborate with quantitative metrics.
Do regulators actually require heatmaps or is it optional?
Regulations require explanations, not specifically heatmaps — but heatmaps have become the dominant way to satisfy the requirement for image-based models. The EU AI Act demands transparency. FDA guidance requires justification of AI decisions in medical devices. ISO/IEC 42001 mandates explainability procedures. Storing Grad-CAM outputs alongside predictions creates a defensible visual audit trail that maps neatly to these clauses. Talk to
our compliance team for specifics.
How does iFactory implement explainability in its vision AI platform?
Every iFactory vision deployment ships with heatmap generation built into the inference pipeline. Grad-CAM runs automatically on all rejects plus a configurable sample of accepts. Heatmaps are stored with the image, prediction and confidence score in an audit-ready log. The operator dashboard shows heatmaps inline with reject notifications, and the engineering console clusters them to accelerate debugging. Score-CAM and Attention Rollout are available where they outperform Grad-CAM.
If Your AI Cannot Explain Itself, Your Team Cannot Trust It
Every quality team, auditor and regulator now expects to see why an AI made a decision — not just what decision it made. iFactory ships explainable-by-default vision inspection: Grad-CAM heatmaps on every reject, audit-ready logs on every prediction, and a debugging console that turns unexplained failures into fixable ones. See it on your own images.