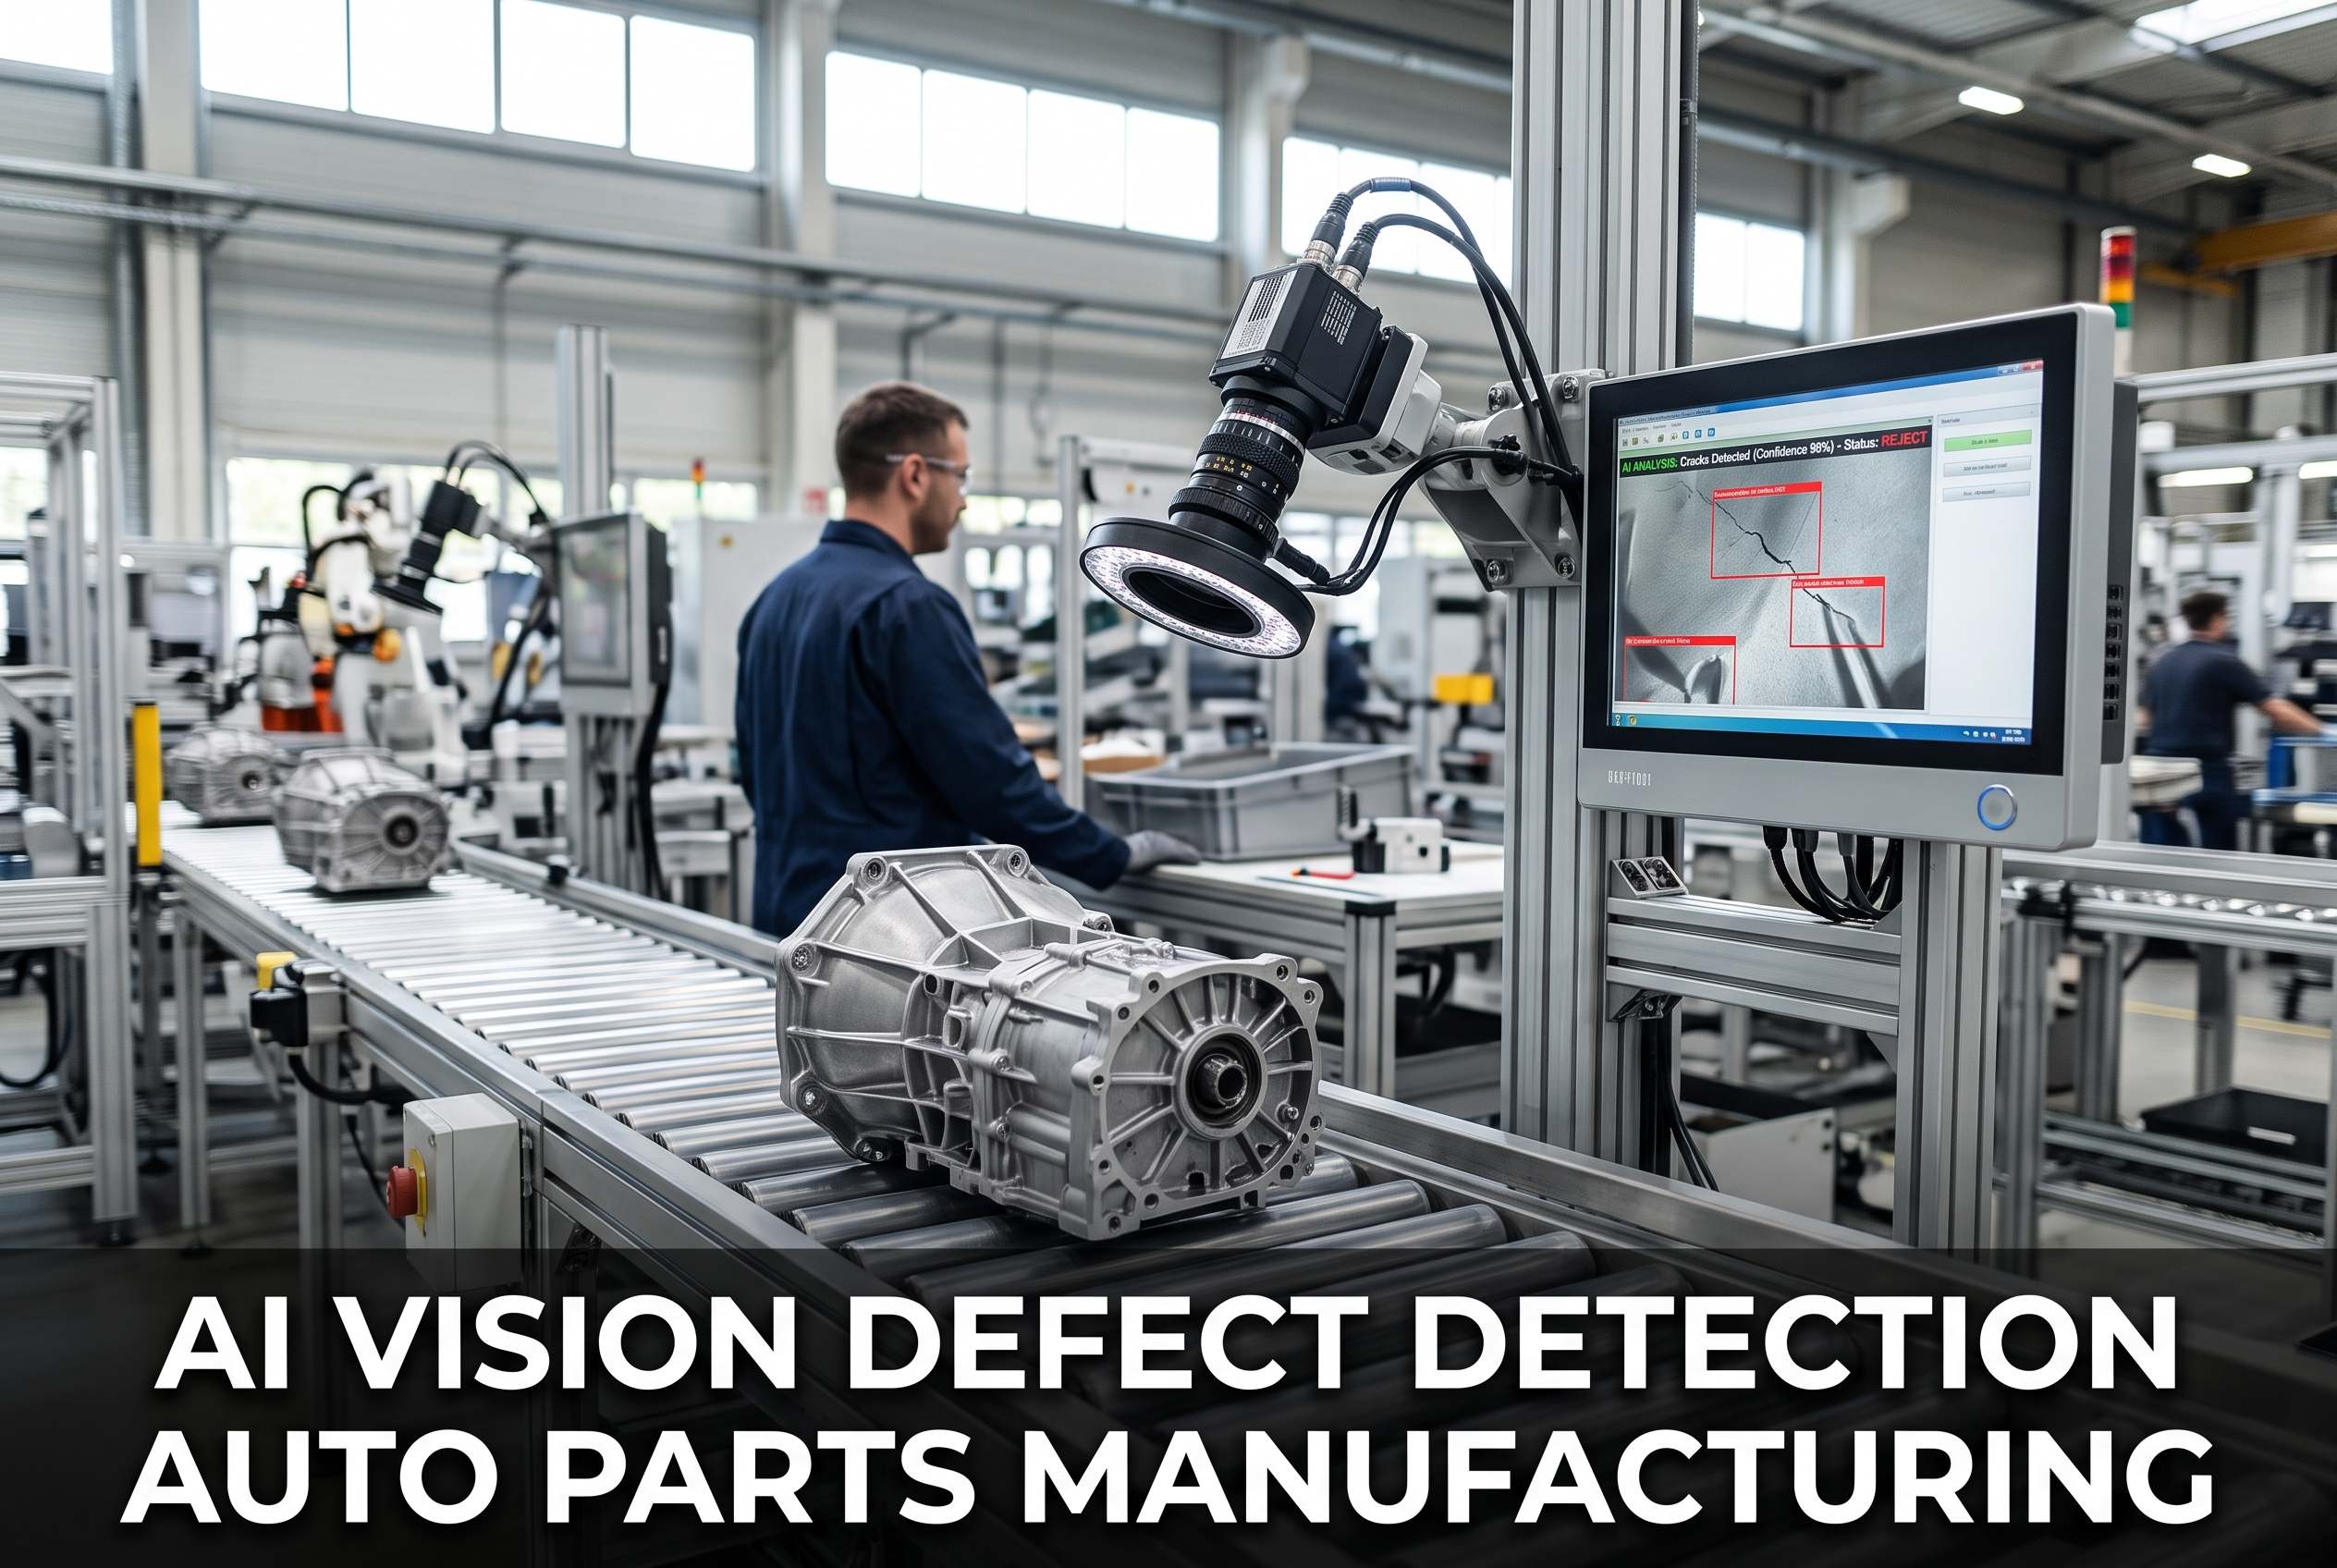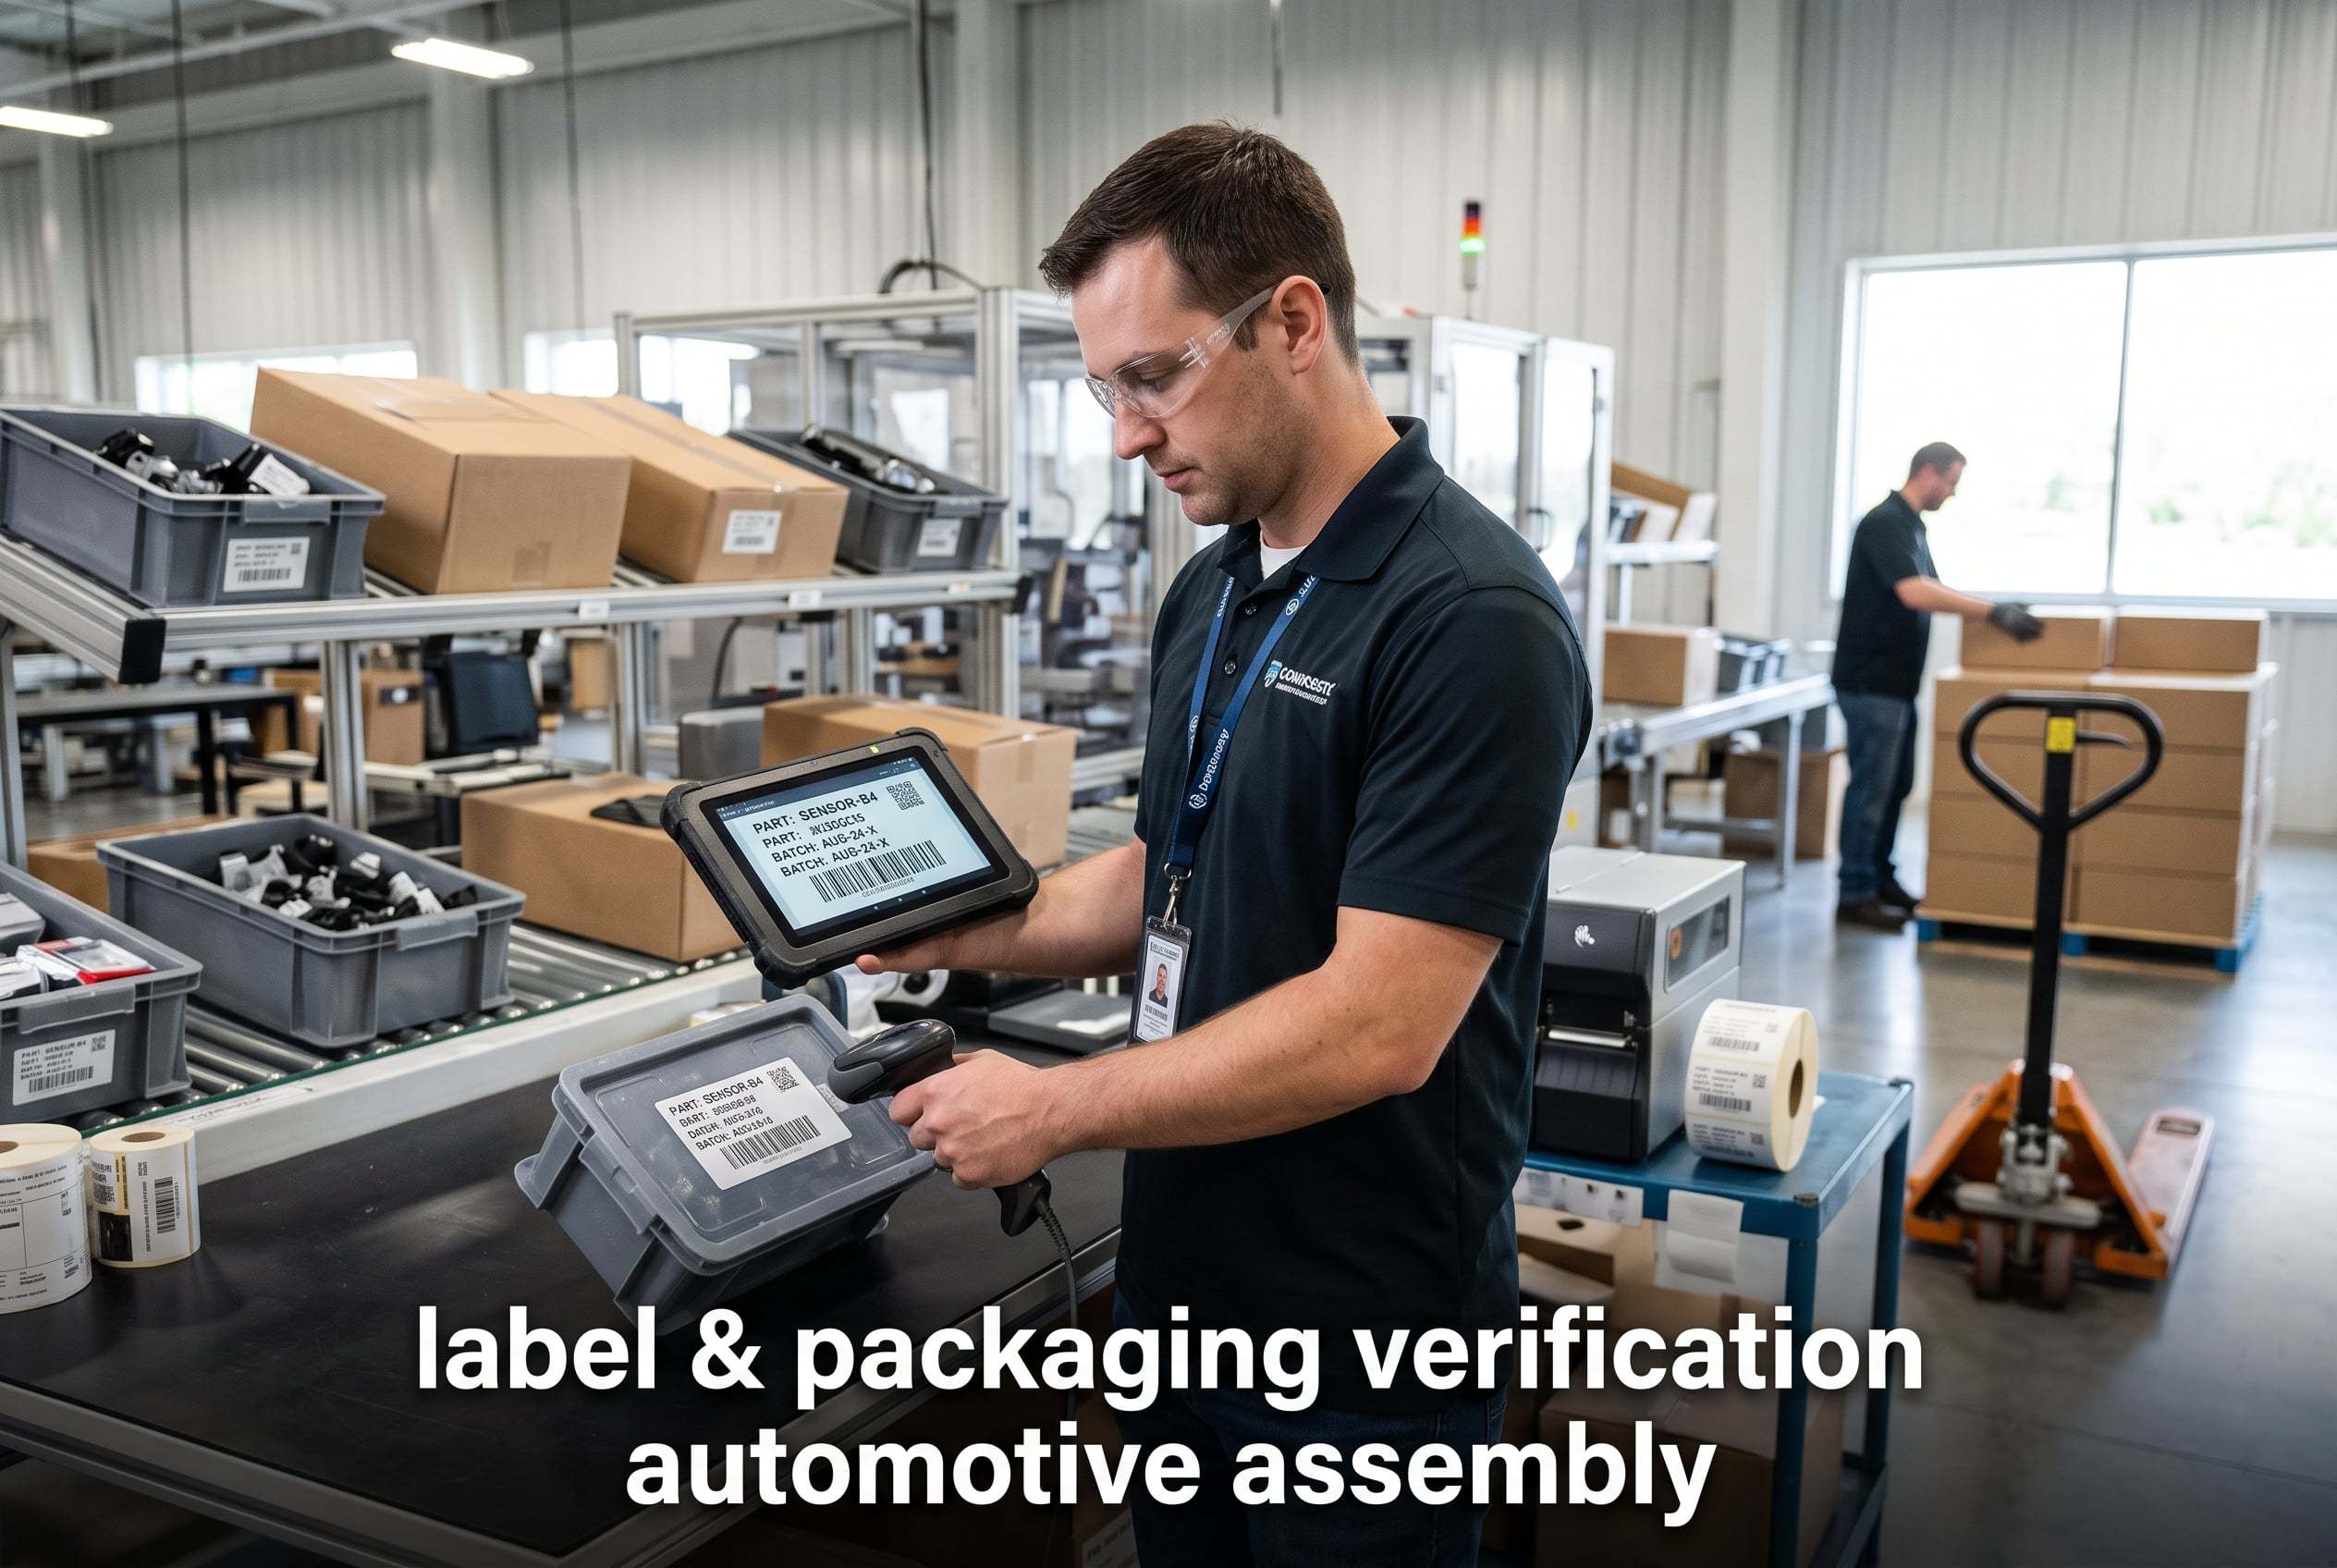
Your trim line is running 62 jobs per hour and a mislabeled VIN slip makes it all the way to the shipping dock before anyone catches it. By then, the vehicle has already been through paint, final assembly, and QC — and pulling it back costs you somewhere between $1,200 and $4,500 in rework labor, line stoppage, and expedited logistics. AI vision for label and packaging verification in automotive assembly is the layer that catches those defects while the unit is still in motion on the body or trim conveyor, routes it to rework or scrap in real time through your Level 2 PLC, and writes every inspection result back to the MES batch record so your quality team stops chasing paper. If you are running a body shop, paint shop, or final assembly line and still relying on a human walking past every fifth car with a clipboard, this is the gap that is quietly driving your scrap cost and dragging down your first-time-through rate.
Where the Real Loss Happens on an Automotive Line
The cost structure of an automotive defect is not linear — it compounds at every station the unit passes through. A missing fastener caught at the body shop weld booth costs a few cents of rework time. The same missing fastener caught at final inspection, after paint and trim, costs hours of teardown and reprocess. And if it makes it to the customer, you are looking at a warranty claim and a potential recall. The chart below maps how a single defect class inflates as it moves downstream — and where AI vision interception actually pays for itself.
Body Shop — Weld Booth
Missing or misplaced fastener, spot weld count deviation, panel gap out of spec
Paint Shop — Entry
Surface defect, primer coverage gap, masking tape residue carried into the booth
Trim Line — Sub-Assembly
Wrong label, misaligned decal, missing compliance placard, incorrect packaging variant
Final QC — End of Line
VIN mismatch, tire pressure label missing, EPC code unreadable, wrong country-specific pack
Field — Customer / Dealer
Warranty claim, TSB issuance, NHTSA reportable defect, potential recall campaign
Want to calculate the exact escalation cost for your top three defect classes? Book a defect-cost ROI workshop with iFactory's automotive vision team and we will map it against your line rate.
The Measured Impact on First-Time-Through and Scrap
Automotive OEMs and Tier 1 suppliers that have deployed inline AI vision for label and packaging verification report consistent, measurable shifts in the metrics that plant scorecards actually track. These are not pilot-lab numbers — they are production-line results from systems running on existing conveyors, skillet lines, and trim lines at full takt time. The figures below reflect the range reported across publicly available manufacturing studies and iFactory deployment benchmarks.
label and packaging defect detection accuracy at full line speed on trim conveyors
lift in first-time-through rate when inline vision replaces manual end-of-line sampling
average time from defect detection to automated PLC rework routing on a Level 2 line
reduction in scrap cost attributed to packaging and labeling defects within the first six months
The scrap reduction figure is the one that gets the most attention from operations directors, because packaging and label defects are often the largest single contributor to avoidable scrap on trim and final lines. Unlike dimensional or weld defects — which require process engineering changes to fix — label and packaging defects are almost always a verification gap, not a process gap. Close the verification gap and the scrap drops. Talk to an automotive vision specialist about what that reduction looks like on your specific line rate and product mix.
What the Camera Actually Catches on a Moving Trim Line
The most common pushback from plant engineers is that their line runs too fast, or the lighting is too variable, or the product geometry changes too often for a camera to keep up. Modern on-prem GPU inference handles all three. Here is the full defect taxonomy that an AI vision system inspects on every unit, in motion, without slowing the conveyor.
Label & Decal Verification
VIN barcode OCR, tire pressure placard presence, country-specific compliance labels, emissions decals, correct label SKU for build variant
Gap & Flush
Door-to-fender gap, hood-to-fascia flushness, liftgate alignment, headlamp bezel seating, tolerance drift across a batch
Surface & Paint Defects
Orange peel, runs, sags, dirt inclusions, solvent pop, micro-scratches from preceding station handling
Missing Fasteners & Hardware
Bolt presence, stud count, clip seating, torque mark verification, clip orientation on sub-assemblies
Packaging & Component Variant
Correct wheel/tire variant for VIN, seat trim match, mirror cap color, floor mat SKU, correct owner manual pack
Code & Serialization
2D Data Matrix on engine block, RFID tag read, barcode on sub-assembly, EPC code readability for logistics handoff
Three-Way Routing: Pass, Rework, or Scrap — Automatically
Detection without routing is just a photo. The value of inline AI vision is that every defect classification triggers an automated action through your Level 2 PLC or DCS before the unit reaches the next station. The system does not just flag a problem — it physically directs the unit to the correct destination, logs the event, and notifies the right person. This is the routing logic that makes the difference between a vision system and a manufacturing intelligence system.
PASS
No defects detected. PLC tag confirms pass. Unit continues to next station. MES batch record updated with inspection timestamp and image hash.
REWORK
Fixable defect classified. PLC diverts unit to rework spur or offline repair cell. Defect type, image, and repair instructions pushed to rework station display.
SCRAP
Non-repairable defect. PLC routes to scrap chute. QMS auto-generates deviation report. Root-cause tags pushed to engineering dashboard for trend analysis.
Curious how three-way routing would integrate with your existing PLC tags and rework cells? Book an integration walkthrough with iFactory's controls engineering team.
How iFactory Integrates with Your MES, ERP, and QMS
A vision system that does not talk to your manufacturing execution system is a dead-end data silo. iFactory's architecture is built around the identity chain — every image, every defect, every routing decision is tied to the VIN, batch ID, or work order that your MES and ERP already use. That means when a defect trend appears, your quality engineers can trace it back to the exact supplier lot, the exact shift, the exact torque wrench, without leaving the dashboard. Here is how the data flows.
PLC & Machine Layer
Direct tag capture from Level 2 PLC/DCS — conveyor position, station ID, cycle count, torque values, presence sensors. No manual data entry, no OPC-UA middleware if your controls team prefers native tag reads.
Edge GPU Inference
On-prem NVIDIA GPU appliance at line side. Deep-learning models run inference in under 200ms per unit. No cloud round-trip, no latency dependency on plant network uptime, no data leaving your firewall.
iFactory MES Bridge
REST API and OPC-UA connectors map every inspection result to the MES work order, ERP material number, and QMS deviation record. Identity is preserved across every system — one source of truth.
Plant & Enterprise Dashboards
Real-time OEE, first-time-through, scrap cost by defect class, and automated root-cause analysis trending. Drill from plant view to line to station to single unit image in three clicks.
Because the inference runs on-prem, your IT team does not have to worry about cloud egress costs, network latency during a line surge, or data residency issues if you are shipping vehicles internationally. The API layer handles the MES/ERP/QMS integration, and the PLC tag capture handles the machine-level context. Talk to an integration specialist about your specific MES stack — whether you are running SAP DMC, Siemens Opcenter, Rockwell FactoryTalk, or a legacy homegrown system, we have mapped to it before.
Run a Fixed-Price 8-Week Pilot on One Line
iFactory deploys an on-prem AI vision system on a single body, trim, or final assembly line in eight weeks — hardware, models, PLC integration, MES mapping, and dashboard live. Fixed price, fixed scope, measured ROI before you roll out to the rest of the plant.
The 8-Week Pilot Timeline — What Actually Happens
The reason most vision projects stall is that nobody owns the integration. The controls team thinks it is an IT project. IT thinks it is a controls project. Quality thinks it is a capital project. iFactory's pilot is structured so that by week eight, you have a live system on one line with measured before-and-after data — not a slide deck promising future value. Here is the week-by-week breakdown.
Line Audit & Defect Taxonomy
Walk the line with your process and quality engineers. Catalog the top 10 defect classes by cost and frequency. Map conveyor speeds, lighting conditions, PLC tag structure, and MES identity fields. Define pilot success metrics.
Hardware Spec & Mounting Design
Camera selection, lensing, enclosure, lighting (structured light, polarized, IR depending on surface). Mechanical mounting design that does not interfere with conveyor access or maintenance paths. Power and network drops planned.
Installation & Image Capture
Cameras and GPU appliance installed line-side. System captures images of every unit at production speed for model training — no line stoppage required. PLC tag capture configured and verified against actual cycle data.
Model Training & Tuning
Deep-learning models trained on your actual defect images — not a generic library. Iterative tuning with your quality team reviewing edge cases. False reject rate driven below 2% before routing goes live.
PLC Routing & MES Integration Live
Three-way pass/rework/scrap routing activated through Level 2 PLC. MES bridge writes inspection results to batch records. QMS deviation reports auto-generate on scrap events. Operators trained on rework station displays.
Baseline vs. Pilot Report
Before-and-after data on first-time-through, scrap cost, rework hours, and defect detection rate. ROI worksheet delivered with projected plant-wide rollout savings. Go/no-go decision for expansion.
Ready to put a fixed-price pilot on your highest-scrap line? Book a pilot scoping call and we will bring the ROI worksheet to the first meeting.
Manual Sampling vs. Inline AI Vision — Side by Side
If you are still weighing whether inline AI vision is worth the capital versus adding another inspector or tightening your sampling plan, this comparison lays out the operational differences. The cost of a human inspector is not just their hourly rate — it is the defect that slips through between samples, the time it takes to trace a found defect back to its root cause, and the scrap that accumulates while the corrective action works its way through the shift.
Expert Perspective
We were running 58 jobs an hour on trim and catching maybe one in seven label defects with our sampling plan. The ones we missed showed up at final QA — or worse, at the dealer. After we put inline vision on the line, the first week we found out we had a tire placard supplier sending us the wrong pressure spec for a Canadian build variant. That alone would have been a field action. The system paid for itself before the pilot was over. What surprised me was the gap-and-flush data — we thought our door alignment was fine, and it turns out we had a slow drift on the left-side fixture that nobody caught because it was within the manual gauge tolerance but trending out. The camera saw the trend three weeks before we would have.
— Marco Velasquez, Plant Quality Manager, Tier 1 Automotive Assembly Plant (320K units/year)
from line audit to live pilot with measured before-and-after data
false reject rate achieved before routing goes live on the line
of units inspected and indexed — no sampling, no gaps between shifts
Stop Catching Label Defects at Final QC
Every unit that reaches end-of-line with a packaging or label defect has already cost you paint, trim, and assembly time. iFactory's inline AI vision catches it on the conveyor, routes it automatically, and writes it to your MES — so your scrap cost drops and your first-time-through rate climbs within the first quarter.
Frequently Asked Questions
Can AI vision inspect labels and packaging on units moving at full automotive line speed?
Yes. Modern on-prem GPU inference — specifically NVIDIA edge appliances — processes each unit in under 200ms, which is fast enough for conveyor speeds up to 20 meters per minute typical of body, trim, and skillet lines. The cameras use strobed LED lighting and global-shutter sensors to eliminate motion blur, so image quality is consistent regardless of line speed. The system inspects 100% of units, not a sample.
How does the system integrate with our existing PLC and MES?
iFactory captures PLC tags directly from your Level 2 controller — conveyor position, station ID, cycle count — to establish unit identity and timing. Inspection results are mapped to your MES work order and ERP material master via REST API or OPC-UA. When a defect is detected, the system writes a PLC tag that triggers the diverter or rework spur, and simultaneously creates a QMS deviation record linked to the VIN or batch ID. No manual data entry is required at any point in the chain.
What happens if the AI flags a good unit as a defect — a false reject?
False reject rate is the single most important model metric we tune before routing goes live. During weeks 5 and 6 of the pilot, your quality team reviews edge cases alongside iFactory engineers and the model is iteratively retrained until the false reject rate is below 2%. Any unit flagged for rework can be reviewed by a human at the rework station display — the image, defect classification, and confidence score are all shown. If the operator confirms it is a false reject, that feedback is automatically fed back into the model for continuous improvement.
Do we need to send our data to the cloud for inference?
No. All inference runs on an on-prem NVIDIA GPU appliance installed at line side. No images, no VIN data, no production data leaves your plant network. This eliminates cloud egress costs, removes latency dependencies on plant internet uptime, and avoids data residency issues for plants shipping to international customers. The only data that optionally leaves the plant is anonymized model performance metrics for iFactory's remote monitoring and support — and even that can be disabled if your IT security policy requires it.
What does the fixed-price 8-week pilot actually include?
The pilot includes the full hardware package (cameras, lenses, lighting, enclosures, GPU appliance), mounting and installation on one line, PLC tag capture and three-way routing integration, MES/ERP identity mapping, model training on your actual defect images, operator training, and a baseline-versus-pilot report with a measured ROI worksheet. The price is fixed before the engagement begins — no change orders for integration complexity or model retraining cycles. Book a pilot scoping session to get a quote for your specific line.