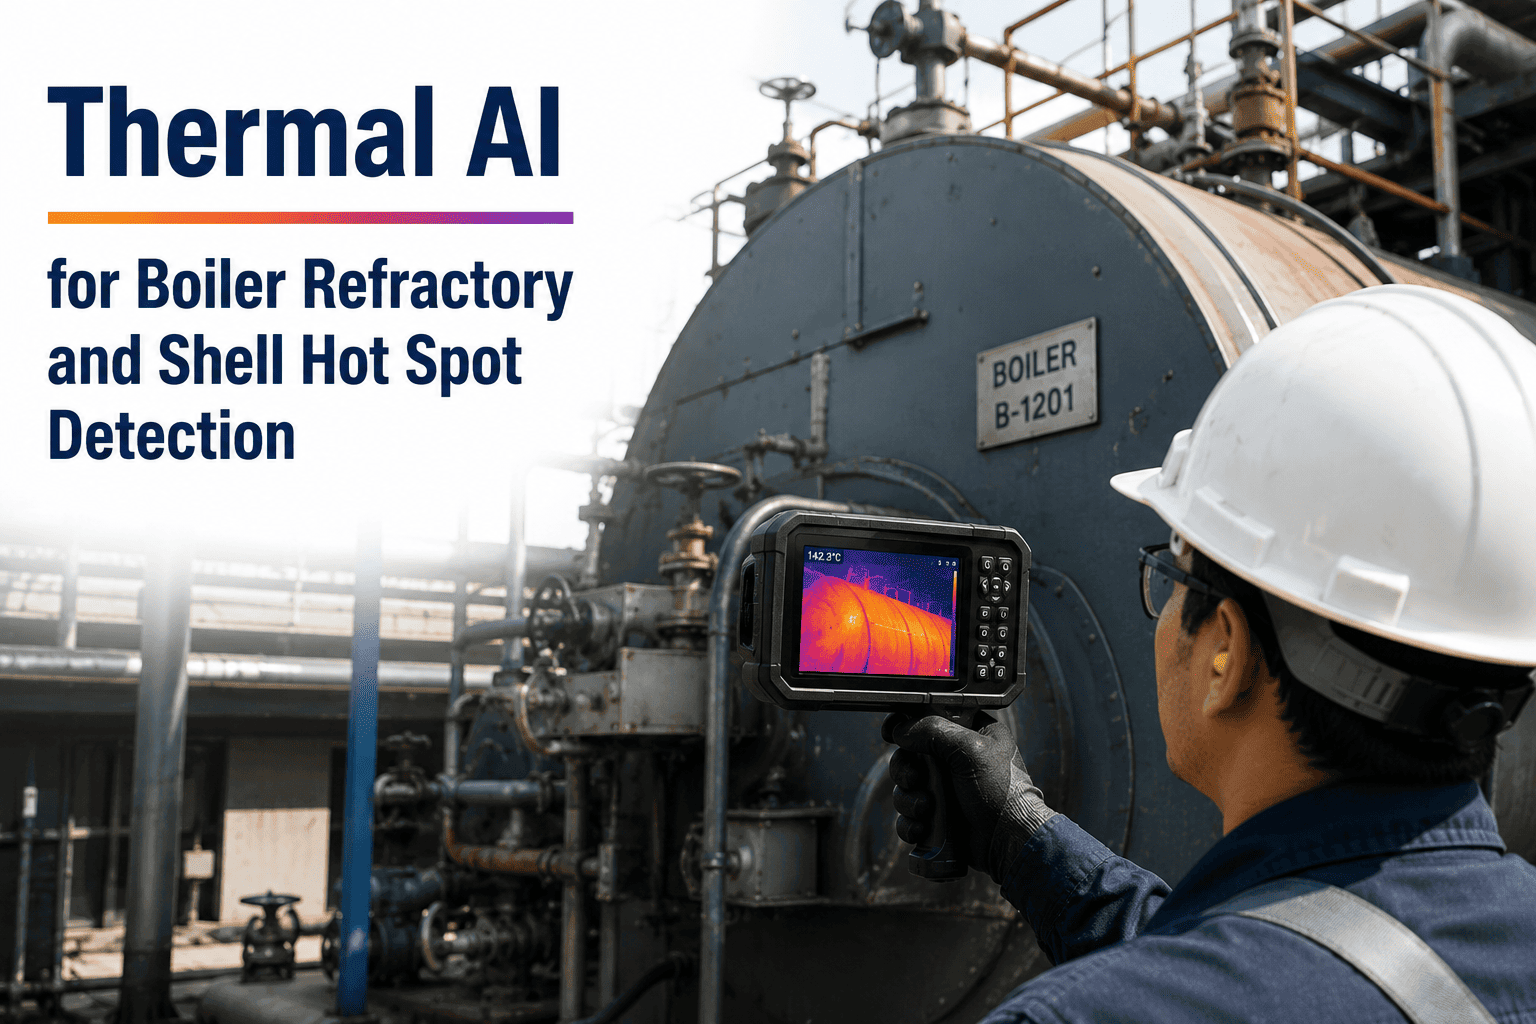
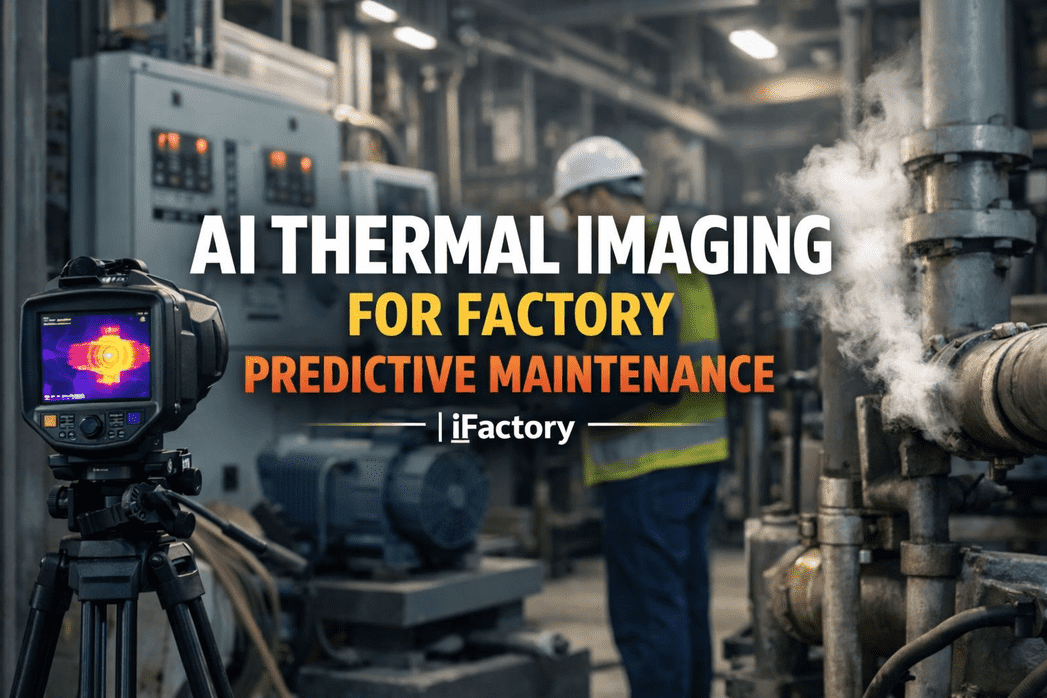
When a refractory panel spalls out at 2:47 AM on Sunday, the boiler shell behind it starts climbing 3 to 5 degrees Celsius per hour, the graveyard shift will spot a warm patch on the casing when they walk the deck at 5 AM, and by then the plant has been running with a compromised pressure boundary for two and a half hours. This is exactly the gap that quarterly thermographer walkthroughs are structurally incapable of closing — a handheld camera at 10 AM on a Tuesday does not see what happens at 3 AM on a Sunday, and most refractory failures develop precisely in those unmonitored windows. Fixed thermal AI cameras rewrite the coverage math: every square meter of shell, every waterwall zone, and every refractory-lined transition piece is imaged and analyzed continuously, 8,760 hours a year, with anomaly detection running against a moving thermal baseline. You can book a demo to see how iFactory's continuous thermal monitoring runs on a boiler like yours.
24/7 THERMAL AI · CONTINUOUS MONITORING · REFRACTORY · SHELL HOT SPOTS
Continuous Thermal AI That Sees the 3 AM Anomaly Nobody Else Is Watching
iFactory deploys fixed thermal cameras across boiler shells, waterwall zones, and refractory transitions, streaming imagery to an on-premise AI engine that flags hot spots, slag accumulation, and refractory degradation the moment they deviate from baseline. No walkthrough schedule, no missed windows.
Monitored Thermal Range Across the Boiler Envelope
60°C
120°C
250°C
600°C
1200°C
1800°C
Shell surface to combustion zone, imaged in real time on the same AI platform
THE 3 AM BLIND SPOT
Manual Thermography Covers Ten Percent of the Year, Failures Happen in the Other Ninety
Handheld thermal inspections are indispensable for detailed diagnostics but structurally cannot deliver continuous coverage. A typical utility runs one to four full thermal surveys per year during business hours, which adds up to roughly 40 to 160 hours of coverage against an 8,760-hour operating year. The clock grid below shows what that gap looks like when set next to fixed thermal AI monitoring.
Handheld Thermographer
~40 to 160 hours per year of coverage
00
01
02
03
04
05
06
07
08
09
10
11
12
13
14
15
16
17
18
19
20
21
22
23
Weekdays only, a few weeks per year — everything else runs unwatched.
iFactory Continuous Thermal AI
8,760 hours per year of coverage
00
01
02
03
04
05
06
07
08
09
10
11
12
13
14
15
16
17
18
19
20
21
22
23
Every hour of every day, including nights, weekends, and holidays.
SHELL TEMPERATURE THRESHOLDS
Four Temperature Bands That Define When to Watch, Plan, and Act
Boiler shell temperature is not a single-threshold problem. Refractory-lined pressure vessels operate with well-defined thermal bands, and the disposition depends on where the reading sits and how fast it is changing. iFactory's engine grades every pixel against these bands and factors in rate of change over hours rather than just the instantaneous reading.
ALERT
120 to 180 degrees C
CRITICAL
180 degrees C plus
Normal Envelope
Refractory and insulation performing to design. Shell surface reads in the low tens of degrees above ambient. AI system logs the baseline continuously, updating the reference profile as ambient conditions and boiler load vary.
Watch Threshold
Early refractory thinning or minor slag deposit shifting internal heat transfer. No immediate action needed but the anomaly is trended, and rate of change is monitored. Repair added to the next planned outage scope.
Alert Threshold
Significant refractory degradation or an insulation void behind the shell. Operations receives an automated alert with thermal image evidence. Plant reliability team reviews within the shift and plans intervention.
Critical Threshold
Refractory burn-through risk, tube overheating, or shell temperature approaching material limits. Immediate operator notification with recommended load reduction and inspection priority. Escalation path routed to plant management.
SIX THERMAL SIGNATURES
The Failure Patterns AI Recognizes Against a Learned Thermal Baseline
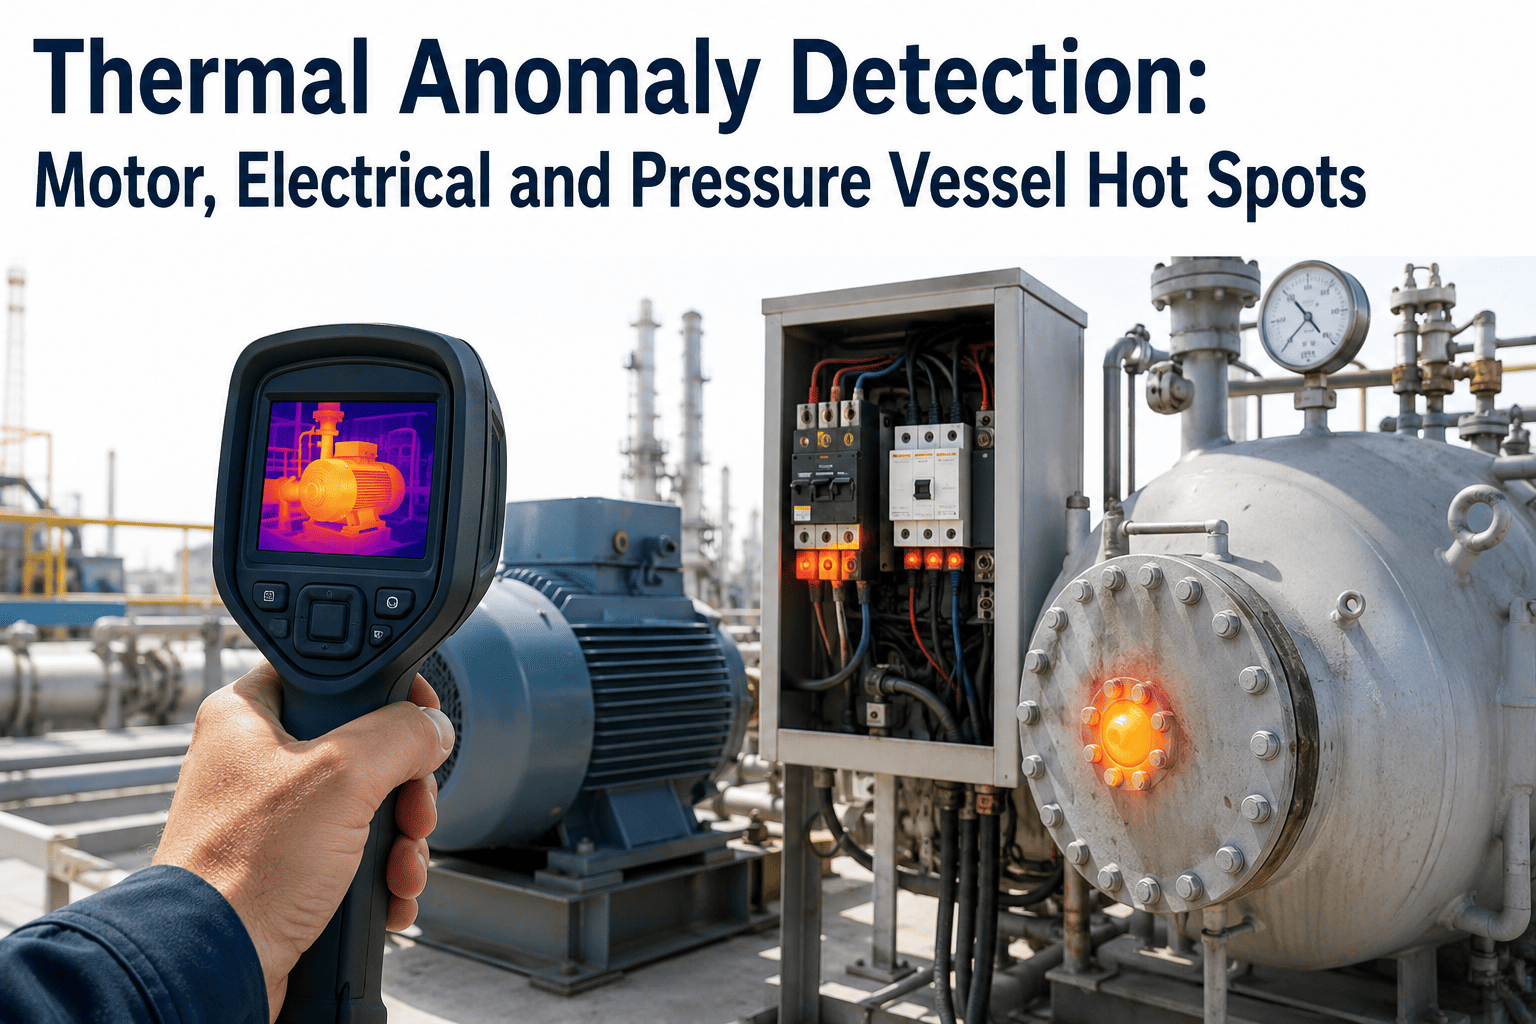
Every boiler failure mode produces a characteristic thermal fingerprint. iFactory's model is trained to distinguish between six dominant signatures, so the alert your team sees is not just a temperature spike but a classified failure mode ready for a work order.
SIGNATURE 01
Refractory Thinning
Gradual localized shell temperature rise over days to weeks, with a smooth thermal gradient centered on the thinning zone.
SIGNATURE 02
Refractory Spall Void
Sharp-edged discrete hot spot with a steep thermal gradient at its boundary, appearing rapidly rather than trending in.
SIGNATURE 03
Slag Accumulation
Internal waterwall temperature drops in the slagged zone while adjacent zones read hotter, indicating displaced heat flux.
SIGNATURE 04
Tube Overheating
Bright linear signature on the waterwall or superheater surface tracking the length of the affected tube run.
SIGNATURE 05
Burner Impingement
Asymmetric temperature elevation on the waterwall opposite a specific burner, indicating flame pattern shift or misalignment.
SIGNATURE 06
Cooling Circuit Blockage
Loss of the normal cooled-surface thermal gradient, with the affected area running hotter than its immediate neighbors.
MONITORED BOILER ZONES
Every Zone That Matters, Mapped to Its Operating Thermal Range
A single thermal camera cannot see the whole boiler. iFactory's deployments combine external shell-monitoring cameras with high-temperature internal viewers to cover every failure zone that matters. Each zone has its own operating temperature range and its own dominant failure signatures.
Refractory thinning, insulation voids, spall progression, shell weld degradation
Up to 1200 degrees C internal
Brick displacement, castable degradation, slag adhesion, thermal shock cracking
600 to 800 degrees C surface
Localized overheating, slag build-up, flame impingement patterns, membrane weld stress
520 to 620 degrees C metal
Creep bulging hot signatures, short-term overheating, ash deposit thermal shift
1400 to 1800 degrees C flame
Flame position drift, burner tip erosion, atomizer wear, combustion imbalance
150 to 250 degrees C flue gas
Acid dew-point corrosion patterns, fly ash blockage, cold-end thermal shift
See Continuous Thermal Monitoring Running on Your Boiler Configuration
iFactory's engine flags refractory hot spots, slag accumulation, and tube overheating against a moving baseline built for your specific unit. Book a demo to see the alert flow, threshold gauges, and zone dashboards on a live sample deployment.
MANUAL VERSUS CONTINUOUS
Why Periodic Thermography Cannot Match Continuous AI Coverage
Every plant that runs handheld thermal inspection programs knows the value of thermal data. The question is not whether thermography works — it is whether periodic coverage catches failures that develop over days rather than months. The split below shows what the two approaches actually deliver in the field.
Handheld Thermography
Coverage Window
Scheduled walkthroughs during business hours only
Detection Latency
Weeks to months between inspection intervals
Alert Response
Manual reporting after thermographer returns to office
Anomaly Trending
Report to report comparison, inconsistent framing
Baseline Reference
Static design values or last inspection reading
iFactory Continuous AI
Coverage Window
Every hour of every day, 8,760 hours a year
Detection Latency
Minutes from anomaly emergence to graded alert
Alert Response
Automated notification with image evidence and severity
Anomaly Trending
Per-pixel history with rate-of-change analysis over time
Baseline Reference
Adaptive baseline that tracks load and ambient conditions
CAMERA DEPLOYMENT
Camera Architecture Built for the Reality of Boiler House Conditions
Thermal AI is only as strong as the imagery feeding it. iFactory deploys a mix of fixed shell cameras, high-temperature internal viewers, and mid-range zone monitors so no critical surface is left out. All streams are processed on-premise with zero cloud dependency and integrate directly into the plant control network.
Shell Monitoring Cameras
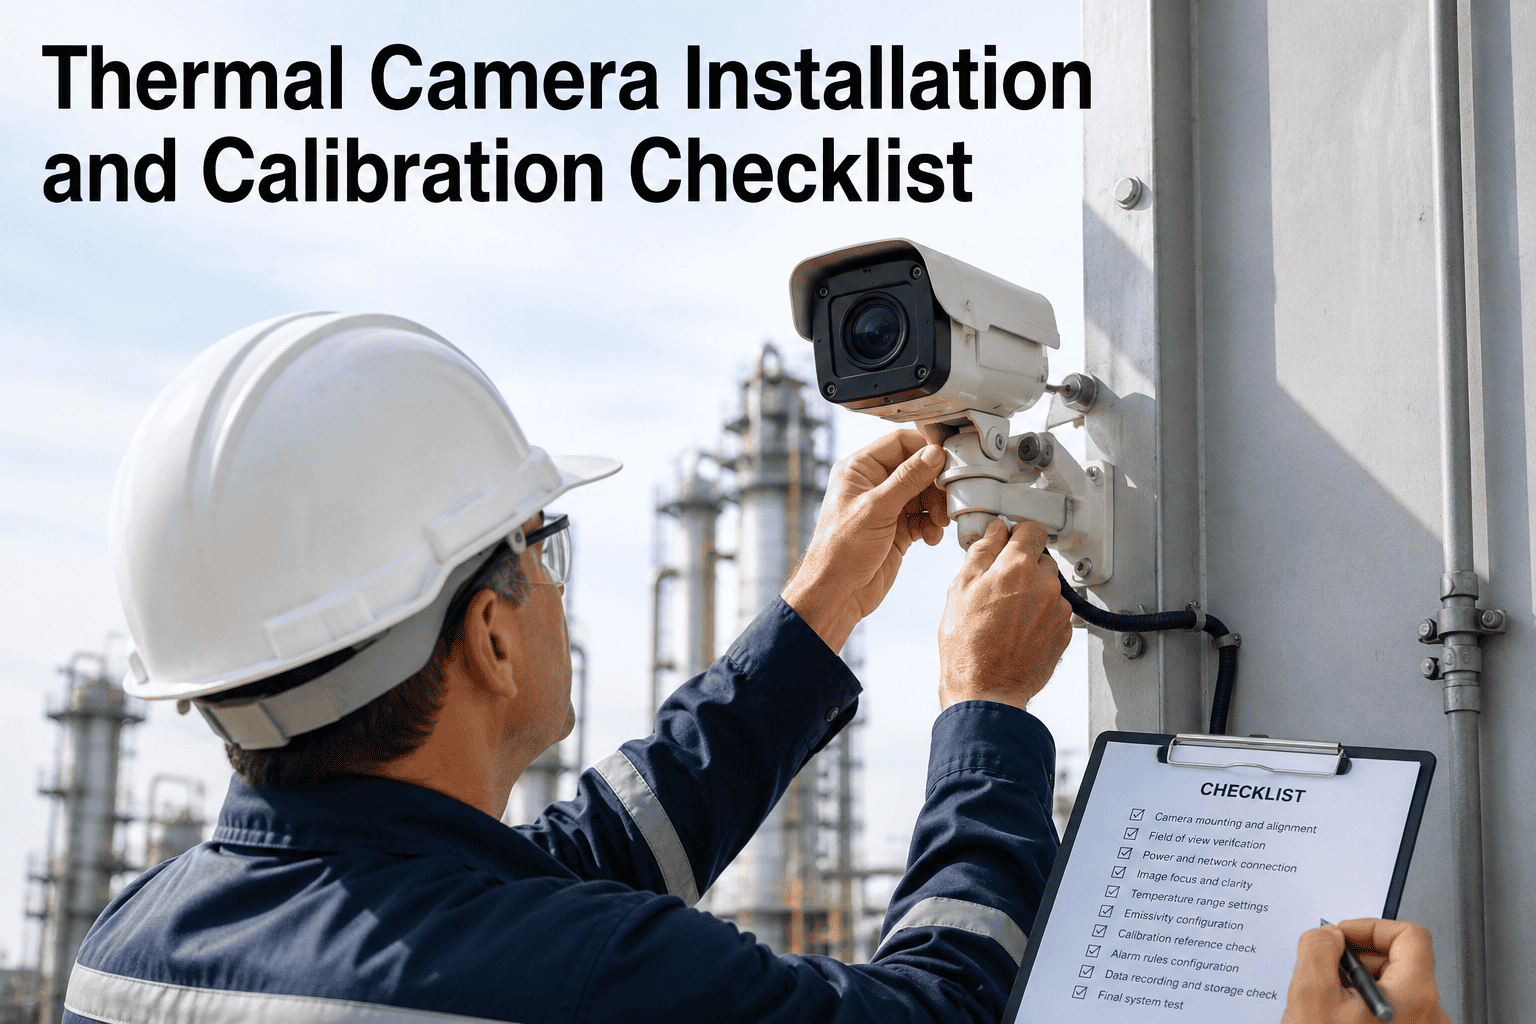
Fixed IR cameras mounted on structural steel around the boiler exterior, imaging the full shell envelope at 30 frames per second. Temperature accuracy within 2 degrees C, resolution sufficient to detect discrete hot spots down to 5 centimeter diameter at typical stand-off distances.
High-Temperature Furnace Viewers
Air-cooled or water-cooled probes mounted through inspection ports, imaging combustion zones from 500 to 1800 degrees C. Automatic retraction on cooling loss or overtemperature protects the optics. Deep-view lenses see through flame and dust to reach waterwall surfaces.
Refractory Transition Monitors
Compact mid-range cameras aimed at high-risk transitions like burner throats, arch refractory, and roof castable regions where spalling and hot ingress are common failure modes. Designed for ambient temperatures up to 300 degrees C at mount point.
Edge Processing on NVIDIA Jetson
All video streams process locally on NVIDIA Jetson Orin AGX units installed in the plant. No frame ever leaves the plant network, meeting the strict data residency and network isolation policies of NERC-registered generators and industrial operators.
DETECTION WORKFLOW
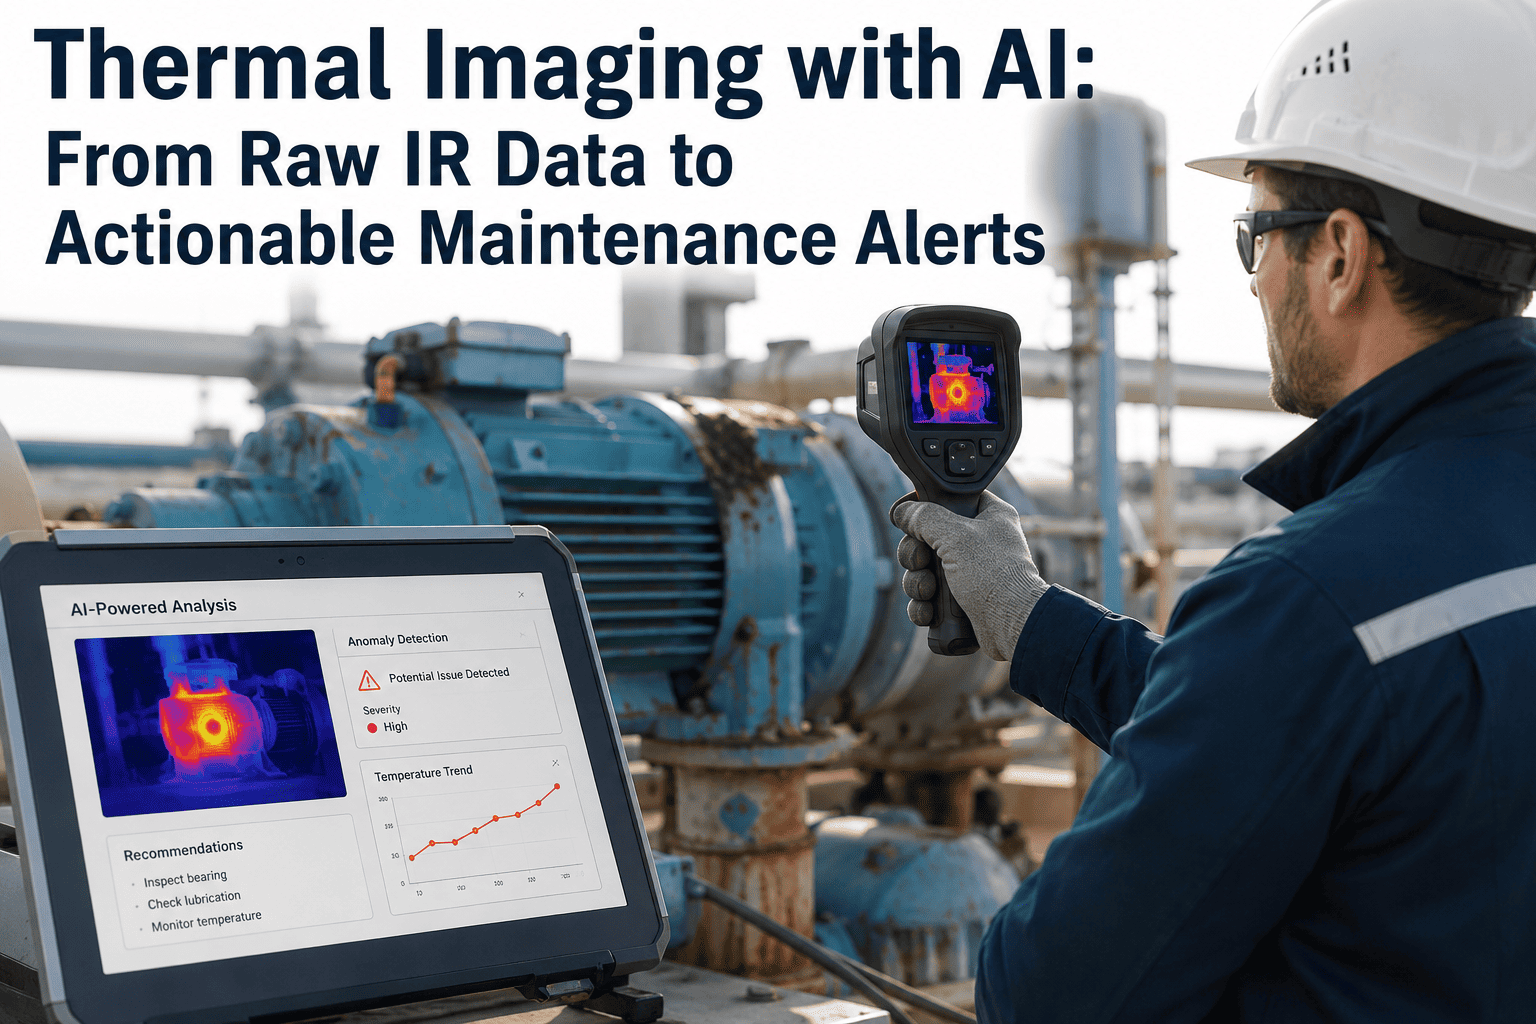
From Live Pixel to Prioritized Alert in Under a Minute
Continuous monitoring is only useful if the right person sees the right anomaly at the right severity. iFactory's detection workflow is engineered to move a thermal deviation from raw pixel data to a graded work order in operator-relevant time — not the following morning, not the next shift, but before the anomaly has time to progress.
STEP 1
Ingest and Baseline
Every frame from every camera is timestamped, tagged with camera location and boiler zone, and compared against the adaptive thermal baseline for that pixel under current load and ambient conditions.
STEP 2
Anomaly Detection
The AI model runs anomaly detection at pixel level, flagging deviations that exceed a load-adjusted threshold. Deviations are cross-checked against neighboring pixels to filter noise and confirm the anomaly is a real thermal event.
STEP 3
Signature Classification
Confirmed anomalies are classified against the six failure signatures. The model outputs a signature label, a severity grade, a spatial mask showing the affected area, and a rate-of-change projection for the next 24 hours.
STEP 4
Alert Routing
Alerts route through configured channels to control room screens, mobile devices, and CMMS work order queues. Severity determines the routing path: watch-level trends log silently, alert-level anomalies notify the shift, critical-level events page management.
DEPLOYMENT OUTCOMES
Measured Impact on Plants Running Continuous Thermal AI
The results below reflect aggregated outcomes from iFactory thermal deployments at coal-fired, biomass, and combined-cycle facilities during the first twelve months of operation. Site-specific results vary with unit vintage, existing thermography maturity, and camera coverage density.
8,760
hours per year
Continuous Boiler Coverage
Every hour of every day, versus the 40 to 160 hours per year delivered by scheduled handheld thermographer walkthroughs.
Under 60
seconds
Alert Latency
Time from a graded anomaly emerging to notification landing on the control room screen with image evidence attached.
$200K plus
per outage
Scaffolding Cost Eliminated
Fixed thermal coverage removes the need for large-scale scaffolding just to run thermographer walkthroughs during outage windows.
Zero
cloud dependency
On-Premise Processing
All frames processed locally on NVIDIA Jetson edge hardware, satisfying NERC CIP and utility-grade data residency requirements.
FREQUENTLY ASKED QUESTIONS
Questions Plant Reliability and Operations Teams Ask About Thermal AI
How does the adaptive baseline handle the fact that our boiler runs at different loads throughout the day?
The adaptive baseline is a per-pixel reference profile that is conditioned on plant load, ambient temperature, and firing rate rather than a single fixed number. During the calibration phase the system observes several weeks of normal operation across the full load range, building a load-dependent expected temperature map for every camera view. When the current reading is compared to baseline, the comparison uses the appropriate profile for the current operating condition, so a genuine anomaly is not masked by a normal load change and a normal load change does not trigger a false alarm.
Book a demo to walk through the baseline calibration process for your unit.
Can the cameras handle the ambient conditions around a boiler house, including heat, dust, and vibration?
Shell monitoring cameras are rated for continuous operation at mount-point ambient temperatures typical of boiler house steel, with IP-rated enclosures against dust and moisture ingress. High-temperature internal viewers use air-cooled or water-cooled probe assemblies that isolate the optics from the furnace environment, with automatic retraction on cooling loss or overtemperature to protect the equipment. Vibration mounts and structural bracing are engineered per site during the deployment phase to prevent image blur from adjacent rotating equipment.
Contact support to discuss the environmental spec for your specific installation.
What happens if the AI misses a real anomaly or generates too many false alerts in the first weeks?
Initial deployment runs in shadow mode for two to four weeks, where alerts are generated but not routed to the control room. During this period the plant reliability team reviews every flagged event, confirming true positives and correcting false alarms. The feedback tunes the anomaly detection thresholds and updates the signature classification model for the specific unit. Typical false positive rate drops from around 8 to 10 percent at initial deployment to under 2 percent after the shadow-mode calibration completes, and true anomaly recall rises above 95 percent.
Book a demo to see how the shadow-mode calibration process works.
Does the system integrate with our existing DCS or CMMS, or does it operate as a standalone monitoring layer?
iFactory is designed to integrate with existing plant control and maintenance systems rather than replace them. Graded alerts flow to control room DCS screens via standard industrial protocols, image evidence is embedded in the alert payload, and confirmed anomalies open work orders in the plant CMMS with severity, location, and recommended action pre-populated. The system also stands alone if the plant prefers to operate it as a separate monitoring layer during initial deployment, and can be phased into DCS and CMMS integration on the plant's own schedule.
Contact support to discuss integration with your specific control system.
Are we going to lose the ability to run handheld thermal inspections for detailed diagnostic work?
Continuous thermal AI does not replace handheld thermography — it changes what your thermographer spends time on. Instead of walking the same shell surfaces looking for anomalies that might not exist, the thermographer becomes the exception-handling expert who investigates the graded alerts the AI flags, performs detailed diagnostics on confirmed events, and validates the baseline as boiler conditions evolve. The role becomes higher-value and more targeted, and detailed inspections happen with the benefit of continuous thermal history rather than a cold start each time.
Book a demo to see how the two workflows combine in practice.
Stop Trusting a Quarterly Walkthrough to Catch a 3 AM Refractory Failure
iFactory's continuous thermal AI watches every zone of your boiler around the clock, grading every anomaly against a learned baseline and routing alerts before the shift changes. Book a demo to see the platform on a live sample deployment.