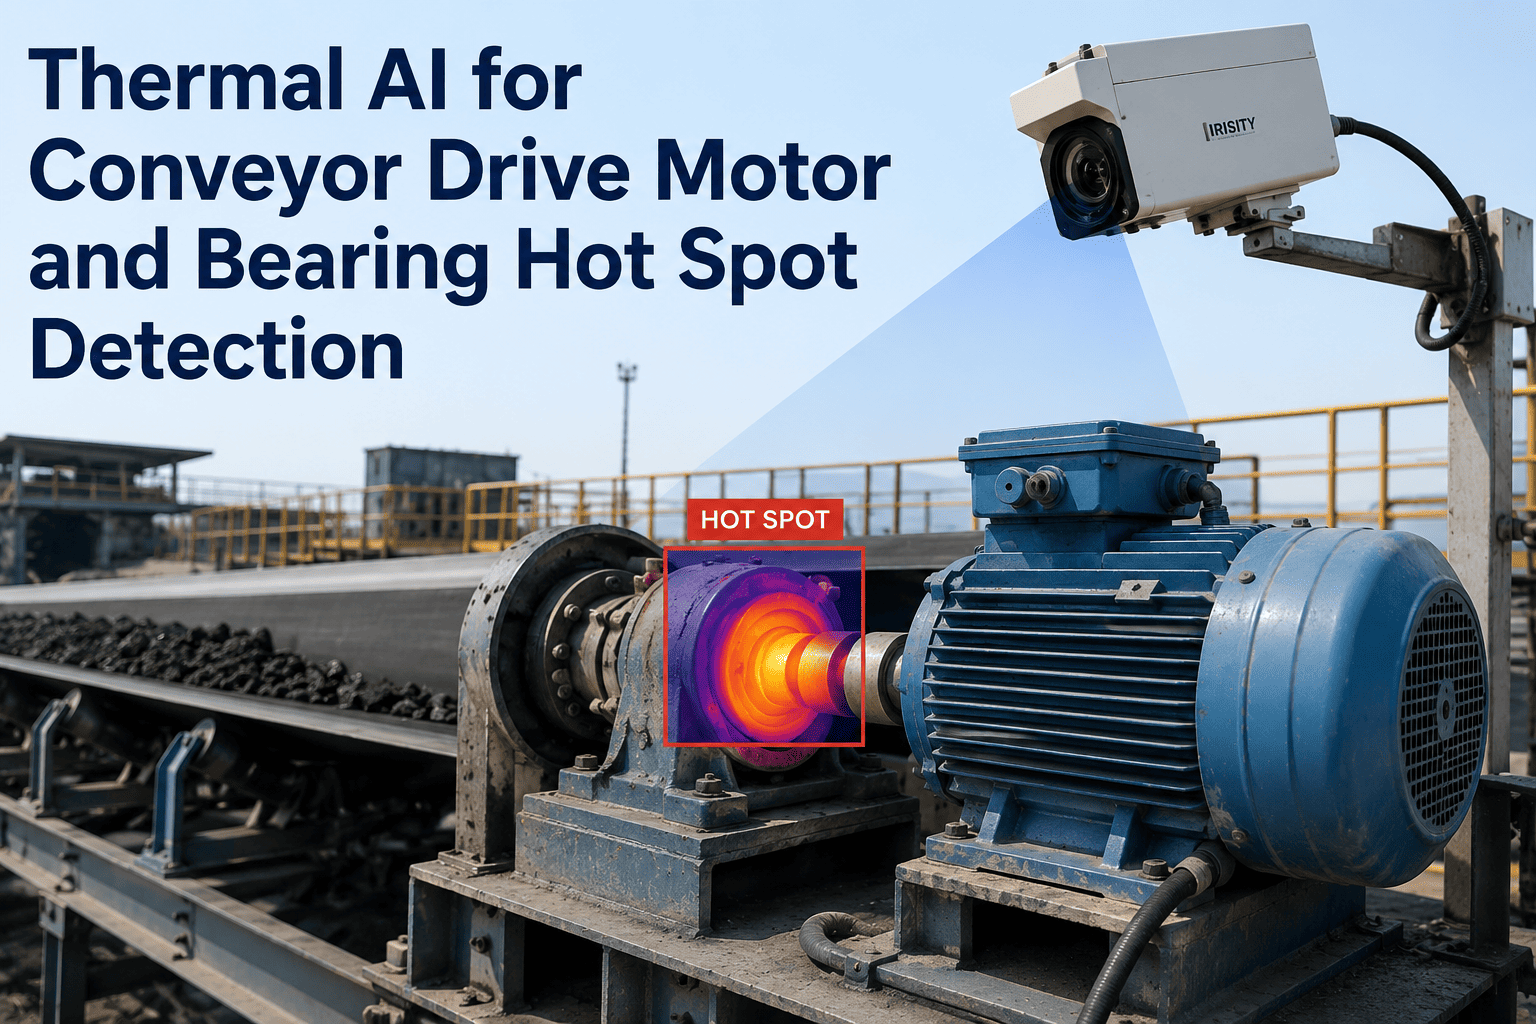
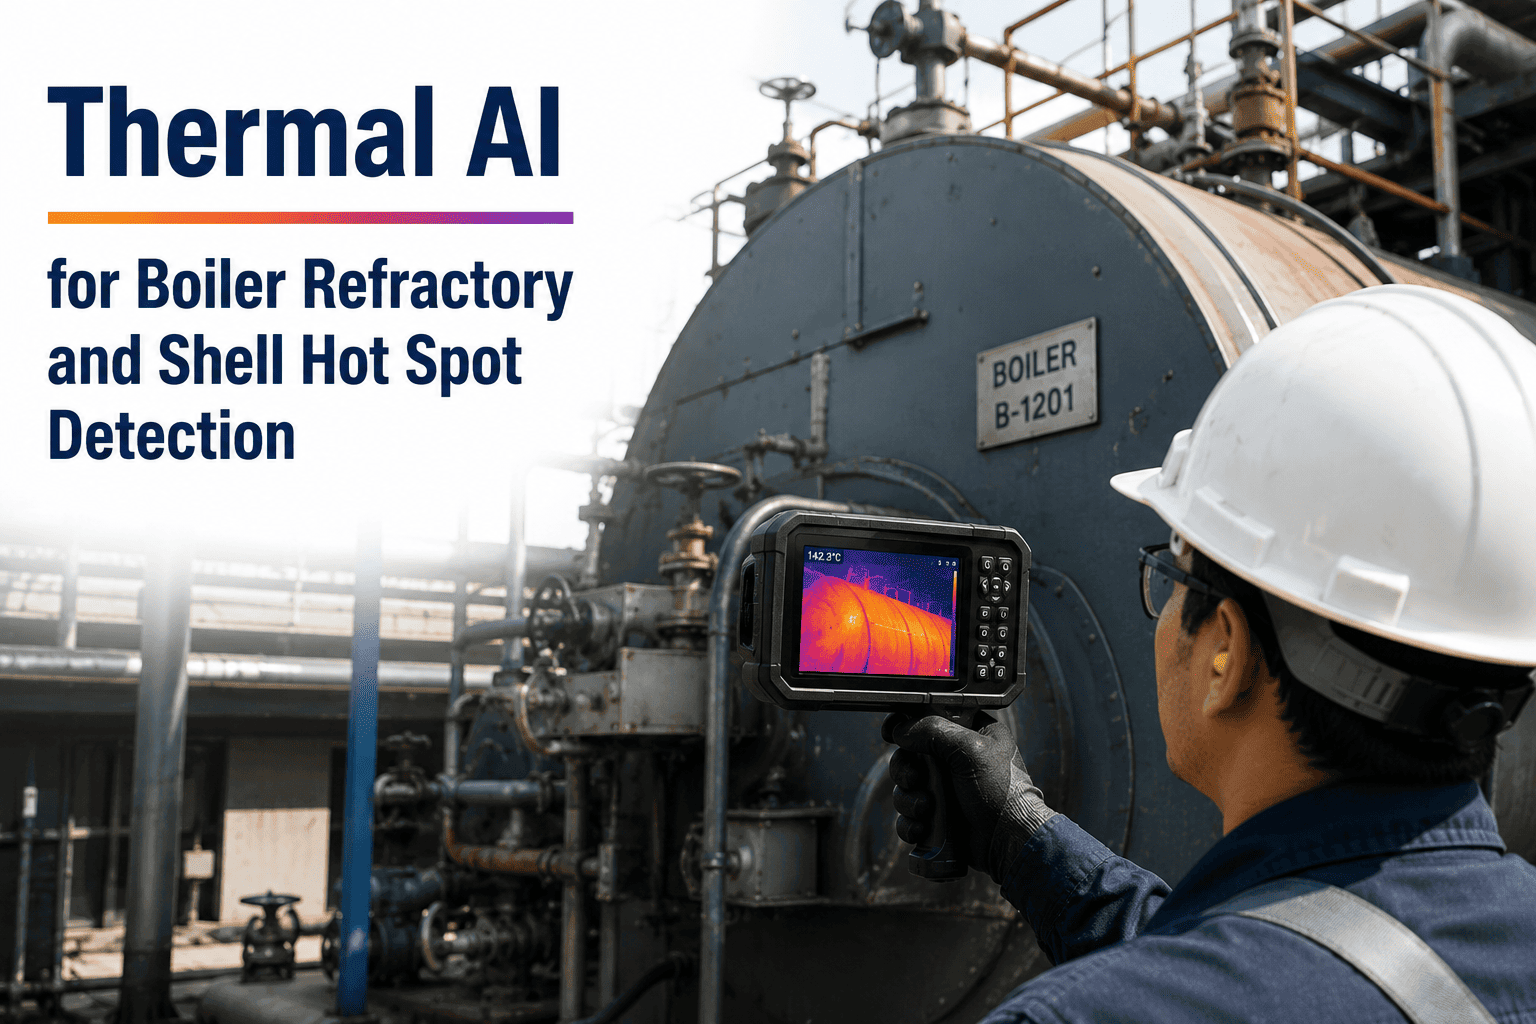
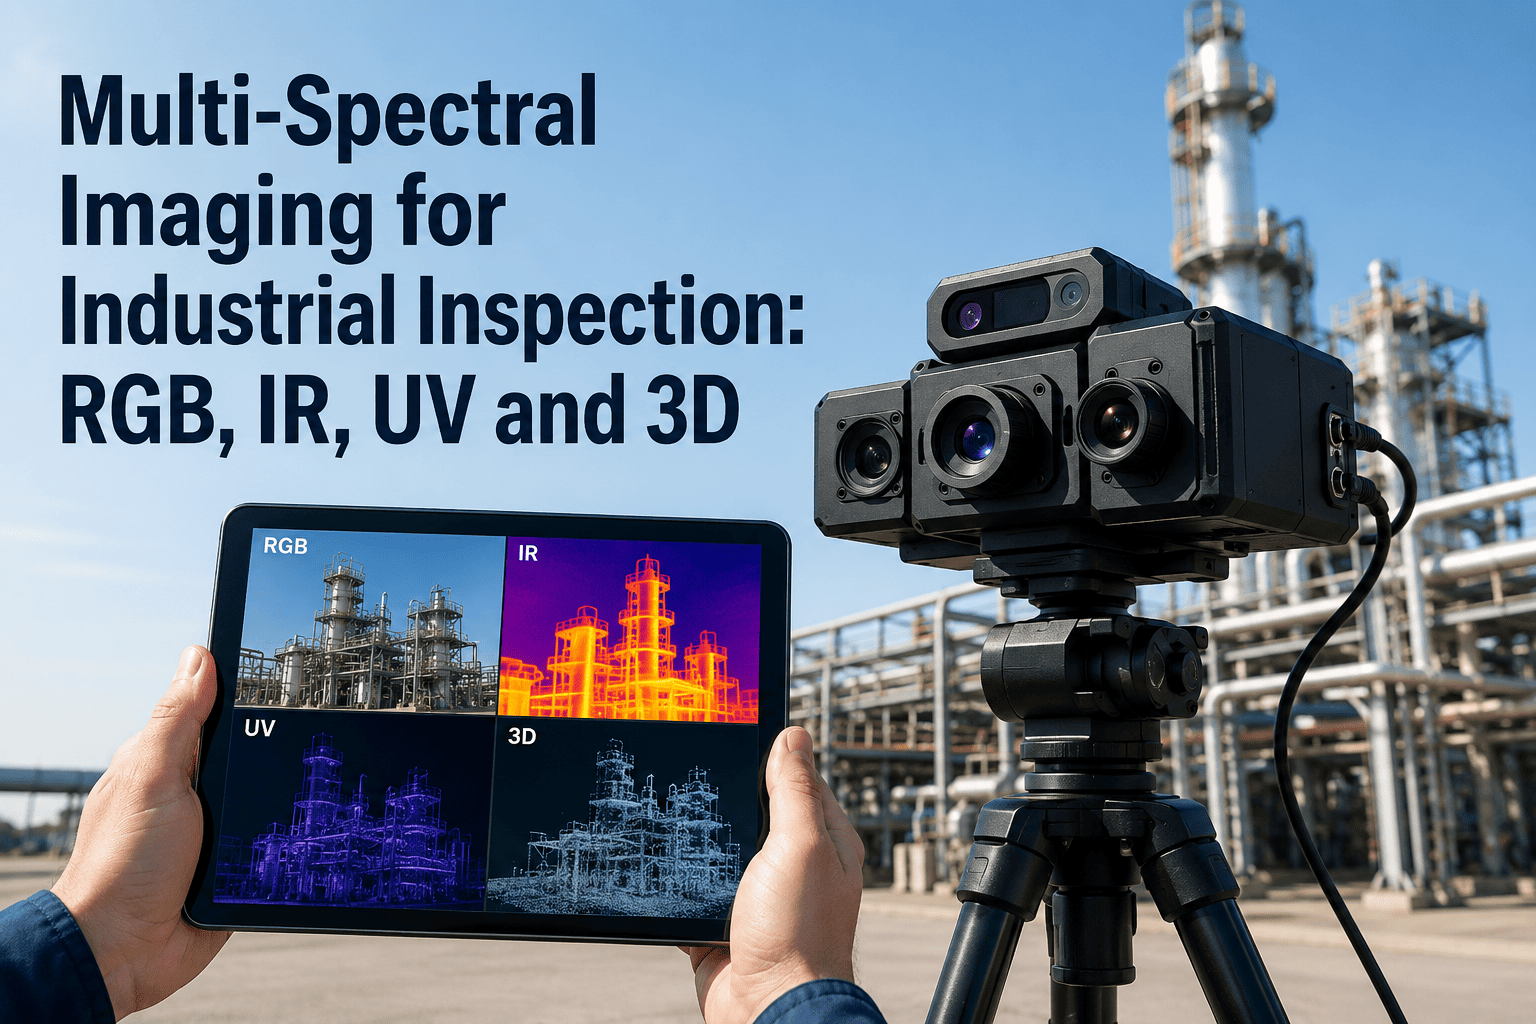
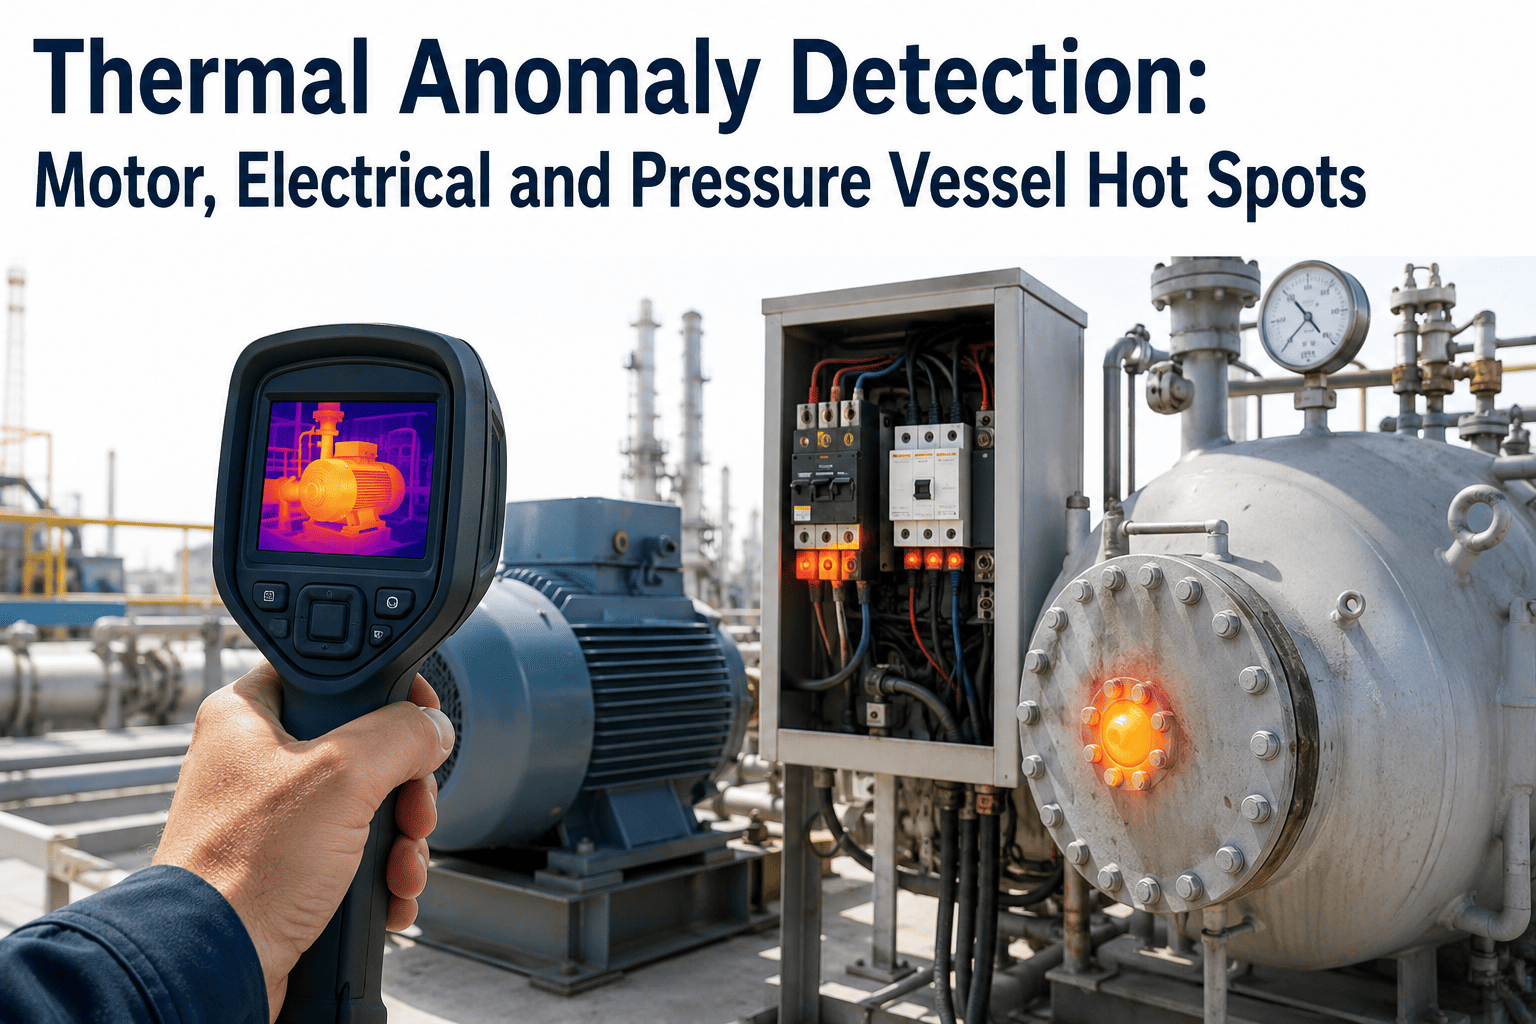
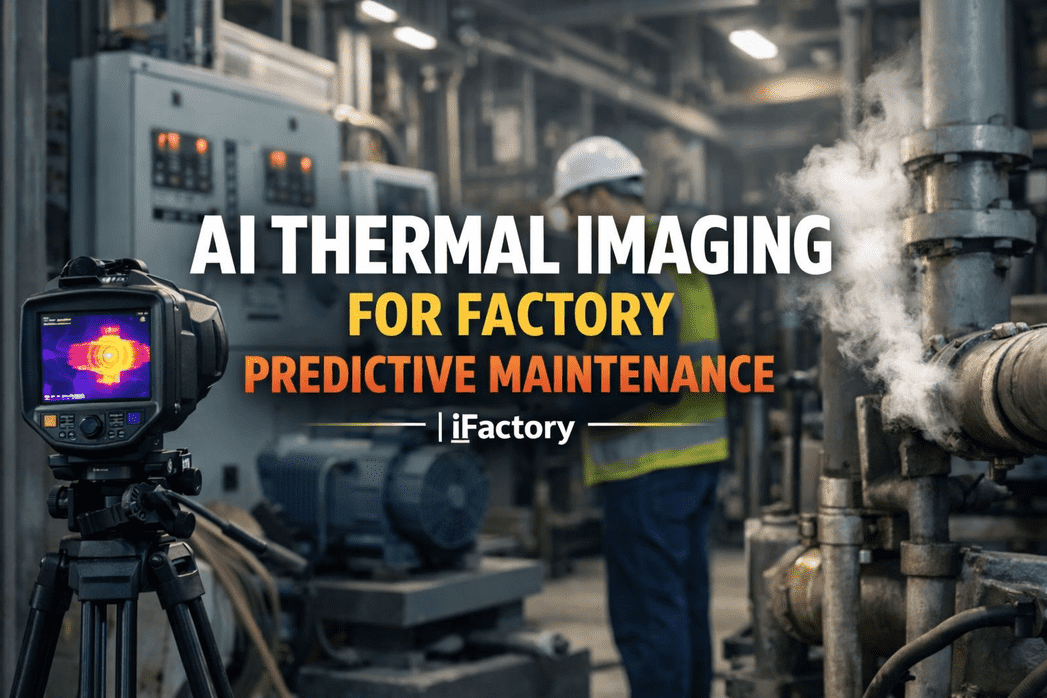
Heat is usually the first honest signal a conveyor drive gives before it fails, showing up in a bearing or motor winding well before a vibration alarm trips or a technician hears anything unusual on a walk-by. Most plants still only check drive temperature with a handheld infrared gun on a periodic route, which means the gap between checks is exactly where a slow bearing seizure or winding insulation breakdown does its damage. Thermal AI cameras watch drive motors, bearings, and gearboxes continuously, and our conveyor monitoring team can help you map out where thermal coverage would matter most on your drive stations.
Conveyor Monitoring
Catch the Heat Before It Becomes a Failure
A conveyor drive station rarely fails without warning. Friction from a degrading bearing or a loosening coupling shows up as a slow, steady temperature rise long before the fault becomes audible or visible, and thermal AI is built to catch exactly that kind of gradual drift.
Thermal Zones Tracked
Motor winding surface
Drive-end bearing housing
Gearbox casing
Coupling and shaft alignment point
Why Drive Failures Are Almost Always a Heat Story First
A motor, bearing, or gearbox that is about to fail generates excess heat well before it generates excess noise or vibration that a person can perceive without instruments. A bearing running low on lubrication builds friction gradually, and that friction shows up as a rising surface temperature over hours to days before the bearing's internal clearances degrade enough to produce an audible grind. The same pattern holds for a motor winding developing an insulation fault or a gearbox running with degraded lubricant viscosity. Handheld thermal gun checks on a route only capture a single point-in-time reading, which means the actual rate of temperature rise, the single most useful diagnostic signal, is rarely captured at all.
Motor Winding
Rising surface temperature on the motor housing often reflects an internal winding or insulation issue that will eventually trip a thermal overload if left unaddressed.
Drive-End Bearing
The drive-end bearing carries the highest radial load on the shaft and is typically the first component to show a temperature rise when lubrication starts to break down.
Gearbox Casing
An overall rise in gearbox casing temperature, rather than a single hot point, often points to degraded lubricant viscosity or an internal gear mesh issue.
Coupling Point
A localized hot spot at the coupling frequently indicates a developing shaft misalignment that is generating friction at the connection point.
Want to see which of these four zones has the highest failure history on your drive stations?
Book a walkthrough to review a sample thermal trend from a comparable drive.
Reading Temperature Trends, Not Just Single Readings
| Temperature Pattern | Likely Condition | Recommended Response |
| Gradual rise over days to weeks |
Lubrication breakdown or gradual bearing wear |
Schedule lubrication check or bearing inspection at next planned stop |
| Sudden rise over hours |
Acute lubrication loss or developing misalignment |
Flag for near-term inspection before the next scheduled maintenance window |
| Localized hot spot at one point |
Point-source friction, often coupling or a single bearing race |
Target inspection at the specific flagged location rather than the whole drive |
| Elevated but stable temperature |
Consistent with normal operating load for that drive |
Continue routine monitoring, no immediate action needed |
From Camera Feed to Maintenance Ticket
Continuous capture — thermal cameras log surface temperature at each tracked zone on a fixed interval through every shift
Trend comparison — each reading is compared against that specific component's own historical baseline rather than a generic threshold
Drift flagging — a component trending upward beyond its normal operating band is flagged before it reaches an alarm-level temperature
Work order routing — the flagged component, zone, and trend chart are routed directly to the maintenance team's worklist
Comparing against a component's own baseline matters because normal operating temperature varies meaningfully between drive stations depending on ambient conditions, load profile, and enclosure design. A gearbox that normally runs warm under heavy load isn't a problem at that same temperature; the signal that matters is a component trending away from its own established normal, which is exactly the pattern a continuous thermal record is built to surface.
What Early Detection Actually Prevents
Motor Burnout
Catching winding temperature drift early avoids a full motor rewind or replacement
Bearing Seizure
Early lubrication intervention avoids an unplanned bearing failure mid-shift
Unplanned Downtime
Planned component swaps replace emergency repairs that stop the full line
Not sure how your current drive stations compare to a continuously monitored baseline?
Talk to our team about reviewing your existing thermal check data.
Why Drive Load and Ambient Conditions Complicate a Single Threshold
A fixed temperature threshold applied across every drive station in a plant tends to produce two kinds of errors at once: it misses genuine problems on lightly loaded drives that run cool enough to never approach the threshold even while developing a fault, and it generates false alarms on heavily loaded drives that run legitimately warm under normal conditions. A conveyor drive positioned near a kiln, dryer, or other heat-generating process will run at a different baseline temperature than an identical drive in an open, well-ventilated area of the same plant, and neither condition is abnormal for that specific location. This is precisely why trend-based monitoring against each component's own history produces more reliable results than a blanket alarm setpoint, since it accounts for the actual operating context of each individual drive rather than treating every motor and bearing housing in the plant as functionally identical.
Load Variation
Drives running near rated capacity naturally operate warmer than lightly loaded ones, and both can be entirely normal for their specific duty cycle.
Ambient Heat Sources
Drives positioned near kilns, dryers, or other process heat sources carry a higher baseline that a fixed threshold would misread as a fault.
Enclosure Design
Sealed or weatherproof motor enclosures run warmer under identical load than open drip-proof designs, shifting what counts as normal for that unit.
Seasonal Ambient Shift
Outdoor drive stations see a meaningful baseline shift between summer and winter that a trend model needs to account for across the full year.
Turning Flagged Components Into a Planned Maintenance Calendar
The practical value of catching a drifting motor or bearing early is that it converts what would otherwise be an emergency repair into a scheduled task that fits around an existing maintenance calendar rather than forcing an unplanned stop. A component trending upward over several days gives a maintenance planner enough lead time to order the correct replacement part, schedule the right technician, and time the actual swap for a planned outage window rather than reacting mid-shift when a bearing seizes without warning. This lead time is often the single biggest practical difference between a thermal monitoring program that just generates alerts and one that actually reduces unplanned downtime, since an alert that arrives with no time to plan around it provides very little advantage over the failure it was meant to prevent.
Most maintenance teams find it useful to review flagged components on a weekly planning cadence rather than reacting to every individual alert as it arrives, treating the flagged list as an input to the next maintenance planning meeting alongside existing preventive maintenance schedules. This keeps thermal monitoring integrated into the maintenance process that already exists rather than running as a separate, parallel alert stream that competes for attention against established routines.
Frequently Asked Questions
Do we need to replace our existing handheld thermal inspection program entirely?
Most plants keep a reduced handheld thermal route as a periodic cross-check while shifting primary reliance to continuous camera coverage, since the handheld route remains useful for spot-checking components outside the camera's fixed field of view or for validating a flagged reading during an investigation. The value of continuous monitoring comes from catching the gradual trend between those periodic checks, not from replacing every existing inspection habit on day one.
Reach out to our team to discuss how the two approaches fit together on your line.
How is a normal operating temperature baseline established for each drive?
A baseline is typically built from an initial monitoring period during which the system logs normal temperature behavior across a representative range of load conditions and ambient temperatures for that specific drive station, since a gearbox running near a hot process area will have a different normal range than one in an open, well-ventilated area. Once that baseline is established, the model flags meaningful deviation from it rather than comparing every drive against a single fixed number.
Book a demo to see how baseline calibration works for your specific drive layout.
Can thermal cameras distinguish between a real fault and normal seasonal temperature swings?
Because the model compares each component against its own historical trend rather than a static threshold, seasonal ambient shifts that affect every drive station similarly tend to show up as a broad baseline shift rather than an isolated component alarm, which the model is trained to account for when flagging genuine anomalies. A component trending upward relative to its peers under the same ambient conditions is a much stronger signal than temperature alone.
Talk to our team about how seasonal variation is handled in your specific facility.
What happens when a thermal camera flags a false positive?
False positives are addressed through the same trend-based approach used for detection, since a single elevated reading that does not continue trending upward over subsequent capture cycles is generally deprioritized rather than immediately dispatched as an urgent work order. Maintenance teams typically review flagged items as a ranked worklist rather than reacting to every single alert individually, which keeps the false positive rate from creating alert fatigue.
Book a walkthrough to see how flagged items are prioritized in practice.
How many drive stations can be monitored from a single camera installation?
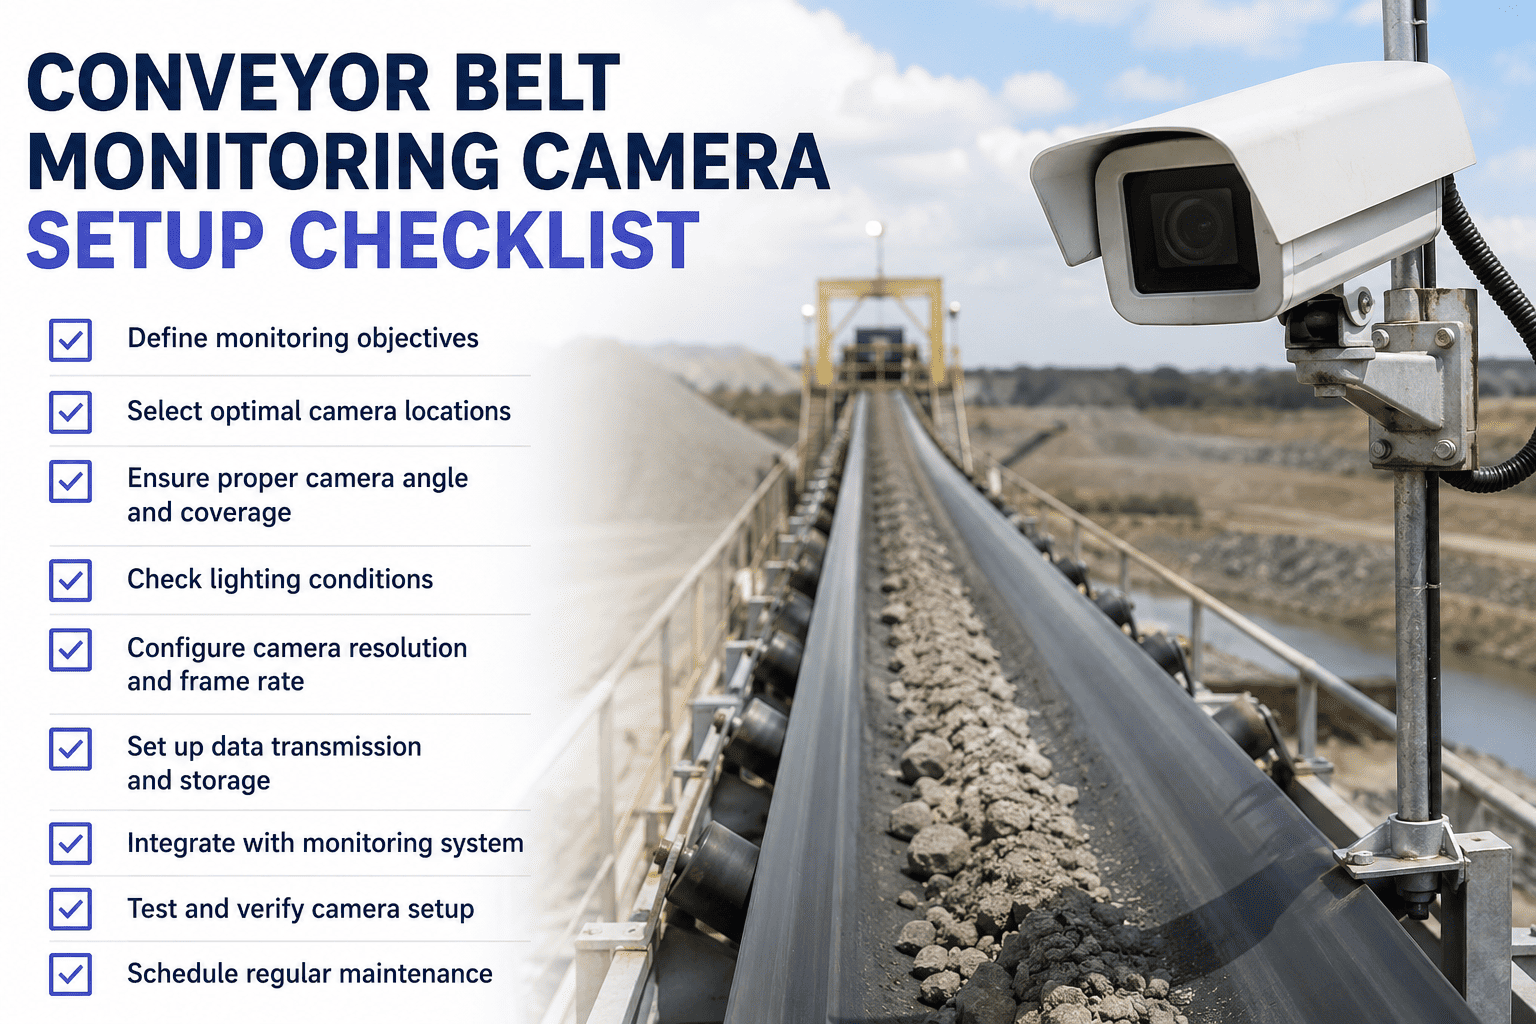
Camera placement is typically planned per drive station rather than shared across multiple drives, since each motor, bearing housing, and gearbox needs a clear thermal view for reliable readings, though a single processing system can aggregate and analyze feeds from many camera installations across an entire plant. The practical constraint is usually camera placement and field of view at each station rather than the number of stations a single system can process.
Reach out to scope a camera plan for your full drive station count.
Stop Reacting to Motor and Bearing Failures
Watch Every Drive Station, Continuously
Share your current drive station count and recent motor or bearing failure history. We'll show you what a continuous thermal baseline would have flagged in advance.