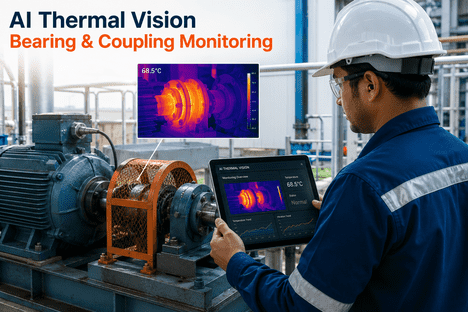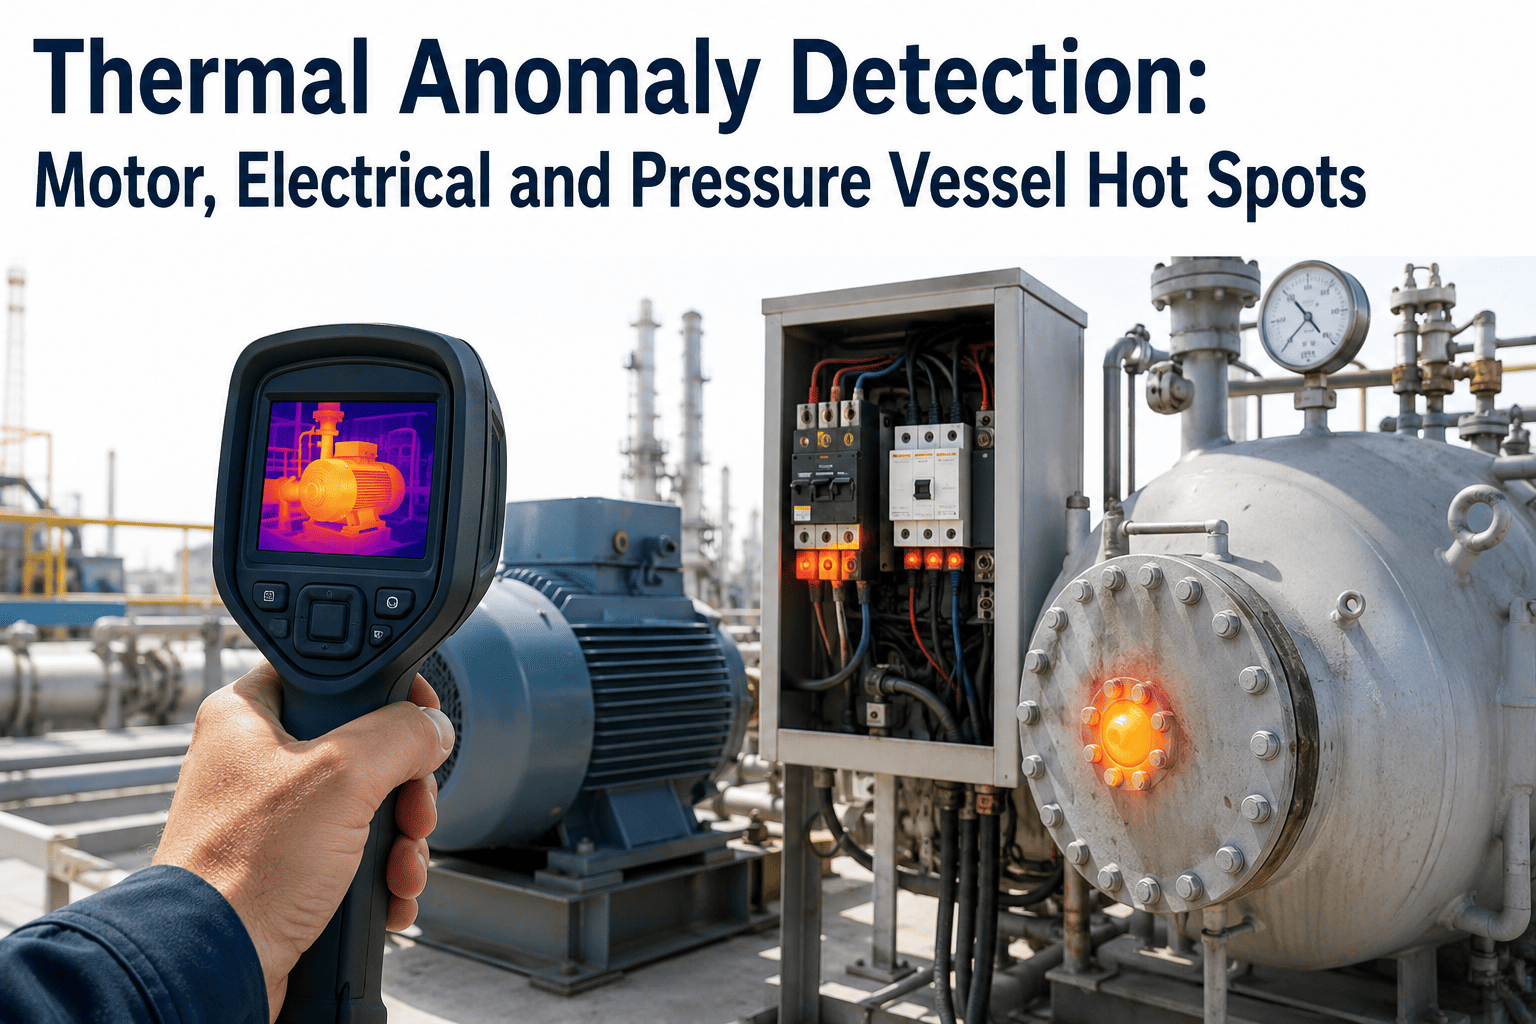
A motor bearing runs eleven degrees hotter than it should for three shifts before anyone notices, because nobody is walking that aisle with a handheld thermal gun outside the monthly survey window. A loose lug connection in an electrical panel arcs quietly inside its enclosure, invisible until the breaker trips or the panel fails outright. iFactory's AI Vision Camera reads infrared signatures continuously across motors, electrical connections, and pressure vessels, catching the eleven-degree drift while it is still a lubrication fix instead of a bearing replacement — see how it reads your own equipment with a Book a Demo.
Heat Tells You a Failure Is Coming — If Something Is Watching
iFactory's infrared AI cameras track temperature signatures across motors, bearings, electrical connections, and pressure vessels around the clock, flagging thermal drift days or weeks before it becomes a shutdown.
Where Heat Hides Before It Becomes a Failure
Motors, electrical connections, and pressure vessels each fail thermally in different ways. iFactory's models are trained separately for each so a normal operating temperature on a motor housing isn't confused with an early warning sign on a switchgear connection.
Motors & Bearings
Rising friction from lubrication breakdown, misalignment, or bearing wear shows up as localized heat at the bearing housing well before a vibration sensor or an audible change would catch it.
- Bearing housing temperature drift against established baseline
- Uneven heating across motor casing indicating winding degradation
- Coupling and shaft-seal hot spots from misalignment
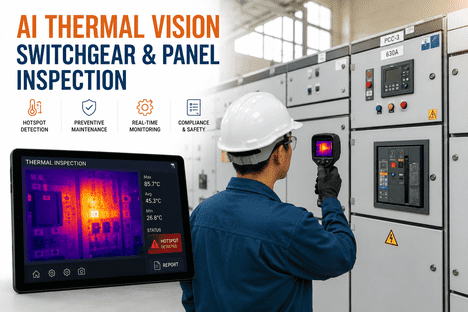
Electrical Connections
Loose lugs, corroded terminals, and overloaded circuits generate resistive heating at the connection point long before insulation fails or a breaker trips, making thermal signature the earliest available warning.
- Localized hot spots at breaker and disconnect terminals
- Phase imbalance visible as uneven heating across three-phase connections
- Panel-level thermal gradients indicating overload conditions
Pressure Vessels
Refractory or insulation breaches, internal scaling, and level discrepancies alter a vessel's external thermal profile, giving process teams a non-invasive way to catch internal degradation from outside the shell.
- Insulation breach hot spots along the vessel shell
- Fluid-level thermal boundaries indicating scaling or fouling
- Localized wall temperature anomalies signaling corrosion thinning
Built Around NFPA 70B Thermography Practice
NFPA 70B calls for regular infrared inspection of electrical equipment to catch thermal anomalies before failure. The standard assumes periodic surveys — iFactory extends that same thermographic discipline into continuous, always-on coverage.
Documented Thermal Baselines
Every monitored asset gets a recorded normal-operating thermal profile, the same reference point a periodic survey establishes, but refreshed continuously instead of once a quarter.
Trend-Based Severity Classification
Anomalies are classified by both absolute temperature and rate of change, mirroring the priority categories used in standard thermographic survey reporting.
Audit-Ready Inspection Records
Every detected anomaly and its resolution is logged automatically, producing the kind of inspection trail an NFPA 70B program review typically requires from a manual survey log.
How iFactory Grades a Thermal Anomaly
Turn a Once-a-Month Survey Into a Continuous One
iFactory reads thermal signatures on motors, electrical connections, and pressure vessels every hour of every shift.
From Infrared Feed to Work Order
Read
Infrared-capable cameras continuously capture thermal data across monitored motors, panels, and vessels.
Baseline
Each asset's normal thermal profile is learned and continuously updated against operating load and ambient conditions.
Classify
Deviations are graded from Normal through Critical based on magnitude and rate of temperature change.
Notify
Maintenance receives a work order with the asset, location, and thermal image evidence attached automatically.
Periodic IR Survey vs. Continuous AI Vision
| Thermography Metric | Handheld Periodic Survey | iFactory AI Vision |
|---|---|---|
| Inspection Frequency | Monthly or quarterly | Continuous, every shift |
| Coverage Between Surveys | None | Full, uninterrupted |
| Time to Flag Rapid Onset Faults | Up to a full survey cycle | Minutes |
| Record Consistency | Depends on technician and route | Standardized across every asset |
| Historical Trend Data | Point-in-time snapshots | Continuous trend history per asset |
Three Catches That Would Have Been Missed
The Bearing That Was Quietly Failing
A conveyor drive motor's bearing housing began drifting upward from its baseline over four days, a change too gradual to notice by touch and well before the next scheduled survey. iFactory flagged the trend on day two, and maintenance relubricated the bearing during a planned stop instead of replacing a seized motor after an unplanned one.
The Connection Nobody Walked Past
A rarely-accessed distribution panel had a loosening lug connection generating a small but steadily rising hot spot. Because the panel sat outside the normal monthly survey route, it went unchecked for months. Continuous monitoring caught the rising trend and routed an alert before the connection reached failure temperature.
The Vessel Wall Losing Insulation
A section of refractory lining inside a process vessel had begun to degrade, producing a localized hot spot on the external shell invisible to a walk-by visual inspection. The thermal signature was flagged well ahead of the next scheduled shutdown, giving the reliability team time to plan the repair into existing maintenance windows.
The Cost Difference Between Early and Late Detection
Planned Repair
A lubrication fix or a connection re-torque scheduled during existing maintenance windows costs a fraction of an emergency response and carries zero unplanned downtime.
Emergency Failure
A seized motor, a tripped breaker, or a vessel breach discovered after the fact typically means expedited parts, overtime labor, and hours or days of lost production.
Insurance & Compliance
Documented continuous thermal monitoring supports lower risk profiles in insurance reviews and strengthens audit evidence for electrical safety programs.
Our thermal surveys used to happen once a month, and we always knew there were weeks in between where anything could be developing. iFactory closed that gap entirely. We caught a rising hot spot on a switchgear connection three weeks before it would have shown up on our next scheduled walk, and that alone justified the investment.
Frequently Asked Questions
Q: Does thermal monitoring replace our existing handheld infrared survey program?
iFactory is designed to extend a thermography program rather than eliminate the expertise behind it. Continuous monitoring catches drift between survey cycles and flags where a technician's next handheld inspection should focus, while periodic surveys remain useful for equipment outside fixed camera coverage. Most facilities run both together during a Book a Demo discussion to map out the right balance.
Q: How does the system account for normal temperature changes from ambient conditions or load?
Baselines are established per asset and continuously adjusted against operating load and ambient temperature, so a motor running harder on a hot day is not flagged the same way a motor overheating at idle load would be. This context-aware baselining is what separates true anomaly detection from a simple fixed-temperature alarm.
Q: Can the cameras monitor equipment inside enclosed panels or behind covers?
Infrared cameras require a line of sight to the surface generating heat, so fully enclosed equipment needs either a viewing window, an open-door inspection point, or an external shell reading, depending on the asset. A site assessment identifies the right camera placement and mounting approach for enclosed switchgear and panels.
Q: What is the typical accuracy for detecting a developing fault before failure?
Accuracy depends on the asset type and how much historical baseline data has been collected, but most deployments reach reliable trend-based detection within two to four weeks of continuous operation as the system learns each asset's normal thermal behavior. Reach out through Support Contact for specifics on your equipment mix.
Q: How is thermal anomaly data delivered to our maintenance team?
Alerts are routed directly to maintenance with the asset identifier, location, severity classification, and a thermal image attached, and can integrate with most existing CMMS or work order systems so a flagged anomaly becomes a scheduled ticket without manual re-entry.
See What's Running Hot Right Now
Bring thermal or standard footage from your facility and see iFactory classify anomalies live, across motors, panels, and vessels.