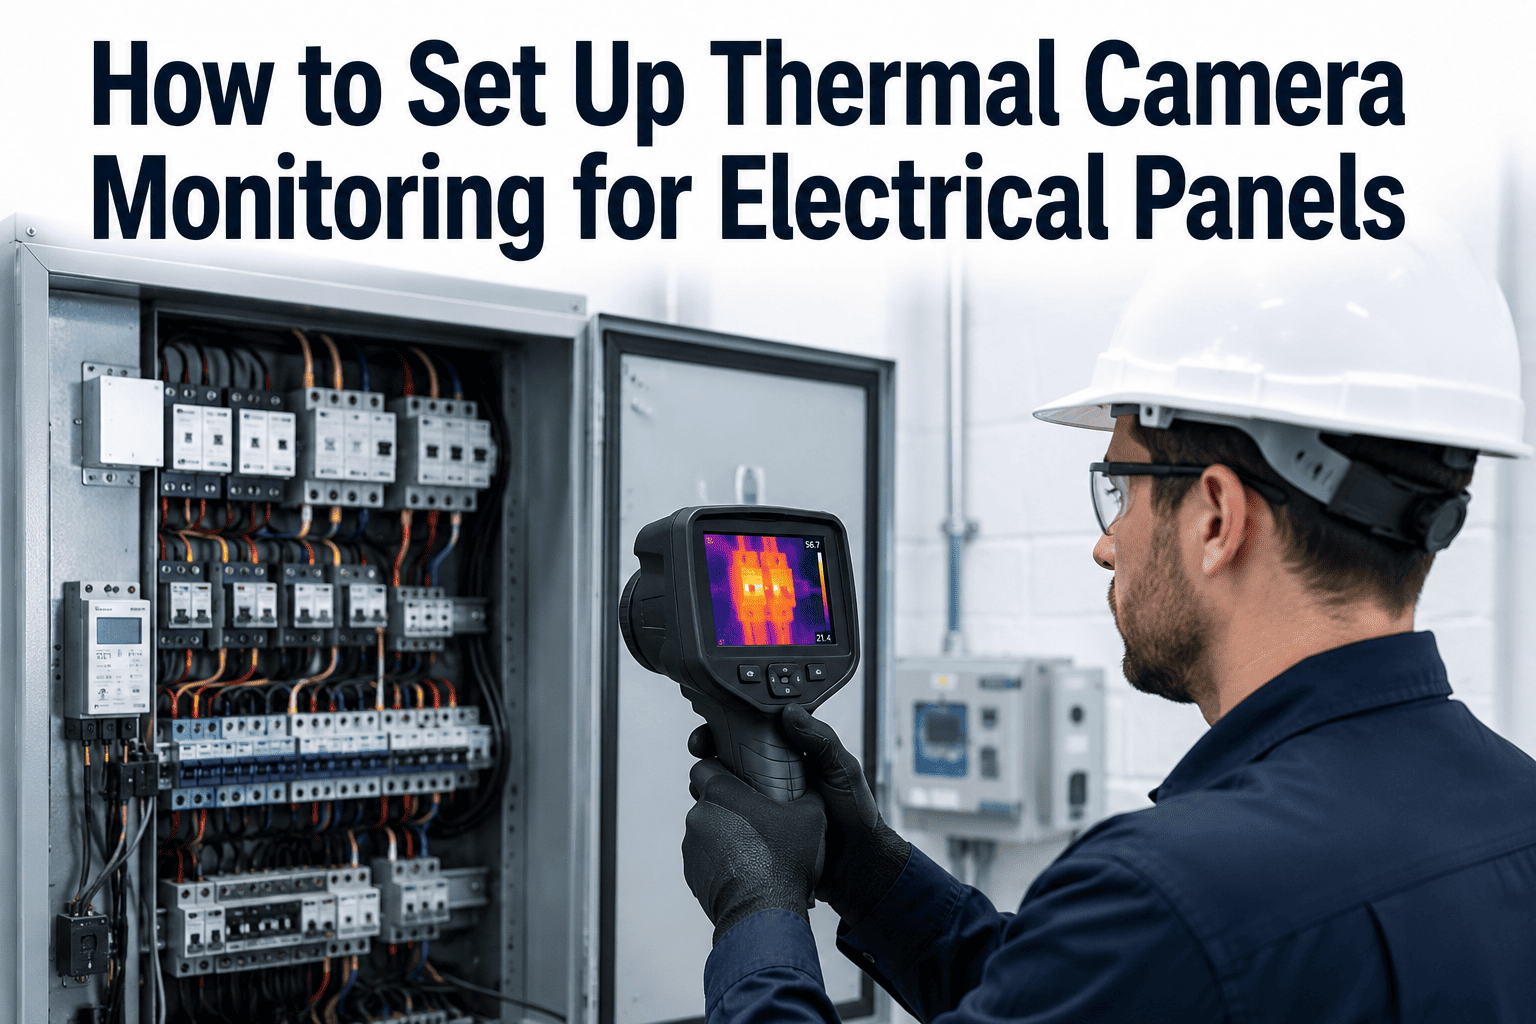
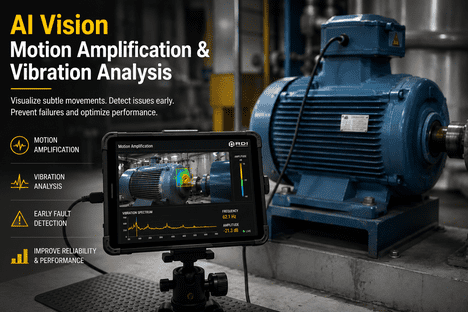
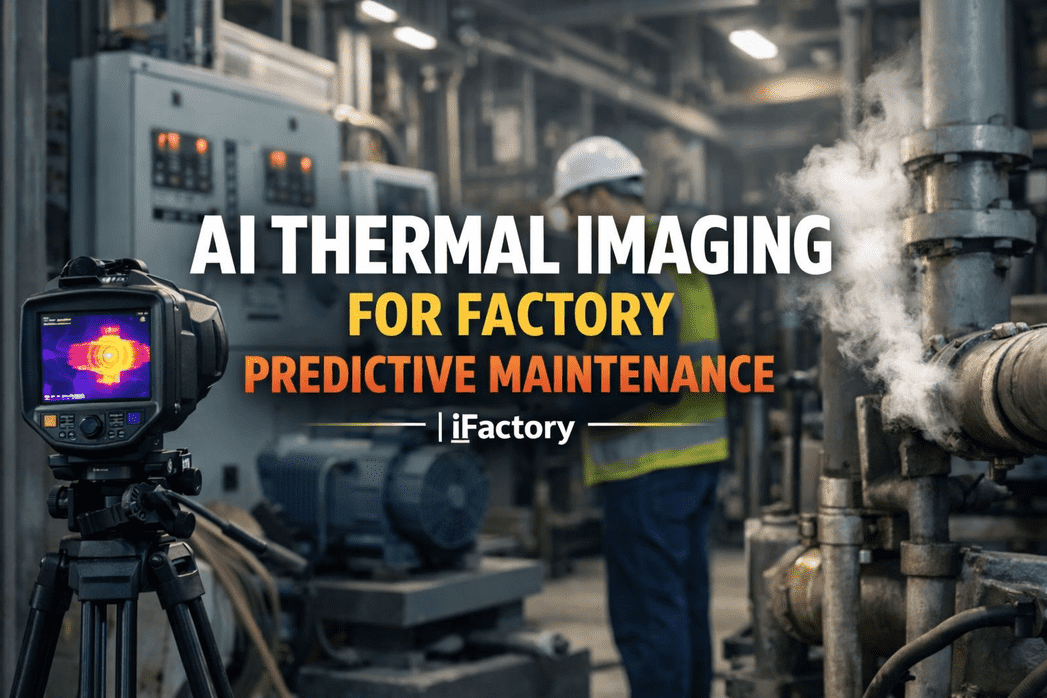
Every industrial fault that ends in a burned panel, a seized motor, or an arc flash produces heat weeks before it produces a failure. The problem was never that the heat was invisible — infrared cameras have made temperature visible for decades. The problem was that the heat was unwatched, because a technician with a handheld thermal camera can only stand in front of one panel at a time, and an annual survey scans about 0.09% of the operating hours where degradation actually develops. AI changes that math completely: continuous thermal streams ingested from fixed radiometric cameras, hot spots detected automatically against learned baselines, severity classified by ΔT against NFPA 70B thresholds, and work orders auto-generated into your CMMS the moment a critical differential is confirmed. iFactory's thermal AI is now catching 85–90% of electrical faults and 70–80% of mechanical faults 30–90 days before breakdown — book a demo to see thermal AI running on your assets.
THERMAL AI · IR ANALYTICS · NFPA 70B · CONDITION MONITORING
The Hot Spot That Burned Down Your Panel Was Rising 1°C per Week for Six Weeks — Nothing Was Watching It
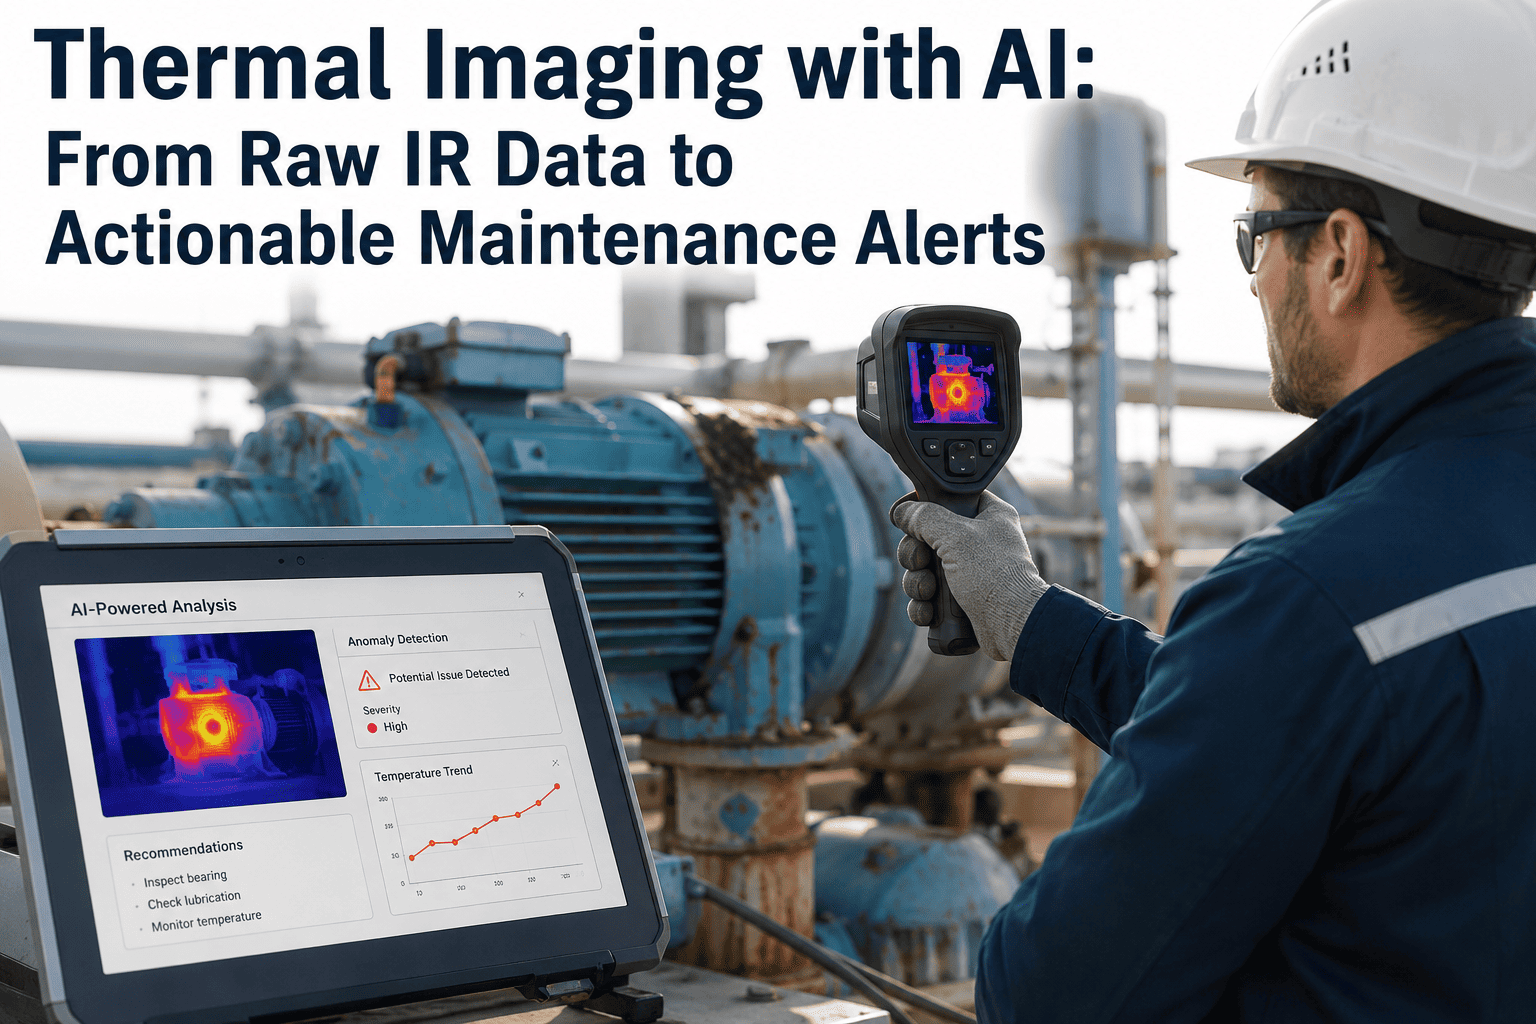
iFactory's thermal imaging AI ingests continuous IR streams from your fixed cameras, detects hot spots against learned baselines, classifies severity by ΔT threshold, and generates prioritized work orders directly into your CMMS — turning raw radiometric pixels into a maintenance action within seconds of a confirmed anomaly.
85-90%
Electrical faults caught before failure
30-90
Days advance warning before breakdown
70%
More failures caught vs periodic surveys
45-65%
Reduction in electrical downtime
THE COVERAGE GAP
Why Handheld Annual Thermal Surveys Miss the Faults That Actually Burn Down Panels
The math on manual thermographic inspection is unforgiving. A typical annual survey covers about two hours of scanning across roughly 2,190 operating hours per quarter — approximately 0.09% coverage of the time window during which faults actually develop. Slow-developing hot spots that rise 1–2°C per week between scheduled surveys are exactly the faults that turn into unplanned outages, because periodic snapshots cannot see the trajectory that separates a normal warm connection from a connection heading toward failure.
2 hours scanned
2,190 operating hours unscanned
A slow-developing 1°C-per-week hot spot develops entirely inside the unscanned window. The next quarterly survey finds the failure, not the trajectory that led to it.
THE FULL AI PIPELINE
From Raw Infrared Pixels to a Work Order in Your CMMS — Every Stage of the AI Pipeline
The gap between a thermal camera and a maintenance action is not a single algorithm — it is a five-stage pipeline that transforms radiometric pixel data into a prioritized, assigned, tracked work order. iFactory runs all five stages continuously on every camera in your fleet.
1
Ingest
Continuous IR video streams from fixed radiometric cameras via RTSP, plus handheld uploads and drone survey batches through the mobile app or API.
2
Detect
AI segments hot spots against a learned baseline for each asset, using rate-of-change and thermal pattern morphology — not just absolute spot temperature.
3
Classify
Severity classified against NFPA 70B ΔT thresholds — reference component, similar-loading comparison, or ambient-air differential — plus fault-type signature match.
4
Trend
Temperature trajectory tracked scan-over-scan to distinguish a stable warm spot from an accelerating degradation curve requiring intervention now.
5
Act
Auto-generated work order posted to your CMMS with severity, asset ID, thermal image, ΔT, recommended action, and NFPA 70B-compliant audit metadata.
The Hot Spot Does Not Wait for Your Next Quarterly Survey — It Escalates by Roughly 1°C per Week
iFactory's thermal AI watches every camera in your fleet every second of every shift, detects developing hot spots against baseline, and posts work orders to your CMMS with the audit trail NFPA 70B now requires.
THERMAL SIGNATURES
What Each Fault Type Looks Like on an Infrared Image — And Why AI Reads It Better Than a Human
Every industrial fault that produces heat produces a distinct thermal signature — a spatial pattern, a temperature range, and a rate of change that differentiates one failure mode from another. AI is trained to recognize each signature independently of ambient conditions and load state, catching the fault before a human thermographer would spot the same pattern in a static snapshot.
HOT
Loose Electrical Connection
Localized heat concentrated at a single termination point — a lug, a bolt, a breaker stab. Sharp temperature gradient falling off within centimetres. AI distinguishes this from a healthy warm connection by the concentration ratio and the rate at which the delta grows under load.
HOT
Overloaded Circuit or Phase Imbalance
Uniform heating across an entire conductor length or across multiple phases with distinctly different temperatures. AI reads the pattern as load-related rather than connection-related and triggers a load-review action rather than a mechanical repair.
HOT
Motor Bearing Failure
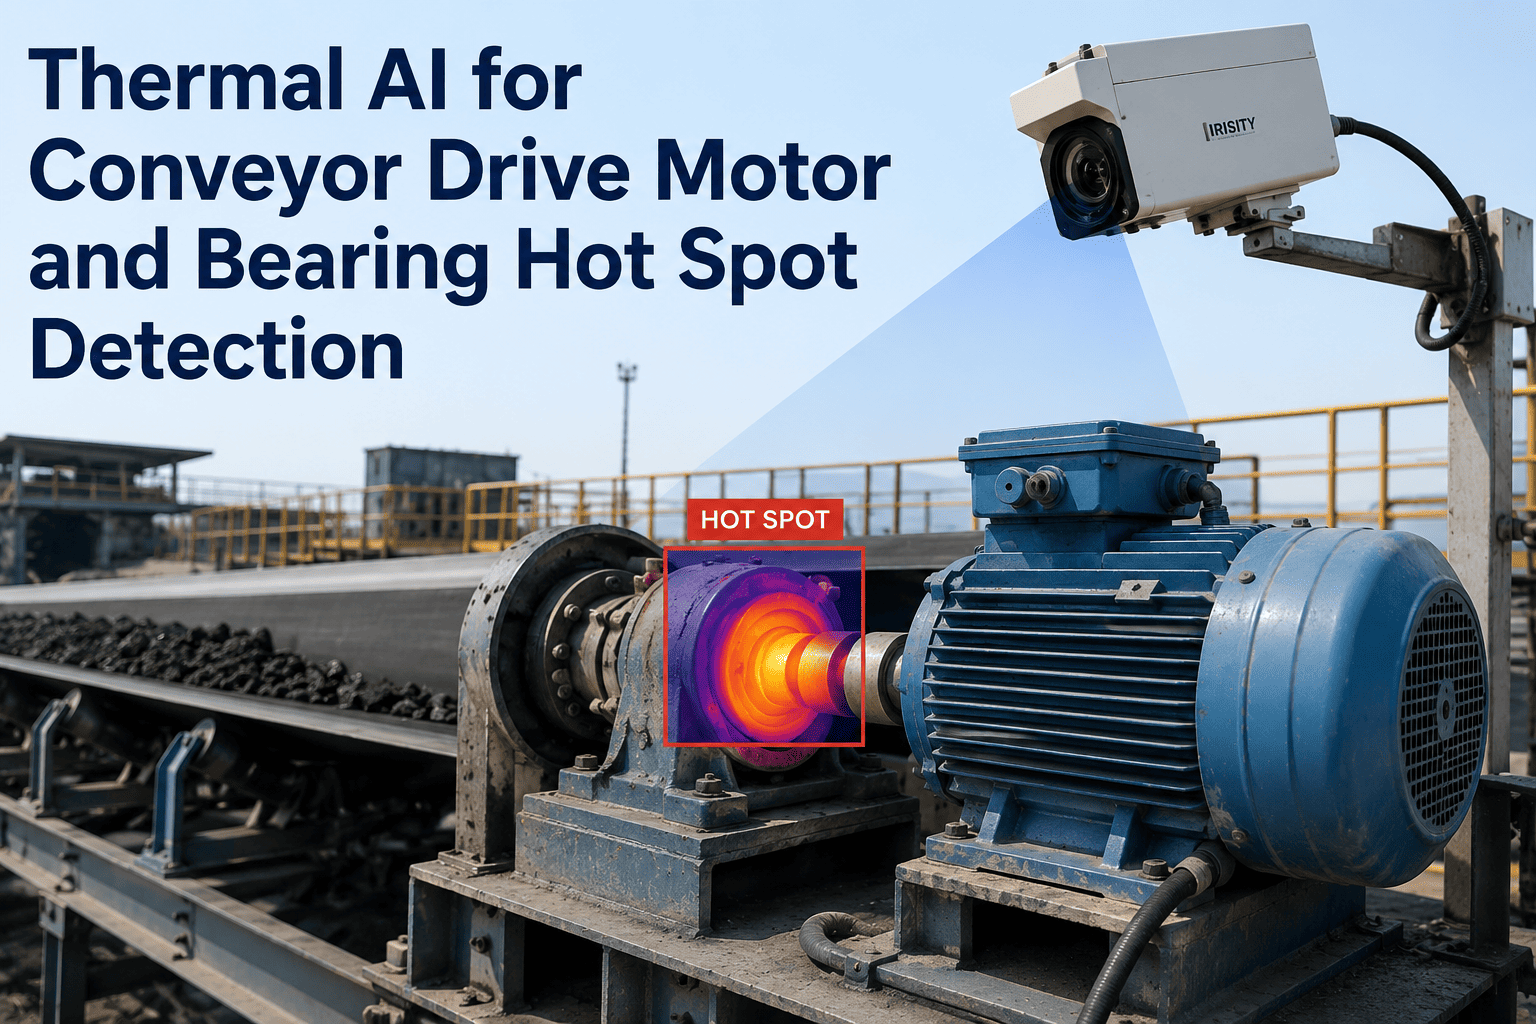
Bearing housing running 40°C or more above ambient with a gradient toward the shaft. Rising trajectory over days rather than hours. AI correlates thermal rise with motor operating hours to distinguish break-in warmth from developing bearing damage.
HOT
Insulation Deterioration
Diffuse heat across the insulation surface with hot bands at damaged sections. Escalating slope over weeks. AI reads the diffuse pattern as insulation-based and classifies severity by the peak-to-baseline delta rather than raw temperature alone.
HOT
Steam Trap or Valve Leakage
Downstream heat where the pipe should be at ambient — a hot spot on an isolation valve or on the discharge side of a supposedly closed steam trap. AI correlates with steam system schematics to flag energy loss and trap failure in the same alert.
HOT
Refractory or Furnace Wall Damage
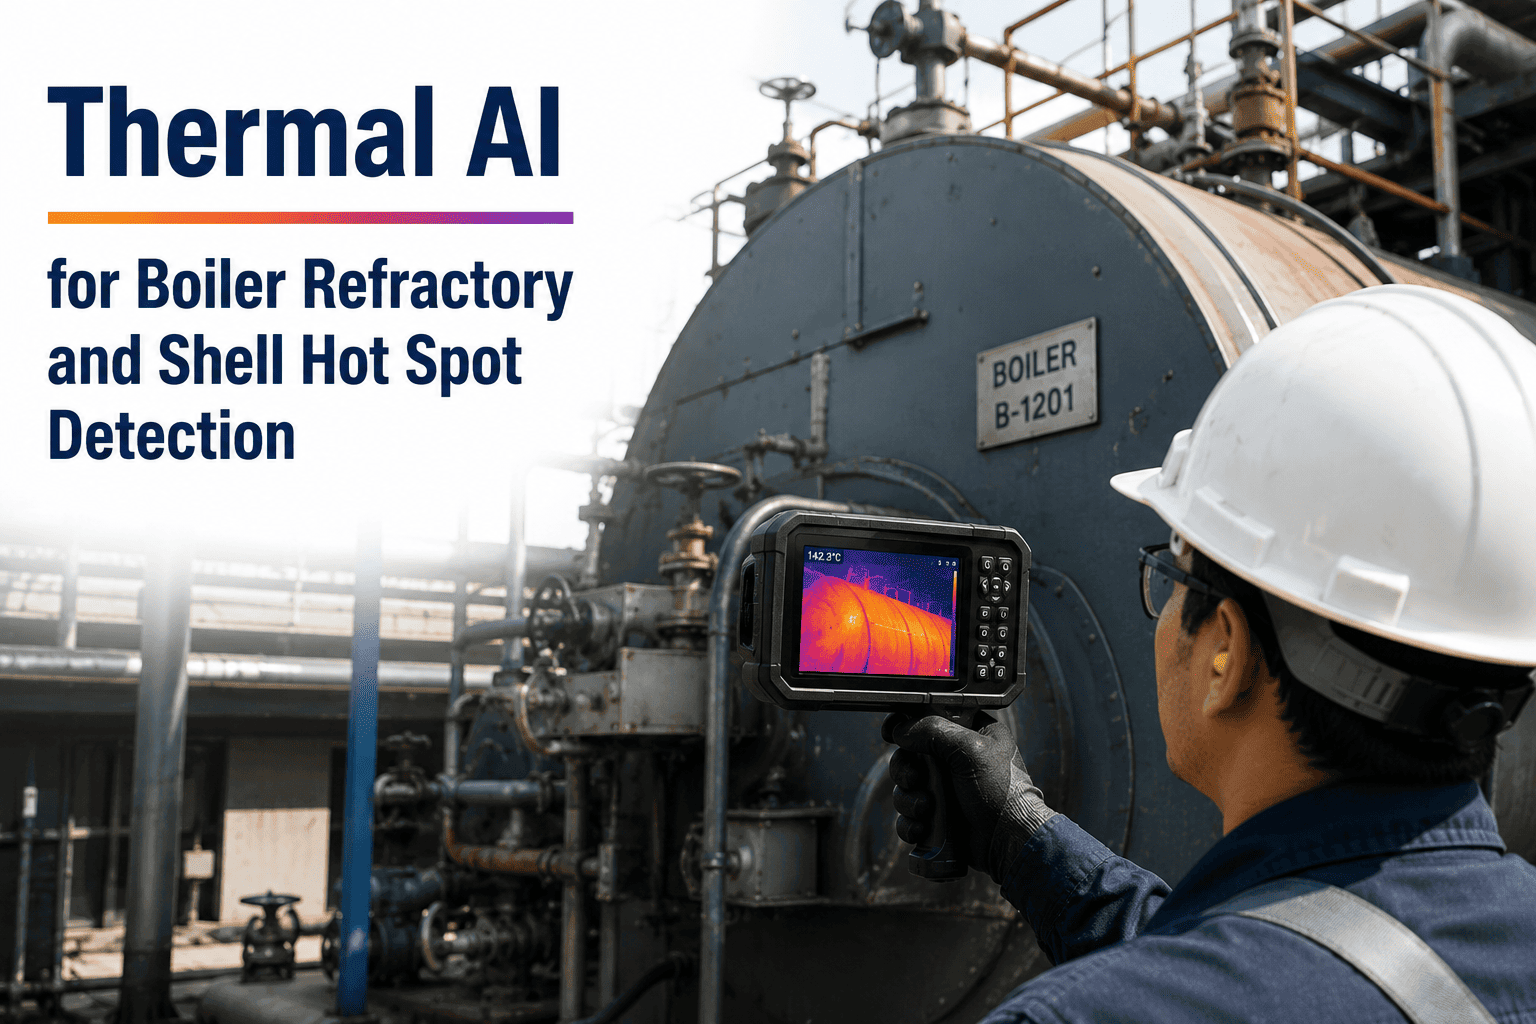
External wall hot spots on furnaces, boilers, or process vessels indicate internal refractory degradation. AI maps the hot band and computes remaining refractory thickness estimates against baseline shell temperature.
SEVERITY CLASSIFICATION
How AI Classifies Every Hot Spot Against NFPA 70B ΔT Thresholds
NFPA 70B 2023 mandated infrared thermography as a requirement rather than a recommendation, and severity classification is now the language of every compliant thermal report. iFactory's AI applies the standard ΔT bands automatically to every detected hot spot, so the severity field in the work order matches what an auditor expects to see.
Immediate action required
Deficiency likely to result in equipment failure. Auto-generated priority-1 work order. Recommendation to de-energize if safe, otherwise plan controlled shutdown within 24 hours. Arc flash risk assessment triggered on electrical assets.
Correction required within 30 days
Deficiency indicates definite fault requiring correction. Priority-2 work order posted with recommended action, spare parts availability check, and scheduled outage window suggestion.
Monitor and correct at next planned outage
Slight abnormality warranting scheduled attention. Priority-3 work order posted with monitoring interval defined. AI continues trending the hot spot and escalates severity if trajectory increases.
Within acceptable range
No action required. Reading logged to the asset thermal history for baseline maintenance and long-term trend analysis. Included in the NFPA 70B compliance report as scan evidence.
NFPA 70B 2023 COMPLIANCE
Meeting the Requirements That Now Have the Weight of Enforceable Standard
The 2023 update of NFPA 70B changed thermographic inspection from a recommended practice into a mandatory requirement. Every requirement of the updated standard maps to a specific capability of iFactory's thermal AI platform, so compliance is a byproduct of running the system rather than a separate documentation project.
Section 7.4.1
Measure ΔT of similar components under similar loading, plus differential vs ambient
AI automatically identifies reference components in every scan, computes ΔT against both similar-component baselines and ambient-air readings.
Section 7.4.3
Documentation of temperature differences between area of concern and reference area
Every detected hot spot logged with paired reference area, ΔT value, timestamp, and associated asset — audit-ready format.
Section 9.2.2
Condition 1 & 2 equipment inspected every 12 months, Condition 3 every 6 months
Continuous monitoring exceeds both intervals. Asset condition classification tracked automatically based on scan history.
Calibration Traceability
All test equipment calibrated traceable to a national standard
Calibration certificates for every camera stored in the asset record, calibration due dates auto-tracked and flagged.
Reporting Content
Thermal images, ΔT, equipment IDs, severity, corrective actions
Every alert record contains all mandated fields. Compliance report auto-generated for audit on demand across any date range.
Qualified Personnel
Inspections performed by trained thermographers
iFactory-certified thermographers review AI-flagged findings during the 24×7 remote monitoring service, satisfying qualified-personnel requirement.
DEPLOYMENT BUNDLE
How iFactory Puts Thermal AI on Your Highest-Consequence Assets
iFactory delivers thermal AI as a complete hardware and software bundle. Fixed radiometric cameras selected for your asset environment, edge inference hardware sized to your camera fleet, TensorRT-optimized detection models, CMMS integration, and 24×7 monitoring by certified thermographers — all sequenced into a 6–12 week rollout.
Hardware Bundle
Pre-configured NVIDIA AI server ships racked and ready. Fixed radiometric IR cameras selected for switchgear, MCC rooms, transformer bays, motor cabinets. All software pre-loaded. Rack it, plug power and Ethernet, and thermal AI is live.
Ease of Deployment
Existing handheld or fixed thermal cameras also supported through API and file upload — no hardware replacement required to start. AI baseline modelling begins day one using your existing feeds and historical survey data.
Integration Scope
Cabling, network, CMMS integration for automatic work-order generation, PLC/SCADA integration for alert routing, operator training, and 24×7 remote monitoring by iFactory-certified thermographers.
Live in 6–12 Weeks
Weeks 1–3: asset priority mapping, camera install in high-consequence zones. Weeks 4–8: baseline learning, CMMS integration, work-order routing setup. Weeks 9–12: operator training and cutover to continuous monitoring.
Maintenance Planner
Thermal AI flagged Switchgear Bay 4, Breaker 12 at critical severity. What is the trajectory?
iFactory AI
Left-phase lug ΔT at +18°C vs the neutral and right phases. Trajectory shows +1.4°C per week over the last five weeks, up from stable baseline. Signature matches loose termination, not overload. Priority-1 work order posted to CMMS at 09:12 with de-energize-and-torque recommendation. Spare parts on hand.
1000+
Clients on iFactory AI across manufacturing verticals
99.9%
Thermal monitoring platform uptime SLA
3-Phase
Structured deployment roadmap from kickoff to cutover
MANUAL VS AI COMPARISON
Handheld Annual Survey vs Continuous AI Thermal Monitoring — Every Dimension That Matters
The gap between traditional thermographic programs and AI-powered continuous monitoring is not a small improvement. It is a change in what is even possible to detect, and the comparison below maps the honest differences across every dimension a reliability team should evaluate.
| Dimension |
Handheld Annual Survey |
iFactory Continuous AI Thermal |
| Coverage of Operating Hours |
~0.09% of operating time surveyed |
24×7 continuous monitoring on covered assets |
| Fault Detection Rate |
10–15% of developing faults detected |
85–90% of electrical faults caught before failure |
| Advance Warning |
Snapshot only, no trajectory |
30–90 days advance warning through trending |
| Arc Flash Exposure |
Technician stands in front of energized gear |
Fixed cameras remove human from arc-flash zone |
| Severity Classification |
Manual ΔT calculation per finding |
Automatic NFPA 70B ΔT classification per hot spot |
| Work Order Generation |
Report to planner, manual entry into CMMS |
Automatic CMMS work order with full metadata |
| Audit Trail |
Contractor reports filed periodically |
Continuous timestamped record, NFPA 70B-compliant |
FREQUENTLY ASKED QUESTIONS
Questions Reliability Engineers Ask About AI-Powered Thermal Imaging
Do we need to replace our existing thermal cameras to deploy iFactory's thermal AI?
No. iFactory's platform ingests thermal data from your existing handheld cameras, uploaded survey files, and fixed thermal cameras through APIs and standard file transfers, so day-one value does not require any camera replacement. For high-consequence zones where continuous monitoring is the priority, fixed radiometric cameras are added during scheduled maintenance windows — prioritized by failure cost and inspection accessibility. Most deployments start with existing camera feeds and add fixed cameras incrementally as the ROI on each priority zone is proven.
Book a demo to see how the platform works with your existing thermal camera fleet.
How does AI hot spot detection avoid false positives from normal load variations and ambient temperature swings?
Absolute-threshold detection is exactly what produces the false positives that plague first-generation thermal programs. iFactory's AI works differently — it analyzes rate of change, thermal pattern morphology, and ΔT against reference components rather than raw spot temperature alone. Load conditions and ambient swings are correlated out of the signal by comparing each asset against its own learned baseline and against reference components under the same load. Slow-developing faults that rise 1–2°C per week are caught precisely because the model reads trajectory, not just a single reading.
Contact our support team to see false-positive rate data from live deployments.
How does the auto-generated work order integrate with our existing CMMS and reliability workflow?
Every detected hot spot above the minor severity threshold posts a work order into your CMMS through a native integration with the major platforms and through APIs for the rest. The work order carries severity classification, ΔT, asset ID, thermal image, recommended corrective action, and the NFPA 70B-compliant audit metadata. Priority routing matches your existing CMMS priority scheme, and closed work orders feed back to the thermal AI so the platform learns which findings resolved with which action. Your planners see the same intake process they use for every other work source.
Book a demo to see live CMMS work-order integration.
Does iFactory's thermal AI satisfy the NFPA 70B 2023 requirement for qualified thermographer inspection?
Yes — the 24×7 remote monitoring service includes iFactory-certified thermographers who review every AI-flagged finding before critical alerts are dispatched, which satisfies the NFPA 70B qualified-personnel requirement. AI handles the continuous detection workload that would be impossible for any human team to cover, and certified thermographers provide the professional review and correlation that the standard requires for compliant reporting. All camera calibration records, certification credentials, and inspection documentation are maintained in the platform for audit.
Contact our support team to review the NFPA 70B compliance package in detail.
What is the typical ROI timeline for deploying AI thermal imaging on a critical asset fleet?
Most deployments recover cost inside twelve months, driven mainly by avoided catastrophic electrical failures and reduced emergency repair. Predictive maintenance with thermal imaging documented in industry reporting reduces overall downtime by 30–50% and maintenance costs by 20–40%, and a single avoided arc flash event typically covers 12–24 months of platform cost. For high-consequence facilities, the multiplier is significantly larger. The pre-deployment assessment quantifies the expected ROI based on your specific asset fleet, historical failure data, and downtime cost.
Book a demo for a fleet-specific ROI projection.
Turn Raw IR Data Into Maintenance Action — Not a Report Sitting in Someone's Inbox
iFactory's thermal AI converts continuous infrared streams into severity-classified, NFPA 70B-compliant work orders automatically posted to your CMMS — with certified thermographer review in the loop and 24×7 remote monitoring behind the platform.