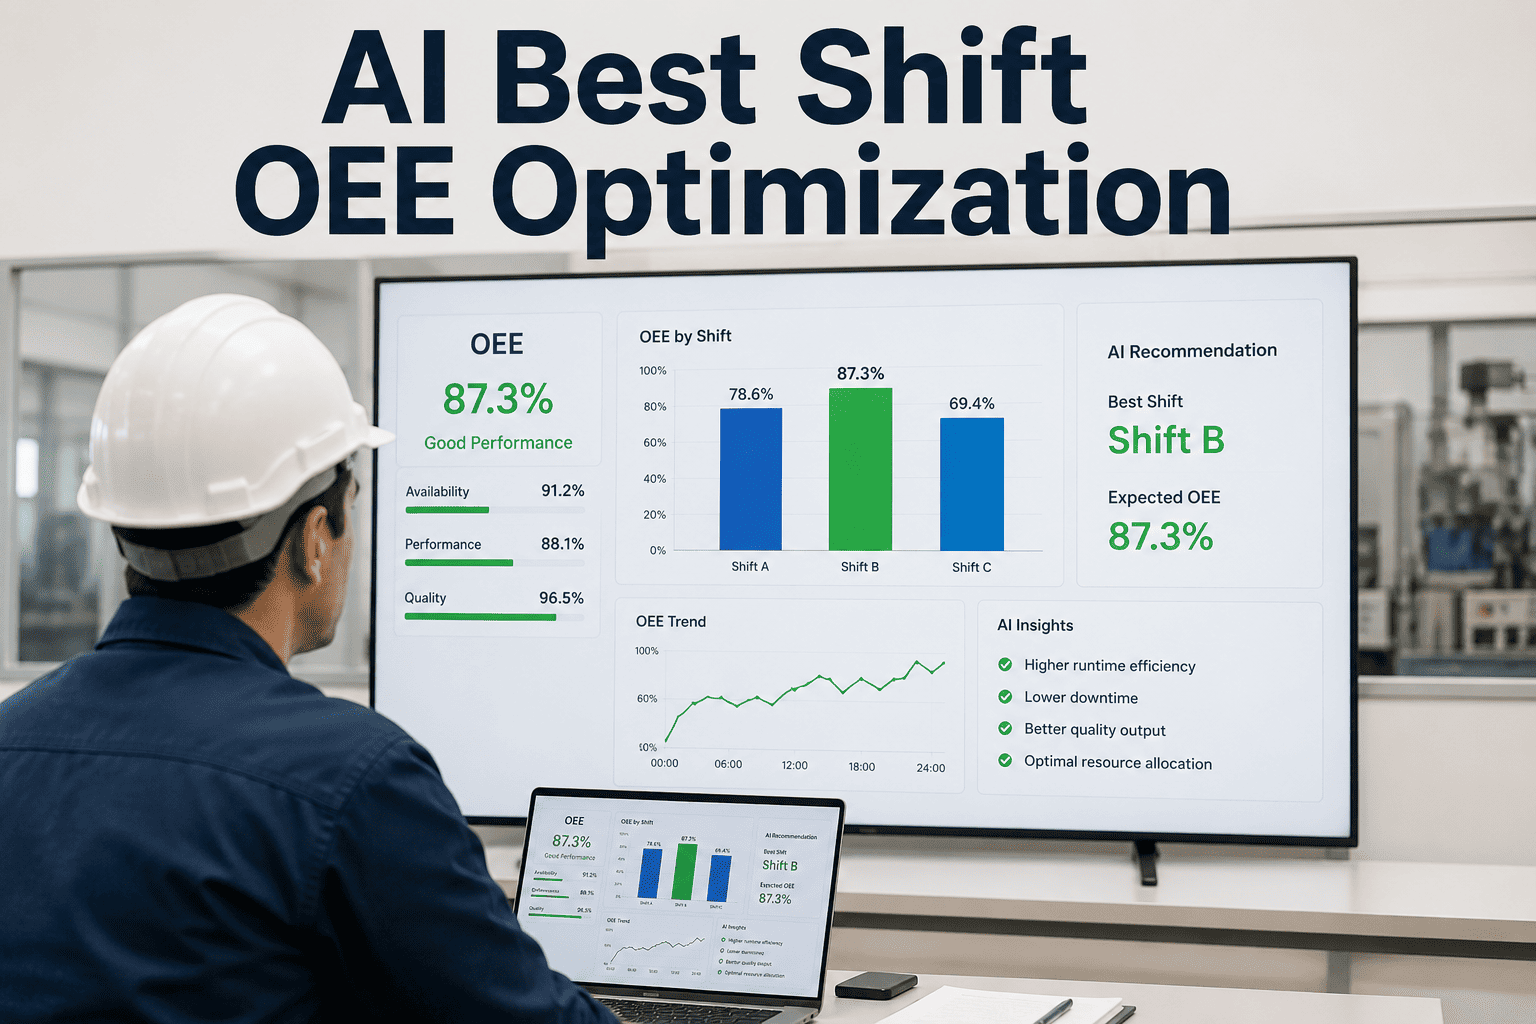
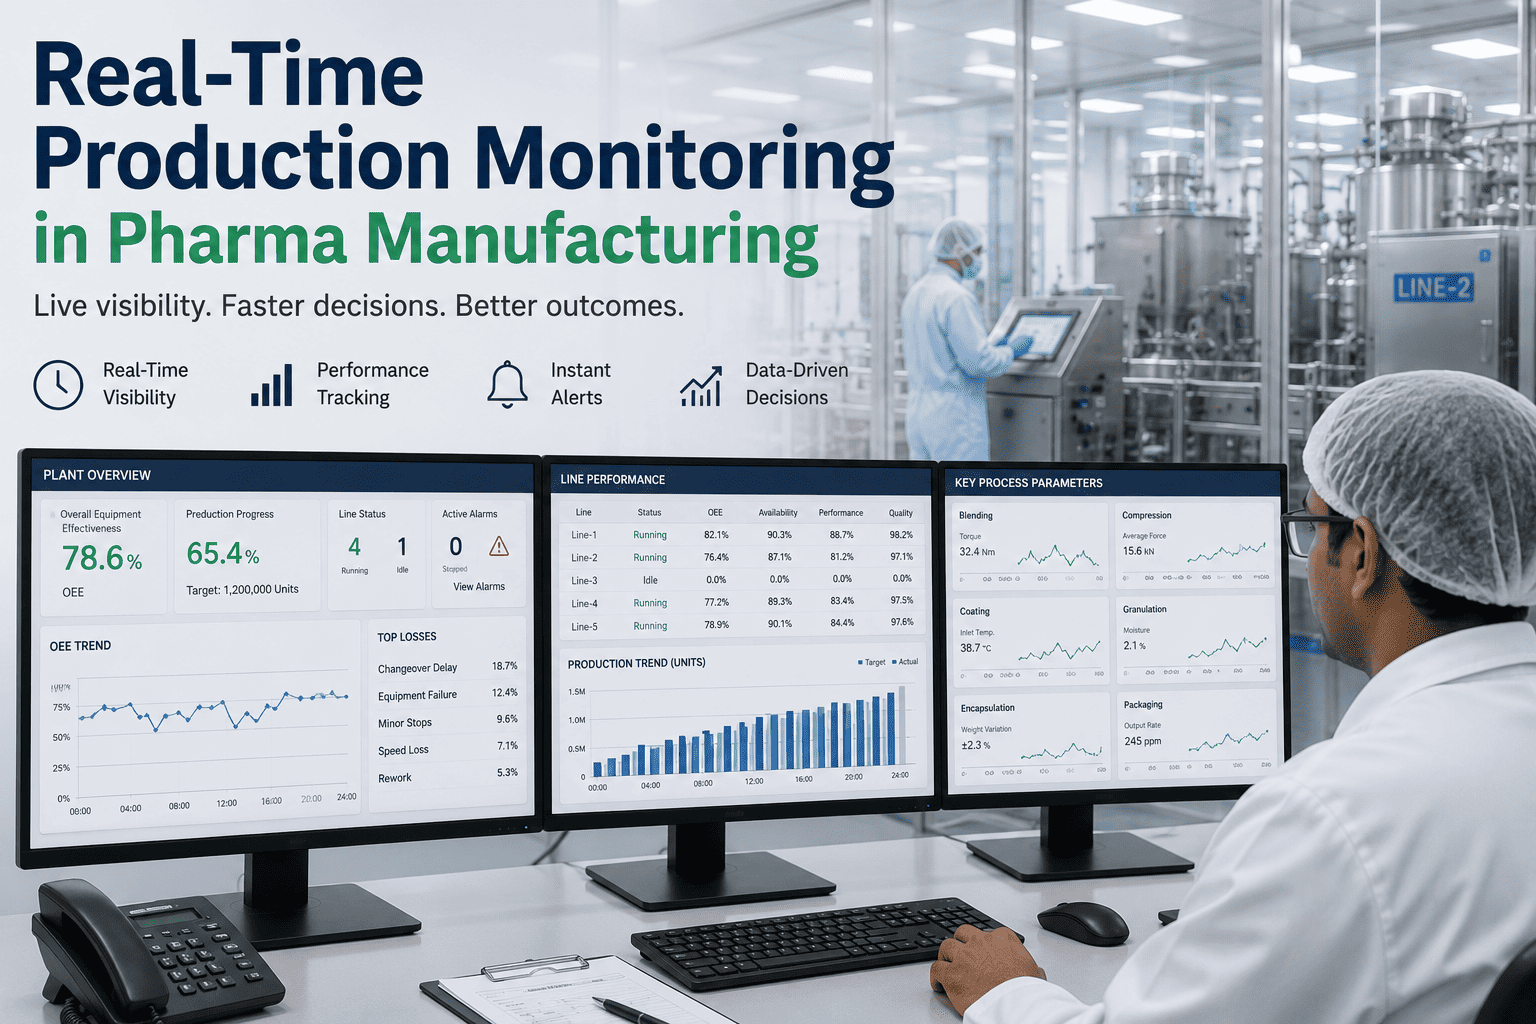
Ask any plant manager which shift runs best and they will usually have an answer within seconds, backed by nothing more than a feeling built up over months of walking the floor. That feeling is often right, but it is rarely specific enough to act on, because knowing a shift performs well is not the same as knowing which exact settings, habits, or sequencing made it so. AI shift optimization closes that gap by measuring every shift against every other shift on the same metrics, and you can book a demo to see your own shift data analyzed this way.
SHIFT PERFORMANCE · AI OEE OPTIMIZATION · MANUFACTURING INTELLIGENCE
Some Shifts Consistently Outperform Others. Now You Can Prove Exactly Why.
iFactory's AI compares performance across every shift, operator, and line to surface the specific practices behind your best results, then recommends how to standardize them everywhere.
THE SHIFT VARIABILITY PROBLEM
Why the Same Line Performs Differently Shift to Shift
Identical equipment, identical product, and identical shift length can still produce noticeably different OEE depending on who is running the line and how. That variability is rarely tracked with enough precision to act on, so gaps between a plant's strongest and weakest shifts tend to persist for years, quietly costing far more output than any single piece of downtime ever would.
Persistent Gap
Between Best and Worst Shift
Many plants carry the same shift-to-shift performance gap for years without addressing it
Undocumented
Reasons Behind Top Shifts
The specific habits or sequencing behind a strong shift are rarely written down anywhere
Slow Spread
Of Good Practices Across Teams
Good practices typically spread informally between operators, if they spread at all
HOW THE ANALYSIS WORKS
From Raw Shift Data to a Standardized Best Practice
1
Every Shift Is Scored the Same Way
OEE, quality, and downtime data is captured consistently across shifts so comparisons are based on identical measurement, not subjective impression.
2
Top-Performing Shifts Are Isolated
The AI ranks shifts by combined OEE and quality performance, filtering out short-term flukes to find genuinely repeatable strong performance.
3
Behavioral and Setting Differences Are Identified
Machine settings, changeover sequencing, and pacing patterns that differ between top and average shifts are surfaced automatically.
4
Recommendations Reach Every Shift
The practices behind top performance are turned into standard guidance shown to every operator, regardless of shift or experience level.
See Which Shift Is Really Your Best, and Why
iFactory scores every shift on your line consistently so strong performance can be identified and repeated with confidence.
WHAT GETS COMPARED
The Signals That Separate an Average Shift From a Great One
Cycle Time Consistency
Top shifts tend to hold a steady cycle time rather than alternating between fast bursts and slow recovery periods.
Changeover Discipline
Faster, more consistent changeovers are one of the most common differences between a strong shift and an average one.
Micro-Stop Frequency
Short, frequent stoppages often separate top shifts from average ones even when total downtime looks similar on paper.
BEFORE AND AFTER STANDARDIZATION
What Happens Once Best Practices Are Shared Across Shifts
Before AI Shift Analysis
Best practices remain informal knowledge held by a few operators
Weaker shifts continue underperforming without a clear explanation
New hires learn inconsistent habits depending on who trains them
OEE gap between shifts stays roughly constant month after month
After AI Shift Analysis
Best practices are documented and pushed to every shift automatically
Underperforming shifts receive specific, targeted improvement guidance
New hires are trained against a proven, data-backed standard
OEE gap between shifts narrows measurably within a few production cycles
SHIFT MATURITY LEVELS
How Shift Comparison Typically Evolves Over Time
| Maturity Level |
Comparison Method |
Standardization Reach |
| Level 1 |
Informal supervisor observation |
Limited to one team |
| Level 2 |
Manual end-of-shift reports |
One line at a time |
| Level 3 |
Dashboard-based shift scoring |
Across a full plant |
| Level 4 |
AI-driven continuous comparison |
Across every plant and shift |
MEASURED RESULTS
Outcomes Reported After Shift-Level AI Optimization
5-8%
Average OEE lift on previously underperforming shifts
50%
Narrower gap between best and worst shift within one quarter
2x
Faster new-operator ramp-up using standardized best practices
Ongoing
Continuous refresh of best practices as new top shifts emerge
FREQUENTLY ASKED QUESTIONS
Questions Teams Ask About AI Shift Optimization
Does this create pressure or blame between operators on different shifts?
The analysis is designed around process conditions and settings rather than singling out individual operators, since the goal is to spread good practices, not assign blame for a slower shift. Reports typically focus on what changed in the process, sequencing, or settings, and recommendations are framed as shared standards every shift can adopt. Most teams find this reframes shift comparison as a coaching tool rather than a scorecard.
Book a demo to see how shift reporting is presented in practice.
How much historical shift data do we need before this becomes useful?
Meaningful comparisons typically start to emerge after a few weeks of continuous data collection, though the analysis becomes more reliable the longer it runs, since a handful of shifts can still be affected by unusual one-off events. Most plants begin seeing actionable, statistically grounded patterns within the first full production month once data is flowing consistently.
Contact support to discuss a realistic timeline for your data volume.
Can the system account for different products running on the same line across shifts?
Yes, comparisons are segmented by product and recipe so a shift running a harder product is not unfairly compared to one running an easier one, which would otherwise distort the results significantly. Product-adjusted benchmarking is one of the first configuration steps completed during setup, tailored to your specific production mix.
Book a demo to review how product mix is handled for your lines.
How are recommendations actually delivered to shift supervisors and operators?
Recommendations surface through the same dashboards and shift-handover reports teams already use, rather than requiring a separate tool to check, which keeps adoption practical instead of adding another system to log into. Guidance is written in plain operational language rather than raw statistics, so it can be acted on directly during a shift.
Contact support to see example delivery formats.
What happens when the current best shift is eventually outperformed by a new one?
The benchmark updates automatically whenever a new top-performing shift is identified, so the standard being taught to the rest of the team keeps improving rather than staying frozen at an earlier level of performance. This keeps the whole comparison system self-improving instead of becoming outdated a few months after it is first set up.
Book a demo to see how benchmarks evolve over time.
Turn Your Best Shift Into Everyone's Standard
iFactory identifies what your top shifts do differently and helps every other shift catch up, automatically.