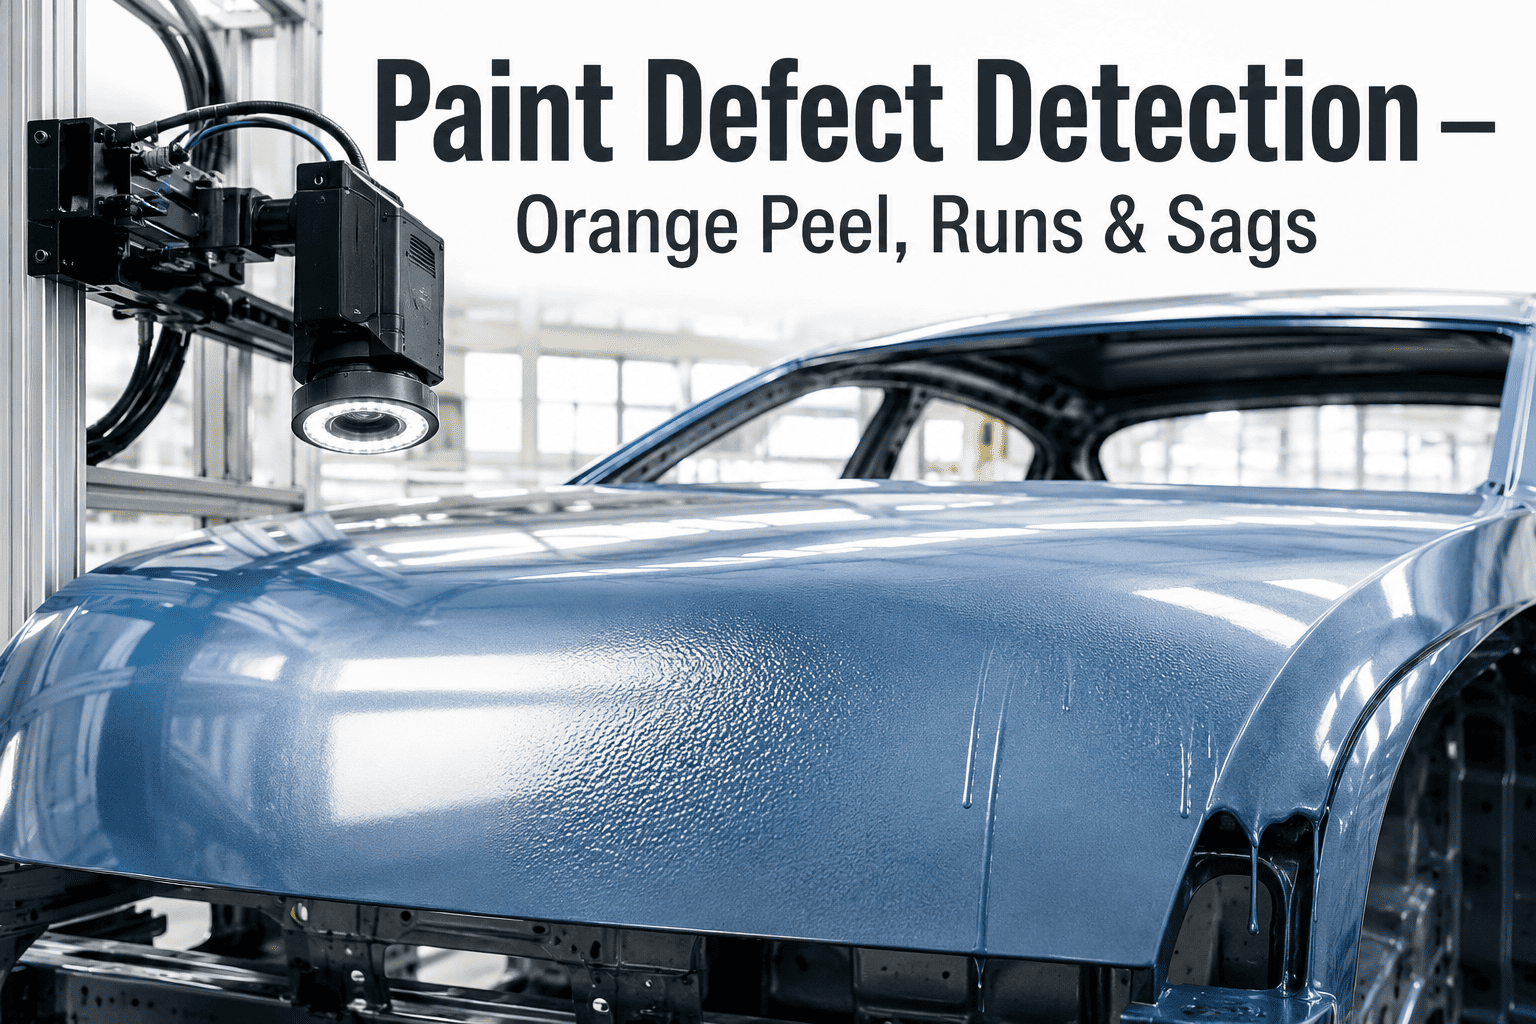
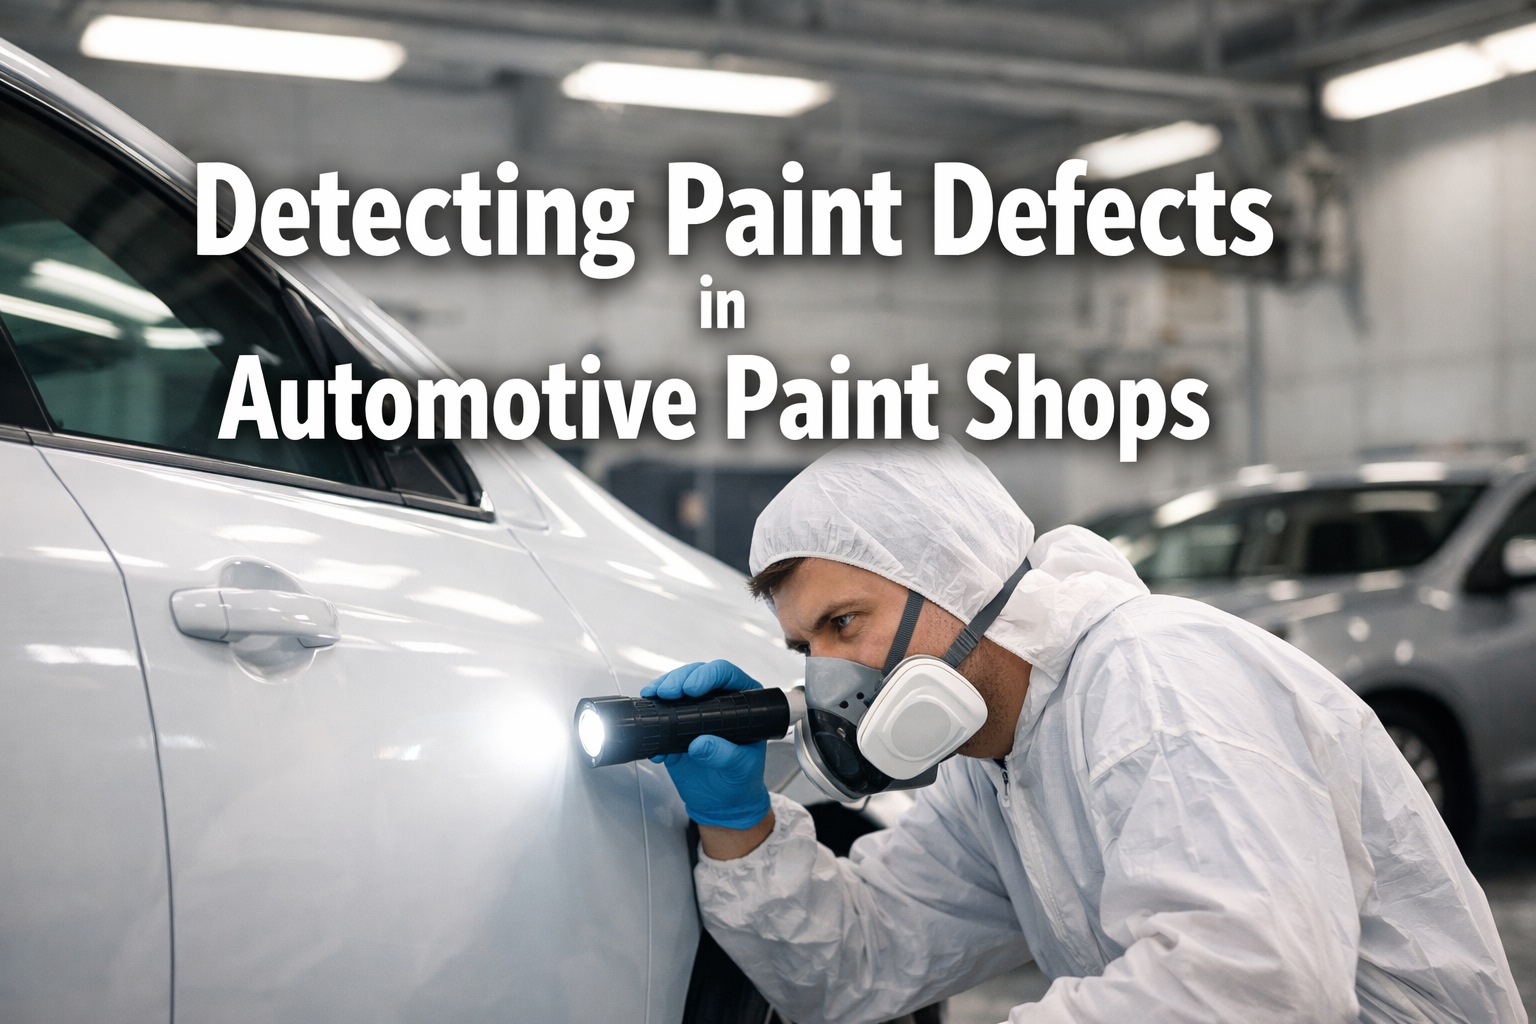
A car's paint is the first thing a customer judges, and the eye is brutally good at it — far better than a single gloss number. Two body panels can read identical gloss yet look completely different: one mirror-sharp, the other faintly dimpled with the wavy light-and-dark pattern the industry calls orange peel. That is because "total appearance" is not one metric but five working together — gloss, distinctness of image, orange peel, haze, and color — and a panel passes the eye only when all of them are right. The trouble is that paint shops have traditionally checked these by hand, a quality engineer carrying a wave-scan and a glossmeter to a handful of bodies per shift, sampling a fraction and hoping the rest match. iFactory's paint surface analysis tracks all five appearance metrics on every body in real time — DOI, gloss, orange peel, haze, and ΔE — so the whole "total appearance" picture is monitored, not sampled.
iFactory Paint Surface Analysis
AI Paint Surface Analysis — DOI, Gloss, Orange Peel
Track DOI, gloss, orange peel, haze, and ΔE across all bodies in real time — the full "total appearance" picture on every unit, on-prem, instead of a handheld spot-check on a few.
5
Appearance metrics, one view
100%
Of bodies tracked, not sampled
Real-time
Drift caught between bodies
On-prem
AI, paint-shop data local
The Live Surface Panel
The platform turns the handheld spot-check into a continuous readout. Every body's appearance metrics land on one panel, each measured against its spec band, so the line sees at a glance which metrics are holding and which are drifting — like the snapshot below, where four of five are in spec and one is trending to the edge.
Paint Surface Metrics — Live, Per Body
DOI
88
In spec
Distinctness of image — sharpness of the reflected image
Gloss
92 GU
In spec
Light reflected at angle — the brilliance of the finish
Orange Peel
9.4
Watch — trending to edge
Surface waviness — the wavy light-and-dark pattern
Haze
8
In spec
Light scatter near the reflection — a milky halo
ΔE
0.42
In spec
Color difference from the target standard
4 / 5
Metrics in spec — orange peel flagged to watch before it fails
Why One Number Can't Describe a Finish
The reason paint shops measure five things is that each captures a different way light interacts with the surface, and the eye notices all of them. A finish that aces gloss can still look cheap if its DOI is poor or its orange peel is high. Treating appearance as a single number is exactly how a body that "passed" gloss ends up rejected at final inspection.
Gloss
How much light the surface reflects at a specific angle, in gloss units (0-100 GU). The baseline brilliance — but two panels can match on gloss and still look very different.
DOI
Distinctness of image — how sharply the surface reflects an image, driven by fine structure below about 0.3mm. Sensitive to subtle scatter that blurs a reflected edge.
Orange Peel
Surface waviness across roughly 0.1 to 30mm wavelengths, seen as a wavy light-and-dark pattern on high gloss. A panel can have low orange peel but poor DOI, or the reverse.
Haze
Light scattered just off the main reflection, appearing as a milky halo around a reflected source — the metric that separates a deep finish from a slightly cloudy one.
ΔE (Color)
The color difference from the target standard. With effect paints on most new cars, holding ΔE tight across panels is what keeps a body looking like one harmonious color.
Total Appearance
The combination the eye actually judges. No single metric stands in for it — only all five together describe how a finish will be perceived.
Want to see all five metrics tracked on your own bodies instead of a handheld sample? Book a 30-minute walkthrough and we'll run the live surface panel on your line data.
Sampling a Few vs Measuring Them All
The classic approach is a quality engineer with a wave-scan checking a handful of bodies a shift. It works until it doesn't: a process drift between samples paints a hundred bodies with rising orange peel before the next manual check catches it. Continuous measurement closes that window, watching every body and flagging the drift while it is still a trend, not a reject pile.
Handheld Spot-Check
Measure a Few, Hope for the Rest
A quality engineer samples a fraction of bodies per shift by hand
Drift between checks paints many bodies before anyone notices
Metrics recorded in separate logs, rarely seen together in real time
Appearance problems surface at final inspection, after the cost is sunk
Continuous Surface Analysis
Every Body, All Five Metrics
DOI, gloss, orange peel, haze, and ΔE captured on every body
Drift flagged as a trend, before it crosses the spec limit
All five metrics on one panel, per body, in real time
The defect is caught in the booth, not at final inspection
A Drifting Metric Points to a Process
The real payoff is that each appearance metric maps back to a controllable process variable. Rising orange peel points to atomization, viscosity, or film build; a haze increase suggests contamination or cure; a ΔE shift flags the color mix or application. When the analytics ties the metric trend to the likely cause, the booth adjusts before the next body — appearance monitoring becomes process control.
Orange peel rising
Atomization, viscosity, or film-build drift
DOI dropping
Fine-structure scatter from flow or leveling
Haze increasing
Contamination or cure condition shift
ΔE moving
Color mix, application, or batch variation
What the Analytics Does
The platform handles capture, scoring, and alerting across all five metrics, on every body, so the paint shop sees its true appearance state continuously rather than in periodic snapshots.
Five Metrics, One Panel
DOI, gloss, orange peel, haze, and ΔE captured and shown together per body, so total appearance is visible at a glance.
Per-Body, Not Per-Sample
Every body measured rather than a handful per shift, closing the gap where drift used to hide between manual checks.
Spec-Band Flagging
Each metric scored against its OEM spec band, with a "watch" state when a value trends toward the edge before it fails.
Trend to Cause
Metric trends tied to the likely process variable, so a drift becomes an actionable adjustment, not just a reading.
Body & Panel Mapping
Results mapped by body and panel position, surfacing whether a problem is whole-body or localized to a zone.
On-Prem AI
Runs in the plant on dedicated AI hardware, keeping color standards and paint-process data local and the analysis low-latency.
Want the surface analytics wired to your booth so every body is scored automatically? Talk to our paint-shop engineers about connecting your line.
From Reading to Booth Adjustment
The value is realized in the loop between measuring the surface and correcting the process. Because every body is scored in real time and each metric maps to a cause, an appearance drift becomes a booth adjustment made before the next body — not a batch of rejects discovered later.
The Appearance-Control Loop
1
Measure
All Five
DOI, gloss, orange peel, haze, and ΔE captured on every body
2
Score
Vs Spec
Each metric checked against its band, watch-flagged before it fails
3
Trace
To Process
A drifting metric tied to atomization, cure, color, or film build
4
Adjust
Before Next Body
The booth corrects the variable, holding the finish in spec
What Continuous Surface Analysis Delivers
Tracking all five metrics on every body converts into fewer reworked finishes, more consistent appearance across panels, and process problems caught at the source. These reflect how appearance metrics are measured and applied in automotive paint shops.
5
Metrics, every body
the full total-appearance picture, not one number
100%
Coverage, not sampling
drift caught between bodies, not at the next manual check
Trend
Caught before fail
a watch flag while the metric is still in spec
In-booth
Not at final
the appearance defect corrected before paint cures on more bodies
Every harmonious body and every avoided rework starts with measuring all five on all of them. Want it scoped to your color standards and spec bands? Talk to our paint-shop engineers.
Frequently Asked Questions
Why measure five metrics instead of just gloss?
Because gloss alone doesn't describe how a finish looks. Two panels can read identical gloss yet appear completely different — one sharp, one dimpled with orange peel, one slightly hazy. Gloss, DOI, orange peel, haze, and color each capture a distinct way light interacts with the surface, and the eye notices all of them. Only the combination — "total appearance" — predicts whether a body will pass visual inspection and satisfy a customer.
What's the difference between DOI and orange peel?
They describe structure at different scales. Orange peel is the broader waviness, roughly 0.1 to 30mm, seen as a wavy light-and-dark pattern on a glossy surface. DOI — distinctness of image — is about how sharply the surface reflects an image, driven by finer structure below about 0.3mm. A panel can have low orange peel but poor DOI, or the reverse, which is why both are measured rather than assuming one implies the other.
How is continuous measurement better than a wave-scan spot-check?
A handheld wave-scan checks a handful of bodies per shift, so a process drift between samples can paint many bodies with rising orange peel before the next manual reading catches it. Continuous analysis measures every body and shows all five metrics together in real time, flagging a metric as it trends toward its limit — so the problem is caught as a trend in the booth rather than as a reject pile at final inspection.
Can the metrics tell us what to fix, not just that something's wrong?
Yes — that's the point of tying trend to cause. Each appearance metric maps to controllable process variables: rising orange peel points to atomization, viscosity, or film build; increasing haze to contamination or cure; a ΔE shift to color mix or application. When the analytics links a drifting metric to its likely cause, the booth can adjust the right variable before the next body, turning appearance monitoring into process control.
Why does on-prem matter for paint surface analysis?
Because color standards and paint-process data are proprietary, and the control loop needs to be fast. Running on dedicated AI hardware in the plant keeps your color targets, formulations, and process data inside the building, and gives the low latency needed to score a body and flag a drift in time to adjust the booth before the next unit. It's both a data-protection and a real-time-control decision.
The Eye Sees All Five. So Should the Line.
See the Live Surface Panel on Your Bodies — in 30 Minutes
Bring your color standards and a line that matters. We'll show DOI, gloss, orange peel, haze, and ΔE tracked on every body, the watch flag firing as a metric trends to its edge, and each drift traced to the booth variable behind it — on-prem, your paint-shop data local.
Trend
Flagged before fail