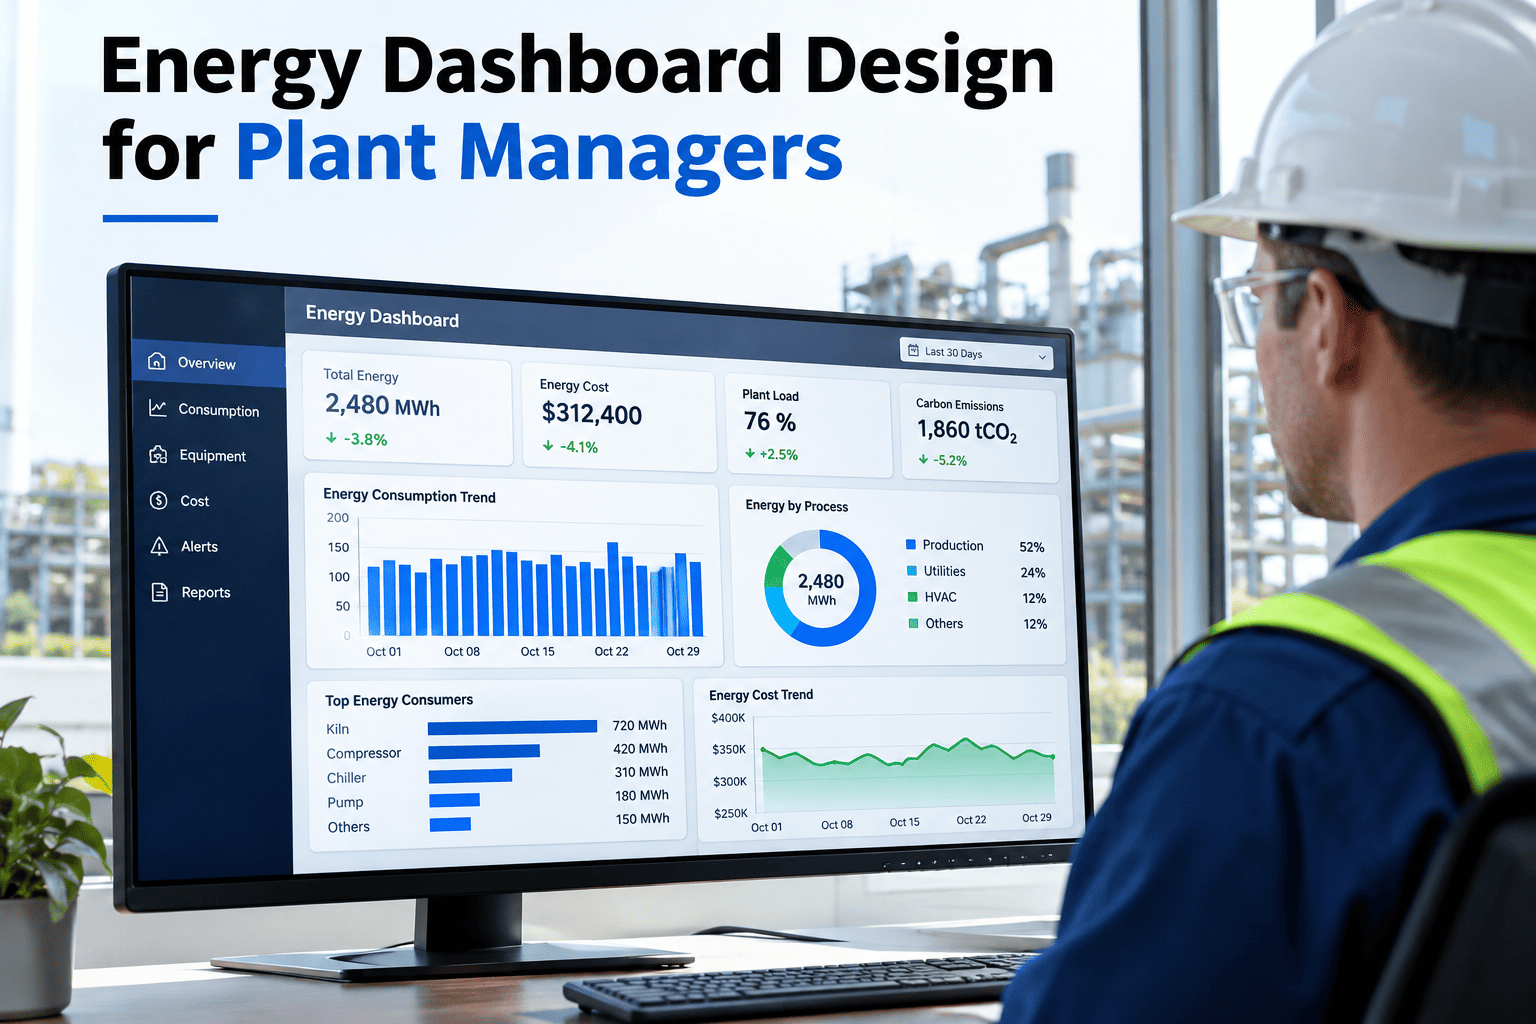
A plant's utility bill tells you what energy cost last month. It does not tell you which machine drove the peak demand charge, whether energy intensity per unit is getting better or worse, or that a compressor has been quietly running overnight with nothing scheduled. An energy dashboard built around those five questions — machine consumption, output, intensity, peak demand and abnormal events — turns a monthly bill into something a plant manager can actually act on day to day. Plant managers designing their own version can review a dashboard layout against their own energy meters with iFactory AI.
Energy Optimization · Plant Energy Dashboard Design
A Utility Bill Tells You What Happened. A Dashboard Should Tell You Why.
iFactory AI connects machine-level consumption, production output, energy intensity, peak demand and abnormal events into one dashboard built for daily decisions, not monthly surprises.
The Five Questions Every Plant Energy Dashboard Should Answer
A dashboard crowded with every available chart is harder to use than one built around a short list of questions a plant manager actually needs answered. These five cover the ground that matters for day-to-day energy decisions.
Which machine is using the most?
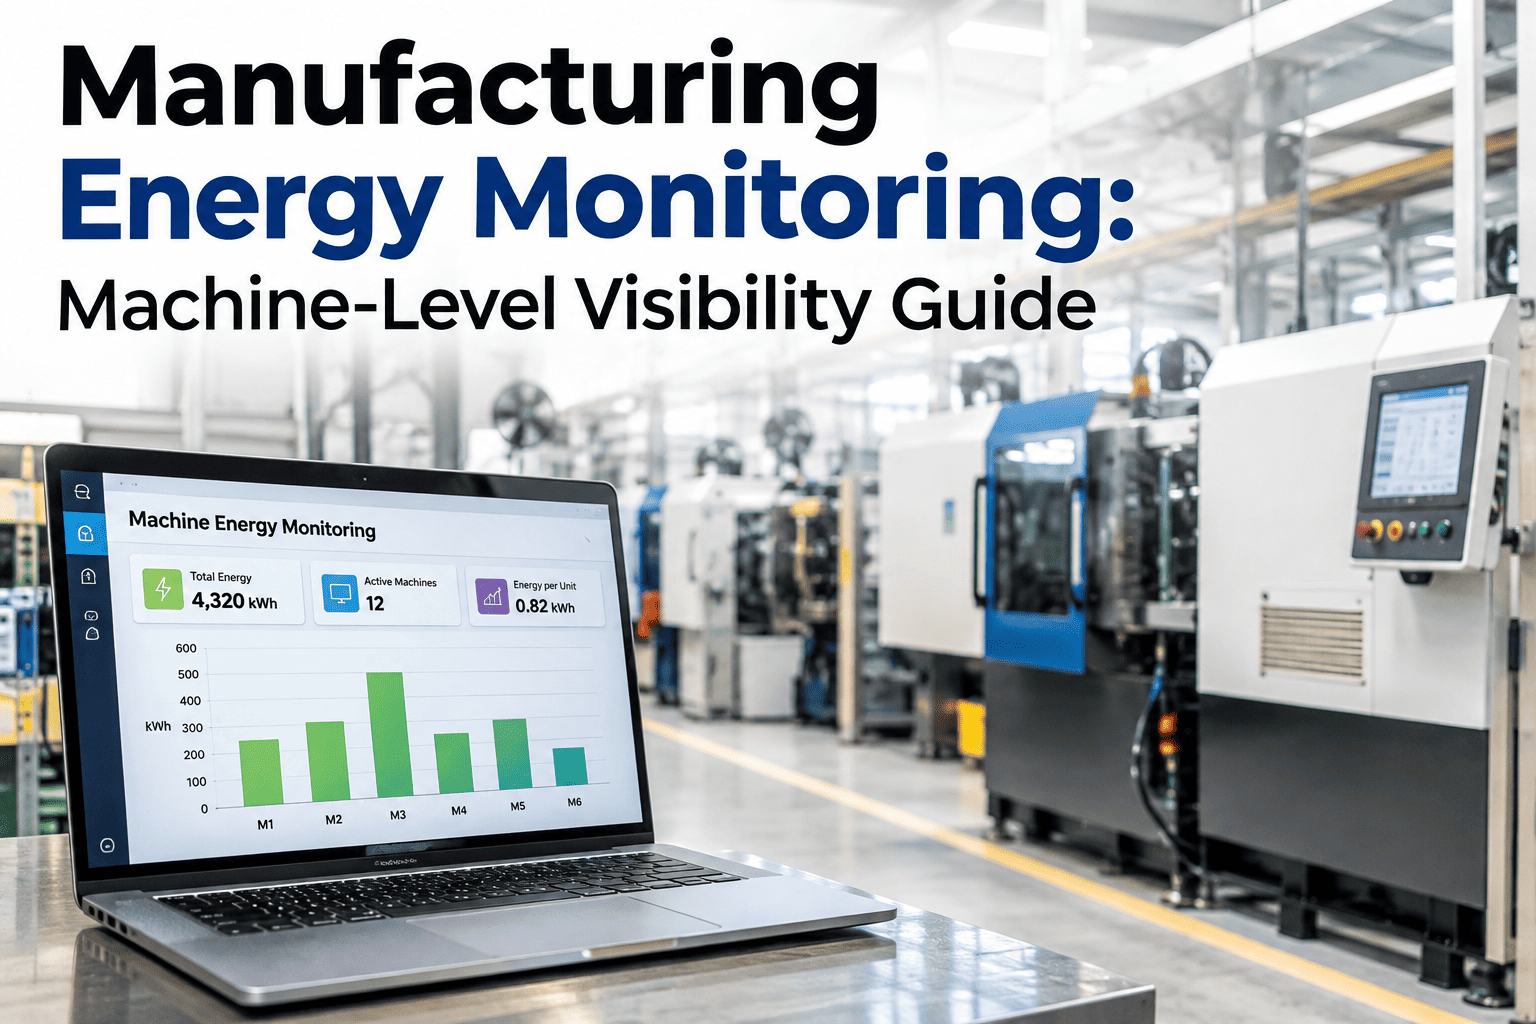
Consumption broken down by machine or line, not just a plant-wide total.
Is intensity improving?
Energy per unit produced, tracked over time, not raw consumption alone.
What's driving peak demand?
The specific load or timing that sets your demand charge each billing period.
Is anything running abnormally?
Equipment consuming energy outside its expected pattern for the current schedule.
Why Energy Intensity Matters More Than Raw Consumption
Raw energy consumption naturally rises and falls with production volume, which makes it a poor measure of whether the plant is actually getting more efficient. Energy intensity — consumption per unit produced — strips out the volume effect and shows whether efficiency is genuinely improving or just riding a quieter production month.
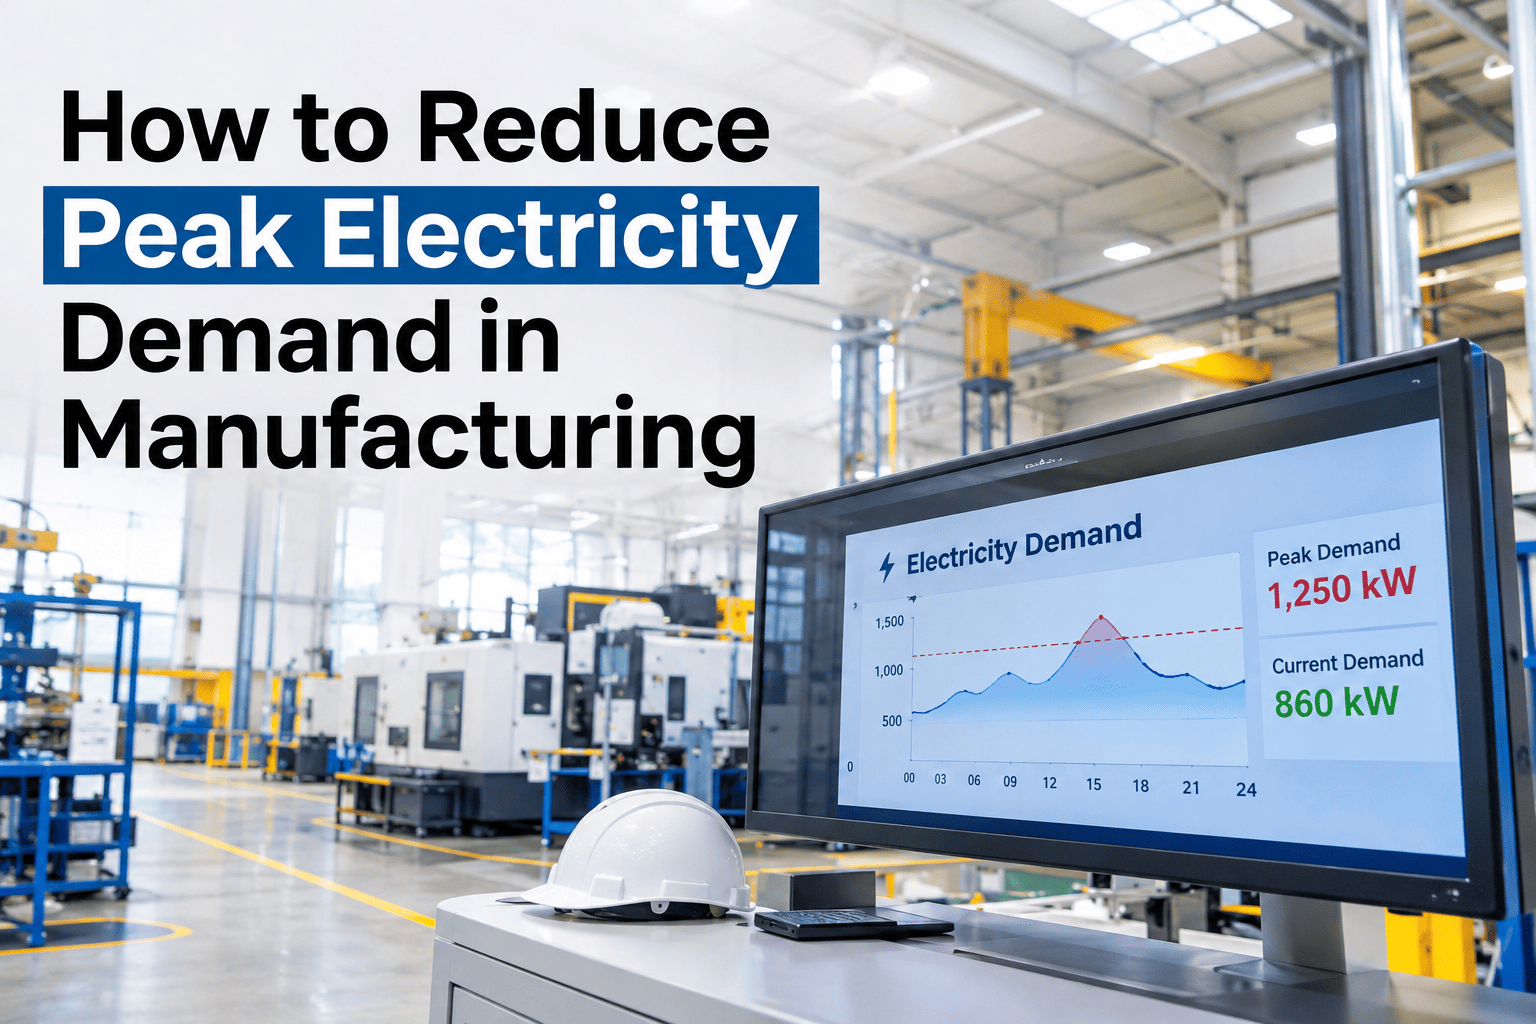
Illustrative peak demand across a 24-hour period
MidnightShift changePeakWind-down
The single peak hour often sets the demand charge for the entire billing period — which is why knowing what drove that one hour matters more than the daily average.
See Your Own Peak Demand Driver, Not a Generic Chart
Share a recent interval meter export and a short session will show exactly which machine or event set last month's peak.
Designing the Abnormal-Event Layer
1
Set an expected pattern
Establish what normal consumption looks like per machine, per schedule state.
2
Flag deviations
Consumption outside that pattern, such as off-hours draw, gets flagged automatically.
3
Attribute the event
Tie the flag to a specific machine and time window, not a vague plant-wide anomaly.
4
Track resolution
Confirm whether the abnormal pattern was explained, fixed, or is still recurring.
A Composite Scenario: The Compressor Nobody Had Scheduled
A plant's monthly energy bill had been drifting upward for several months with no obvious production increase to explain it. Breaking consumption down by machine on a dashboard built around these five questions showed a compressor running at near-full load overnight, well outside its expected schedule, for weeks before anyone noticed on a plant-wide total. A stuck control valve was found and fixed within a day of the pattern being flagged — a fix that iFactory AI's team can help your own plant find from existing meter data, rather than waiting for the pattern to surface in a bill review months later.
Frequently Asked Questions
What metering do we need before building a machine-level dashboard?
Submetering at the machine or line level, rather than a single plant-wide meter, is what makes machine-level consumption and abnormal-event detection possible, so an early step is usually identifying where submeters are missing.
Review your current metering coverage with our team.
How is energy intensity calculated when we run multiple product types?
Intensity is usually calculated per product type separately, since different products can have very different energy requirements, rather than blending them into one misleading plant-wide average.
Ask support how this is handled for a mixed product mix.
How do we know what "normal" consumption looks like before flagging abnormal events?
A baseline built from several weeks of historical consumption per machine and schedule state gives a reasonable starting definition of normal, which then gets refined as more data comes in.
Discuss baseline setup for your specific equipment.
Can this dashboard help us avoid demand charges, not just explain them after the fact?
Identifying which loads reliably drive peak demand lets a plant stagger or shift those loads proactively, turning the dashboard from a historical record into a tool for avoiding the charge in future periods.
Our team can discuss load-shifting strategies based on your peak drivers.
How often should this dashboard actually be reviewed?
Daily or weekly review catches abnormal events while they are still cheap to fix, while a monthly review focused on intensity trends and peak demand drivers supports longer-term planning.
Set a review cadence that fits your plant's operating rhythm.
Build a Dashboard That Explains the Bill, Not Just Reports It
iFactory AI connects machine consumption, intensity, peak demand and abnormal events into one actionable view. Book a walkthrough with your own energy data.