An energy manager at a 280,000 sq ft automotive components plant once described the moment he understood submetering. The plant had spent ₹38 crore on electricity over the prior fiscal year and the engineering team had been arguing for nine months about where the waste was. One submeter went on the compressed air header. Within three days it revealed 14% of total electricity was being consumed by an air system whose nominal load justified roughly 9%. Over the next eleven months the air audit, leak repairs, and pressure setpoint reduction recovered ₹1.4 crore — from a single ₹35,000 meter point. This page is the business case for plant managers and energy leads who need to know whether the same math works for their plant, and how to present equipment submetering as a capital investment rather than another instrumentation project.
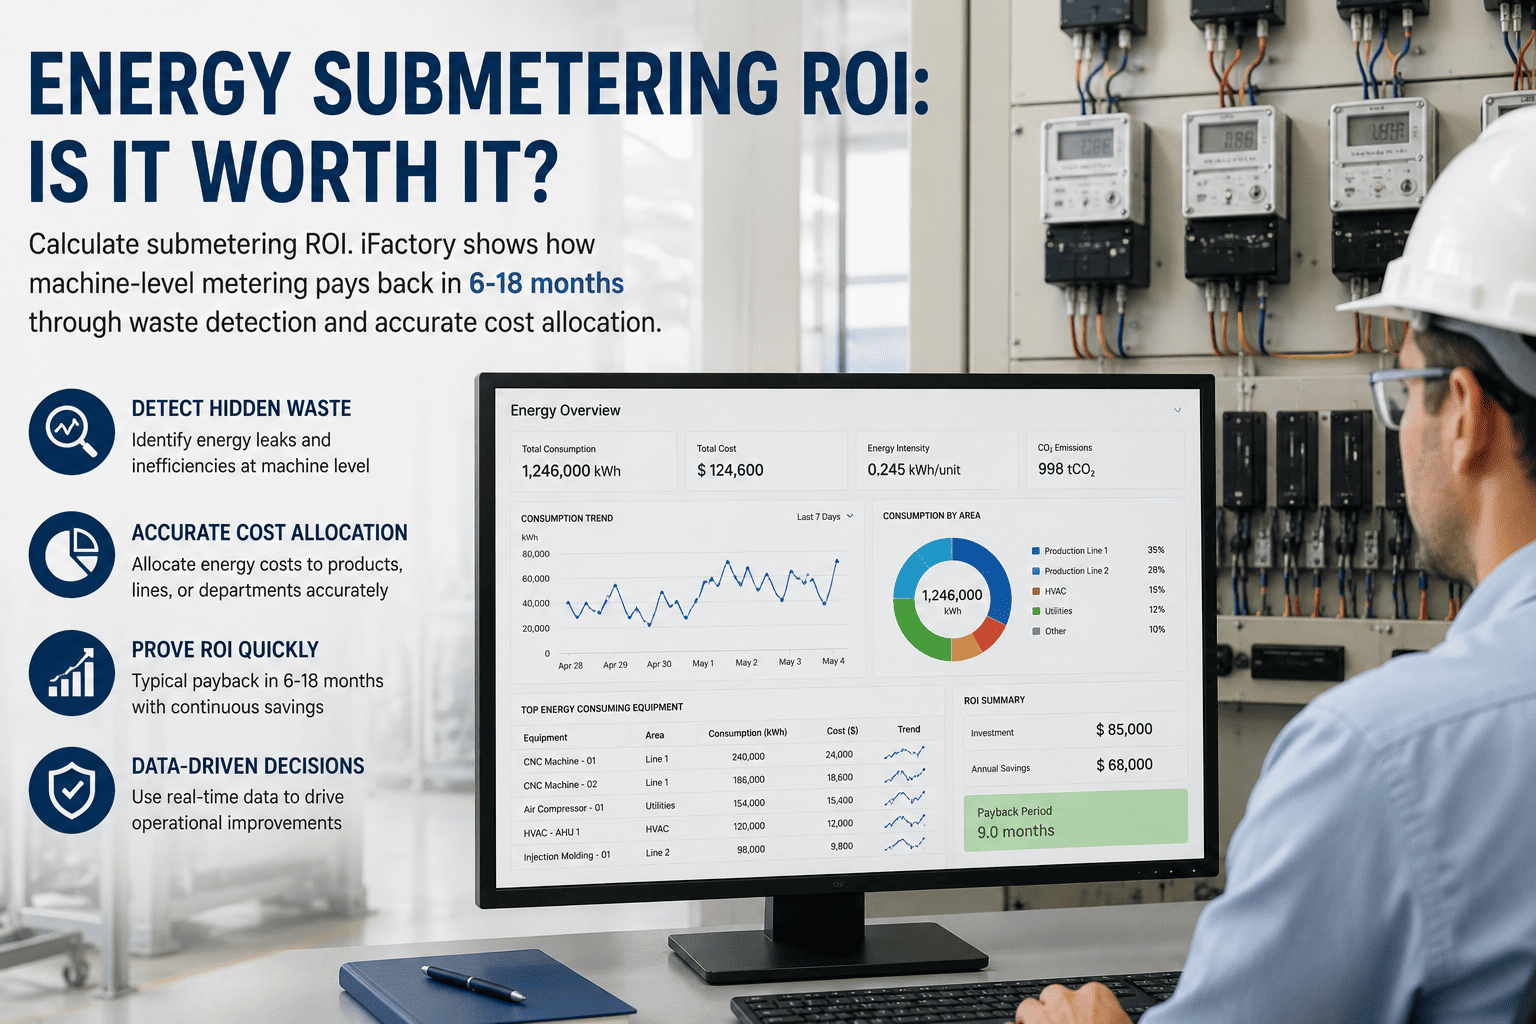
Energy Submetering ROI — Is It Worth It? Yes, in 6–18 Months, Here Is the Math
Industrial energy spend runs 25–40% of total operating cost in most discrete manufacturing plants. Plant-level metering tells you the total; equipment-level submetering tells you which assets, which shifts, which products, and which loads are responsible. This page is the calculator and the worked example — built for the case you have to present, not the slide deck you have to design.
What Submetering Sees That a Main Utility Meter Cannot
A main utility meter tells you the plant consumed 1.2 GWh last month. That is the question for the billing department. The questions that matter for the plant — which lines, which assets, which shifts, which products consumed that 1.2 GWh — require metering at a different level of the hierarchy. Submetering closes the visibility gap between "the plant" and "the asset."
Main Utility Meter
One meter. Tells you total consumption, demand, and power factor at the plant boundary. Useful for the utility bill. Useless for diagnosing waste.
Visibility: plant totalFeeder Submeters
One meter per main distribution feeder — paint shop, BIW, GA, utilities, HVAC. Tells you which department is the heaviest user.
Process Submeters
One meter per major utility — compressed air, chilled water, hot water, steam. Reveals which utility infrastructure is the largest consumer.
Building Submeters
One meter per building or zone. Reveals lighting, ventilation, and base-load consumption patterns by area.
Why Tier 3 is where the ROI lives
Tier 1 and Tier 2 visibility tells you the plant has a problem. Tier 3 visibility tells you which compressor is leaking, which oven is running outside takt time, and which product line is consuming twice the energy of its sister line. The first two tiers are diagnostic. The third tier is operational — and operational data is where the savings come from.
Five Drivers That Produce the 5–15% Savings Range
The 5–15% savings range is not one big win. It is five compounding sources, each typically worth 1–4 percentage points on its own. Plants that achieve the high end of the range are running all five drivers; plants in the low end usually have one or two strong and the rest dormant.
Phantom & Idle Load Reduction
Typical contribution: 2–5% of total energy spend
Compressed air systems run during weekends with no production load. Ovens stay at temperature through scheduled maintenance shutdowns. Robots hold position with motor drives energised through long idle periods. Submetering surfaces all of it in week one. Most plants find at least one continuous load they did not know existed.
Accurate Cost Allocation & Accountability
Typical contribution: 1–3% of total energy spend
When line managers are charged for the energy they actually consume — not a flat allocation across departments — behaviour changes. Engineers turn off equipment between batches. Operators avoid running secondary lines for partial loads. Cost-center reporting in itself produces a measurable change because attention follows accountability.
Demand Management & Peak Shaving
Typical contribution: 1–4% of total energy spend
In markets with time-of-use tariffs or demand charges, scheduling high-consumption operations away from peak windows is the single largest financial lever. Submetering enables it because you can see, in real time, which assets are pushing total demand toward the peak threshold. Without that visibility, peak shaving is guesswork.
Equipment Benchmarking & Outlier Detection
Typical contribution: 1–3% of total energy spend
Two identical machines running the same product almost never consume the same energy. The 10–20% outlier is usually a deteriorated motor, a worn bearing increasing friction, a leaking valve, or a control loop that is running open. Submetering makes the comparison automatic and reveals the outlier within days.
Energy per Unit (kWh / Unit) Tracking
Typical contribution: 1–3% of total energy spend
Linking submeter data to production count turns kWh into kWh-per-unit-produced — the only metric that connects energy directly to throughput. It enables productivity tracking, batch comparison, supplier benchmarking, and Scope 3 carbon-per-unit reporting. Used well, it drives behavioural change because operators can see their shift performance.
Worked ROI Calculation — 280,000 sq ft Discrete Manufacturing Plant
The example below is the same plant from the opening paragraph — automotive components, 22 production lines, ₹38 crore annual energy spend, no submetering before the project. Numbers shown are representative for a discrete-manufacturing plant of this scale; calibrate to your own utility rates and meter point count.
Define the investment
Establish the annual energy baseline
Project the savings by driver (Year 1)
Compute the payback
Year-3 cumulative net position
Investment recovered by Month 20. Years 2 and 3 are pure savings against the same baseline. By end of Year 3, cumulative net benefit is approximately $1.18 million — and savings persist for the 10–15 year service life of the metering hardware.
Typical Payback Window by Manufacturing Sector
Payback period varies meaningfully by industry — driven by energy intensity, tariff structure, and the share of consumption that is genuinely controllable. Sectors with high baseline energy intensity and process loads tend to recover the investment fastest.
| Sector | Energy share of opex | Typical Year-1 savings | Typical payback | Strongest driver |
|---|---|---|---|---|
| Foundry / metal casting | 35–45% | 10–15% | 6–9 months | Peak shaving on induction furnaces |
| Cement | 30–40% | 8–12% | 7–11 months | Mill optimisation, kiln scheduling |
| Steel / heat treatment | 30–40% | 8–13% | 8–12 months | Furnace idle reduction, electric arc scheduling |
| Chemical / specialty | 20–30% | 7–11% | 10–14 months | Steam & cooling-water benchmarking |
| Automotive (BIW & paint) | 15–25% | 7–10% | 12–18 months | Compressed air, paint shop oven scheduling |
| Food & beverage | 10–20% | 6–10% | 14–20 months | Refrigeration, CIP cycle optimisation |
| Pharma OSD | 10–15% | 5–8% | 18–24 months | HVAC and cleanroom benchmarking |
| Discrete assembly | 8–15% | 5–8% | 16–22 months | Phantom load, equipment outlier detection |
Get a site-specific ROI estimate
We pull your last twelve months of utility bills, walk down one production area, and deliver a site-specific ROI calculation against the methodology on this page — meter point count, investment, expected savings by driver, projected payback. No commitment, takes one site visit.
- Utility-bill analysis
- Meter point inventory
- Driver-by-driver savings projection
- Payback timeline for your tariff structure
- Pre-configured NVIDIA AI server, racked and ready
- Live in 6–12 weeks across pilot zones
What Makes Payback Faster, What Slows It Down
The same plant can land anywhere in the 6–18 month payback range depending on six modifiers. Knowing your own modifier profile before the project starts sets honest expectations and points the deployment at the highest-leverage areas first.
Accelerators (faster payback)
Decelerators (slower payback)
Compliance and Reporting Value That Does Not Show in Payback
The ROI calculation captures the energy savings. It does not capture the regulatory, compliance, and reporting value that submetering enables. For plants subject to BEE / PAT, ISO 50001, CSRD, or customer-mandated Scope 3 reporting, this additional value is material — and the data infrastructure required is essentially the same submetering project.
ISO 50001 — Energy Management System
Submetering data is the operational backbone of an ISO 50001 EnMS. Energy Performance Indicators (EnPIs) and Energy Baselines (EnB) per ISO 50006 require asset-level data that only submetering provides.
BEE PAT scheme (India) — Designated Consumers
The Perform-Achieve-Trade scheme for designated consumers requires accurate measurement and verification against assigned Specific Energy Consumption (SEC) targets. Submetering provides the trail.
IPMVP M&V Protocols
The International Performance Measurement and Verification Protocol Option B (retrofit isolation, all parameter measurement) and Option C (whole facility) both require detailed submetering data to validate savings claims.
CSRD / ESRS / Scope 2 GHG reporting
Corporate Sustainability Reporting Directive requires location-based and market-based Scope 2 emissions reporting. Asset-level submetering enables product-level carbon attribution that Scope 3 reporting will soon mandate.
Customer-mandated carbon disclosure
OEM customers — particularly in automotive and electronics — increasingly require per-part energy and carbon disclosure from Tier 1 suppliers. Submetering is the only way to produce defensible per-unit numbers.
Green building certifications (LEED, IGBC)
Operational energy performance credits in LEED v4.1 and Indian IGBC certifications require granular consumption data that aggregated utility bills cannot supply.
Case Study — Automotive Components, ₹38 Cr Energy Spend
The plant from the opening paragraph. Automotive components Tier 1 supplier, 280,000 sq ft, 22 production lines across stamping, machining, sub-assembly, paint, and final assembly. 480 submeter points deployed across 14 months in three waves. The numbers below are the audited 24-month outcome against the deployment baseline.
| Metric | Pre-deployment (baseline) | After 24 months | Change |
|---|---|---|---|
| Annual energy spend | ₹38.0 Cr | ₹33.4 Cr | −12.1% |
| Peak demand (kW) | 4,850 | 4,340 | −10.5% |
| Energy per vehicle equivalent | 1.00 (index) | 0.89 (index) | −11.0% |
| Identified phantom loads | Unknown | 14 distinct sources, all eliminated | — |
| Equipment outliers identified | 0 | 23 machines, all serviced or replaced | — |
| ISO 50001 certification status | Not certified | Certified in Month 18 | Achieved |
| Time to produce Scope 2 carbon report | 3–4 weeks per quarter | One click, real-time | Eliminated |
| Cumulative net benefit through Month 24 | — | ₹4.2 Cr | Investment recovered in Month 21 |
Where the savings actually came from in this case
The compressed air system was the single largest discovery — a leak audit triggered by submeter data revealed losses worth roughly 3.8% of the total bill, eliminated over four months. Paint shop oven scheduling fixes contributed another 2.4%. The third largest contributor was unexpected: a chiller plant cost-allocation report led the operations team to consolidate three running chillers into two during low-load periods, worth 1.9% on its own.
Six-Phase Submetering Rollout — Pilot to Plant-Wide
A submetering deployment that respects the ROI math works in waves — install the highest-impact points first, prove savings, then expand. Trying to meter everything on day one is how budgets get cut after Phase 2 fails to show measurable benefit.
Energy Audit and Meter Point Prioritisation Week 1–3
Twelve months of utility bills, single-line diagrams, equipment list. Rank meter points by expected ROI — biggest loads first, peak-contribution drivers next, allocation-sensitive areas third. Output: prioritised 500-point list.
Wave-1 Installation — Top 100 Points Week 4–10
Install the 100 highest-ROI points first. Largest motors, compressors, ovens, chillers, peak-contribution loads. Non-invasive current transformers and Modbus / Ethernet gateways. No equipment downtime required.
Baseline Collection and Quick Wins Week 11–18
Six to eight weeks of baseline data. Quick-win audits — compressed air leaks, idle loads, after-hours consumption. First identified savings are typically 2–4% of total bill, secured before the rest of the install completes.
Wave-2 Installation — Next 200 Points Week 19–28
Mid-tier loads, departmental allocation, building zones, lighting circuits. Funded partially by the Wave-1 quick wins. Cost-center reporting begins as data fills in.
Operationalisation and Dashboard Rollout Month 7–9
Per-line and per-area dashboards delivered to operations and engineering. Operator displays show kWh per unit in real time. Monthly energy review meetings begin. Equipment outliers identified and addressed.
Wave-3 Completion and Compliance Month 10–14
Final 180+ points installed. ISO 50001 / BEE PAT compliance reporting goes live. Scope 2 carbon reporting automated. Project formally closed with audited savings calculation, typically delivering 7–12% in Year-1 against baseline.
Submetering ROI — Common Questions
Are the 5–15% savings claims realistic, or marketing inflation?
The range is well-documented across industry studies — US Department of Energy, EPRI, and IPMVP-validated projects consistently report 5–15% on plants moving from no submetering to comprehensive asset-level metering. The low end (5–7%) is the typical figure for already-efficient plants; the high end (12–15%) is typical of plants with no prior submetering and high energy intensity. Greenfield-data plants in foundry, cement, and steel routinely exceed 10%.
Do we need to install meters during planned shutdowns?
No, in most cases. Modern non-invasive current transformers clamp around existing conductors and install while the equipment is running. Voltage taps are required at the panel, typically done during normal maintenance access windows. Only a small subset of installations — usually old switchboards or compact panels — need a shutdown window.
How does this compare to a standalone energy management software project?
Software without submetering is dashboard polish over the same dataset you already have. The 5–15% savings range exists because of the new data submetering provides — without the data, the software cannot identify what the existing reporting could not. Hardware is the unlock, software is the interface.
What is the difference between full sub-metering and AI-driven disaggregation?
Disaggregation (NILM / non-intrusive load monitoring) uses signal processing to infer individual loads from a single meter — useful for buildings and small plants where physical metering is impractical. Disaggregation accuracy on industrial loads is typically 70–85%; physical submetering is 99%+. For plants where the savings target is millions of dollars, the precision premium of physical metering pays for itself.
Are these savings sustainable, or do they erode after the first year?
Sustainable, provided the dashboards and review cadence are kept active. The Year-1 savings come from one-time waste discoveries — phantom loads eliminated, leaks repaired, outliers fixed. Years 2 and 3 maintain those gains and add new ones through cost-center reporting and operator behavioural change. Plants that abandon the review cadence after the initial wins typically see 30–50% drift back within three years.
Do we need to buy NVIDIA AI servers separately?
No. The fully-loaded AI server is supplied pre-configured and pre-loaded with the submetering platform, dashboards, ISO 50001 / BEE PAT compliance reports, IPMVP M&V workflows, and Scope 2 carbon-reporting engines. On-premise, no cloud, no egress. Rack it, connect power and Ethernet, and the system goes live. Cabling, meter integration, training, and 24×7 remote monitoring are all included.
What is the typical timeline from contract to first savings recognised?
Live in 6–12 weeks for the Wave-1 install. Three-phase delivery: weeks 1–4 — energy audit and prioritisation. Weeks 5–8 — Wave-1 hardware install and gateway commissioning. Weeks 9–12 — baseline collection begins, first quick-win savings identified within the first month of data. Full Year-1 savings typically realised by month 12–14.
Stop Paying for Energy You Cannot See
Hardware + software bundle. Pre-configured NVIDIA AI server, racked and ready, on-premise — no cloud, no data egress. Pre-loaded with submetering platform, ISO 50001 / BEE PAT compliance reports, IPMVP M&V workflows, and Scope 2 carbon-reporting engines. Non-invasive meters, cabling, integration, operator training, and 24×7 remote monitoring all included. Live in 6–12 weeks. Trusted by 1000+ industrial clients with 99.9% uptime.