Every food plant manager knows the feeling: a HACCP deviation at 2 AM, a foreign object recall threatening $4M in revenue, a line changeover burning 90 minutes of capacity — and no system connecting these failures to a dollar figure leadership can act on. The cost of inaction is not a future risk. It is happening on every shift, in every missed yield, in every recall that could have been caught three batches earlier. The gap between a food plant running on tribal knowledge and one running on AI analytics is no longer a technology gap. It is a survival gap.
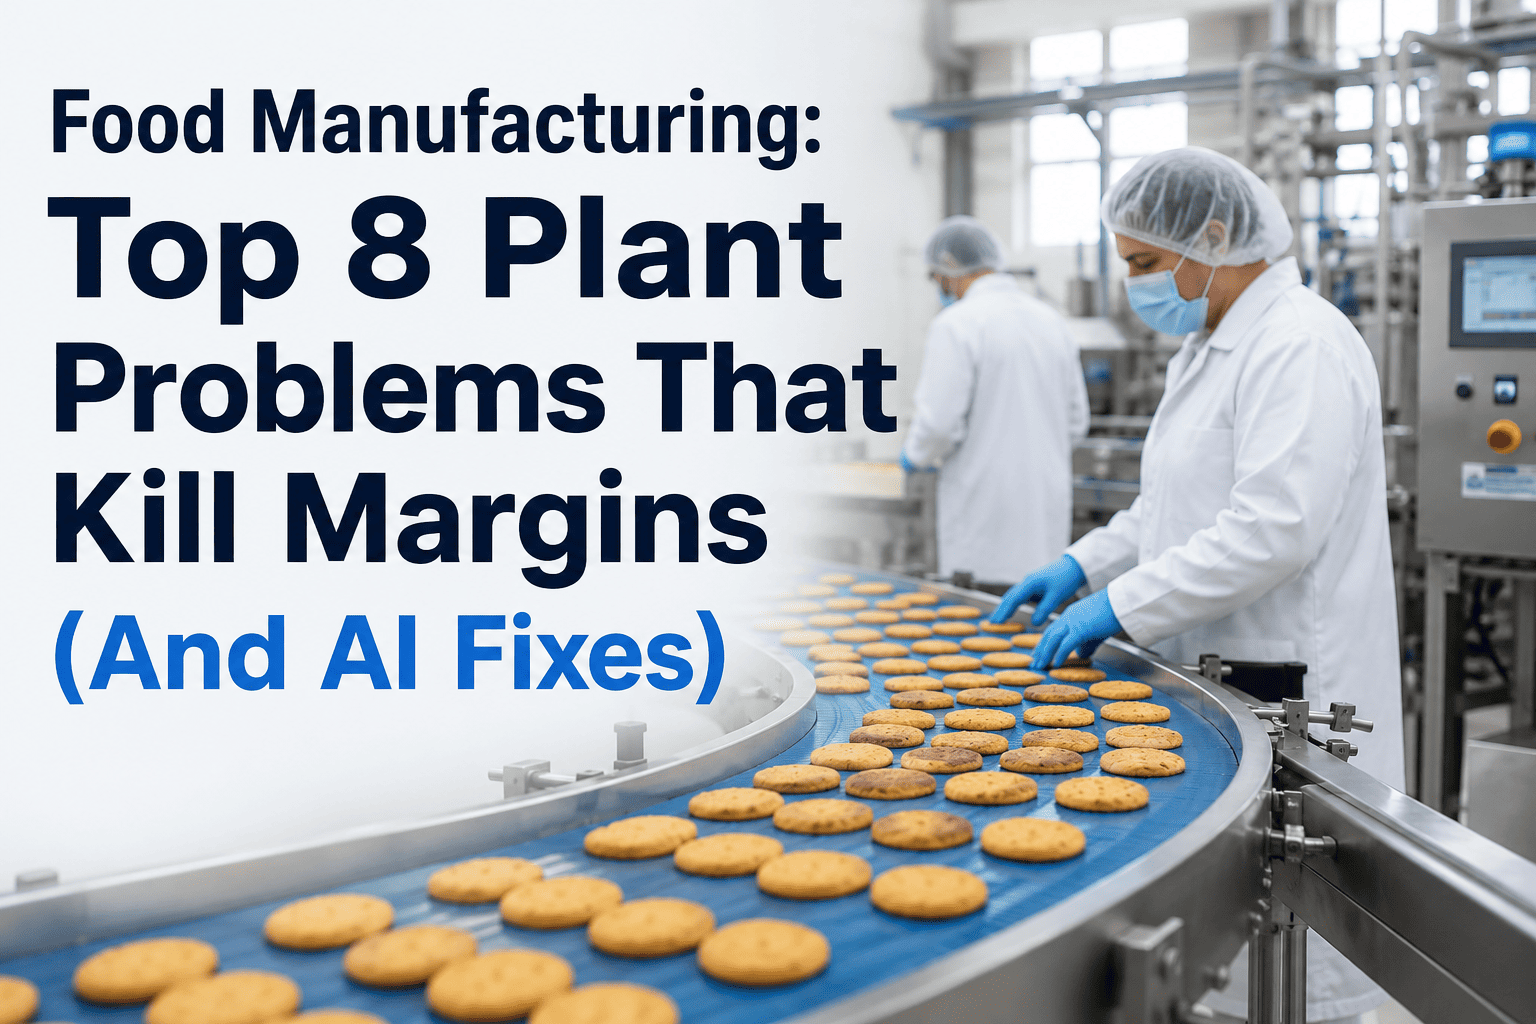
Food Manufacturing: Top 8 Plant Problems That Kill Margins — And How AI Fixes Each One
Why Food Plant Margins Are Under Siege in 2025
Food and beverage manufacturers face a uniquely brutal combination: wafer-thin margins (2–5%), zero tolerance for quality failures, relentless regulatory pressure, and labor costs that compound every inefficiency. A single unplanned line stoppage costs $50,000–$260,000 per hour. A single HACCP deviation can trigger a full-batch hold. A product recall averaging $10M in direct costs can erase years of operating profit. Yet most plants still run on reactive maintenance calendars, manual SPC checks, and institutional knowledge walking out the door with retiring technicians. AI-powered analytics changes this calculus entirely — turning operational data into margin protection.
The 8 Plant Problems Destroying Your Food Manufacturing Margins
- Manual CCP monitoring creates blind spots between checks — deviations go undetected for entire production runs
- Paper-based records delay corrective action by hours, not minutes
- Batch holds from undetected thermal excursions average $180K per incident
- Audit readiness requires 40+ hours of manual documentation per quarter
- Continuous real-time CCP monitoring with 1-second sensor polling — zero blind spots between manual checks
- Automated deviation alerts with root-cause triage delivered to mobile within 90 seconds of exceedance
- Auto-generated HACCP compliance documentation — audit-ready at any moment
- ROI: Plants report 78% reduction in batch holds and $340K average annual savings within 6 months
- X-ray and metal detector anomalies logged but not trended — patterns invisible until a recall occurs
- Equipment wear producing contamination risk goes undetected between scheduled PM intervals
- Average food recall cost: $10M direct, $30M brand erosion
- Regulatory fines under FSMA 204 traceability rules compounding financial exposure
- AI correlates detection system reject rates with upstream equipment vibration and wear signatures
- Predictive alerts flag equipment degradation producing contamination risk 14–21 days before failure
- Full traceability chain auto-generated from sensor data — batch-level recall scope reduced by 60–80%
- ROI: One avoided recall pays for the entire platform deployment with 20x margin
- Overfill to avoid regulatory shortfall — typically 2–4% above declared weight on every unit
- Filler drift not detected until statistical sample check hours later — entire run overfilled
- For a plant producing 50,000 units/shift at $2/unit, 3% giveaway = $3,000 lost per shift, $1.1M annually
- No real-time feedback loop between checkweigher data and filler adjustment
- Real-time checkweigher data feeds AI model that predicts filler drift 8–12 minutes before spec breach
- Automatic setpoint adjustment recommendations delivered to operator before giveaway accumulates
- Process capability (Cpk) dashboards update continuously — no more end-of-shift surprises
- ROI: Typical food plant recovers $600K–$1.4M annually in giveaway reduction within 90 days
- SKU proliferation means changeovers occurring 4–8 times per shift — each consuming 45–120 minutes
- Changeover procedures exist on paper but execution varies wildly between operators and shifts
- Sanitation verification delays extend changeover time unpredictably — no digital confirmation workflow
- A plant losing 3 hours/day to changeover inefficiency loses $2.2M+ annually at $260K/hour line rate
- AI analyzes historical changeover data to identify the fastest verified sequence for each SKU transition
- Digital guided changeover workflows enforce best-practice procedure with real-time progress tracking
- Automated sanitation verification using sensor data replaces manual sign-off delays
- ROI: Plants achieve 28–42% changeover time reduction — recovering $400K–$900K annually per line
- Calendar-based PM misses actual equipment condition — over-maintains healthy assets, under-maintains degrading ones
- Unplanned failures on fillers, sealers, and conveyors each costing $50K–$260K per event
- Average food plant OEE of 55–65% — world class is 85%+ — gap represents $2–4M in recoverable capacity annually
- Maintenance team reactive by design — no early-warning system to shift to proactive intervention
- Vibration, temperature, and current monitoring on all critical assets — AI detects degradation 14–21 days early
- Remaining Useful Life projections enable maintenance scheduling in production gaps, not crisis moments
- Auto-generated work orders with correct parts and procedures feed directly into CMMS
- ROI: 73% reduction in unplanned downtime events. $1.2–2.8M annual savings per facility
- Refrigeration, HVAC, and compressed air systems consuming 40–60% of plant energy with no optimization layer
- Energy waste invisible — utilities billed monthly but waste happening in real-time, every minute
- Compressed air leaks in food plants typically waste 25–35% of generated air — undetected for months
- No correlation between energy consumption and production output — waste versus inefficiency indistinguishable
- Real-time energy monitoring per asset and production zone — waste visible within hours of deployment
- AI correlates energy per unit of output — identifies which lines, shifts, and conditions waste most
- Compressed air leak detection via pressure-flow anomaly analysis — zero ultrasonic hardware required
- ROI: Food plants report 15–25% energy reduction — $180K–$420K annually for a mid-size facility
- Defect data collected at end-of-line but root-cause tracing back to process variables takes days or weeks
- SPC charts monitored manually — trends missed, out-of-control conditions detected after significant scrap
- Rework and scrap rates of 2–5% are treated as "normal" — not recognized as recoverable margin
- Quality team spending 70% of time on reporting, 30% on actual problem-solving — inverted ratio
- Continuous automated SPC with AI-driven control chart monitoring — out-of-control alerts in real time
- Defect root-cause correlation engine links quality outcomes to upstream process parameters automatically
- Quality team dashboard inverts the ratio — 80% problem-solving, 20% reporting
- ROI: 1% first-pass yield improvement on a $50M revenue line generates $500K+ in recovered margin annually
- 30–40% of experienced food plant technicians retiring by 2028 — taking decades of process knowledge with them
- New operators taking 6–18 months to reach full proficiency — during which defects, downtime, and waste spike
- Best practices locked in individual memory — not captured in systems that survive workforce turnover
- Night-shift performance consistently lags day-shift by 8–15% OEE — no knowledge transfer mechanism
- Generative AI assistant enables natural-language queries on asset history, fault patterns, and best-practice procedures
- AI captures and codifies process patterns from historical data — institutional knowledge becomes system knowledge
- New operator guidance powered by AI recommendations — proficiency ramp-up reduced by 40–60%
- ROI: Consistent cross-shift performance eliminates $300K–$700K annual variance from knowledge gaps
Legacy Operations vs. AI-Optimized Excellence: The Performance Gap
| Operational Area | Legacy Friction | AI-Optimized Excellence |
|---|---|---|
| HACCP Monitoring | Manual checks every 2–4 hours. Paper logs. Deviations discovered after damage done. | Continuous 1-second monitoring. Auto-alerts in 90 seconds. Audit docs generated automatically. |
| Maintenance | Calendar-based PM. Failures discovered at breakdown. Emergency repair costs 3–5× planned. | Predictive alerts 14–21 days early. RUL projections. AI-generated work orders. 73% fewer unplanned events. |
| Product Giveaway | Static overfill targets. Filler drift detected hours late. $1M+ annual giveaway treated as normal. | Real-time filler drift prediction. Setpoint recommendations before spec breach. $600K–$1.4M recovered annually. |
| Changeover | Paper procedures. Wide execution variance. Sanitation delays unpredictable. 90–120 min average. | Digital guided workflows. AI-optimized sequence. Sensor-verified sanitation. 28–42% time reduction. |
| Energy Management | Monthly utility bills. No asset-level visibility. Compressed air waste invisible for months. | Real-time energy per asset. Waste detected within hours. 15–25% energy cost reduction. |
| Quality Control | Manual SPC. Root-cause analysis takes days. Quality team 70% reporting, 30% solving. | Automated SPC. AI root-cause in minutes. Quality team 80% problem-solving. Cpk dashboards live. |
| Recall Preparedness | Broad recall scope due to poor traceability. $10M+ direct cost per event. Reactive response only. | Batch-level traceability auto-generated. Recall scope reduced 60–80%. Contamination risk caught before escape. |
| Workforce Knowledge | Institutional knowledge in individual memory. 6–18 month new-hire ramp. Night-shift OEE lags 8–15%. | AI assistant captures process knowledge. 40–60% faster onboarding. Consistent cross-shift performance. |
The Business Impact: Three Dimensions of Value
- Giveaway: $600K–$1.4M recovered
- Energy: $180K–$420K saved
- Scrap and rework: $400K–$800K reduced
- Recall scope reduced 60–80%
- HACCP batch holds down 78%
- Unplanned downtime reduced 73%
- OEE improvement: 28–42% gains
- Changeover capacity recovered: 3–5 hrs/day
- New hire ramp-up: 40–60% faster