Every day you delay automating your production line, a competitor is shipping faster, spending less per unit, and reclaiming hours that your team burns on tasks a cobot handles in seconds. The question is no longer whether industrial robotics delivers ROI — it's whether your finance team can see it clearly enough to approve the budget before the window closes. A single unplanned downtime event on a high-throughput line costs $260,000 per hour on average. A misaligned justification document costs you the approval altogether. This guide gives decision-makers the exact financial framework, comparison benchmarks, and business case architecture to get robot deployments greenlit — and paid back — inside 24 months.
iFactory Robotics AI
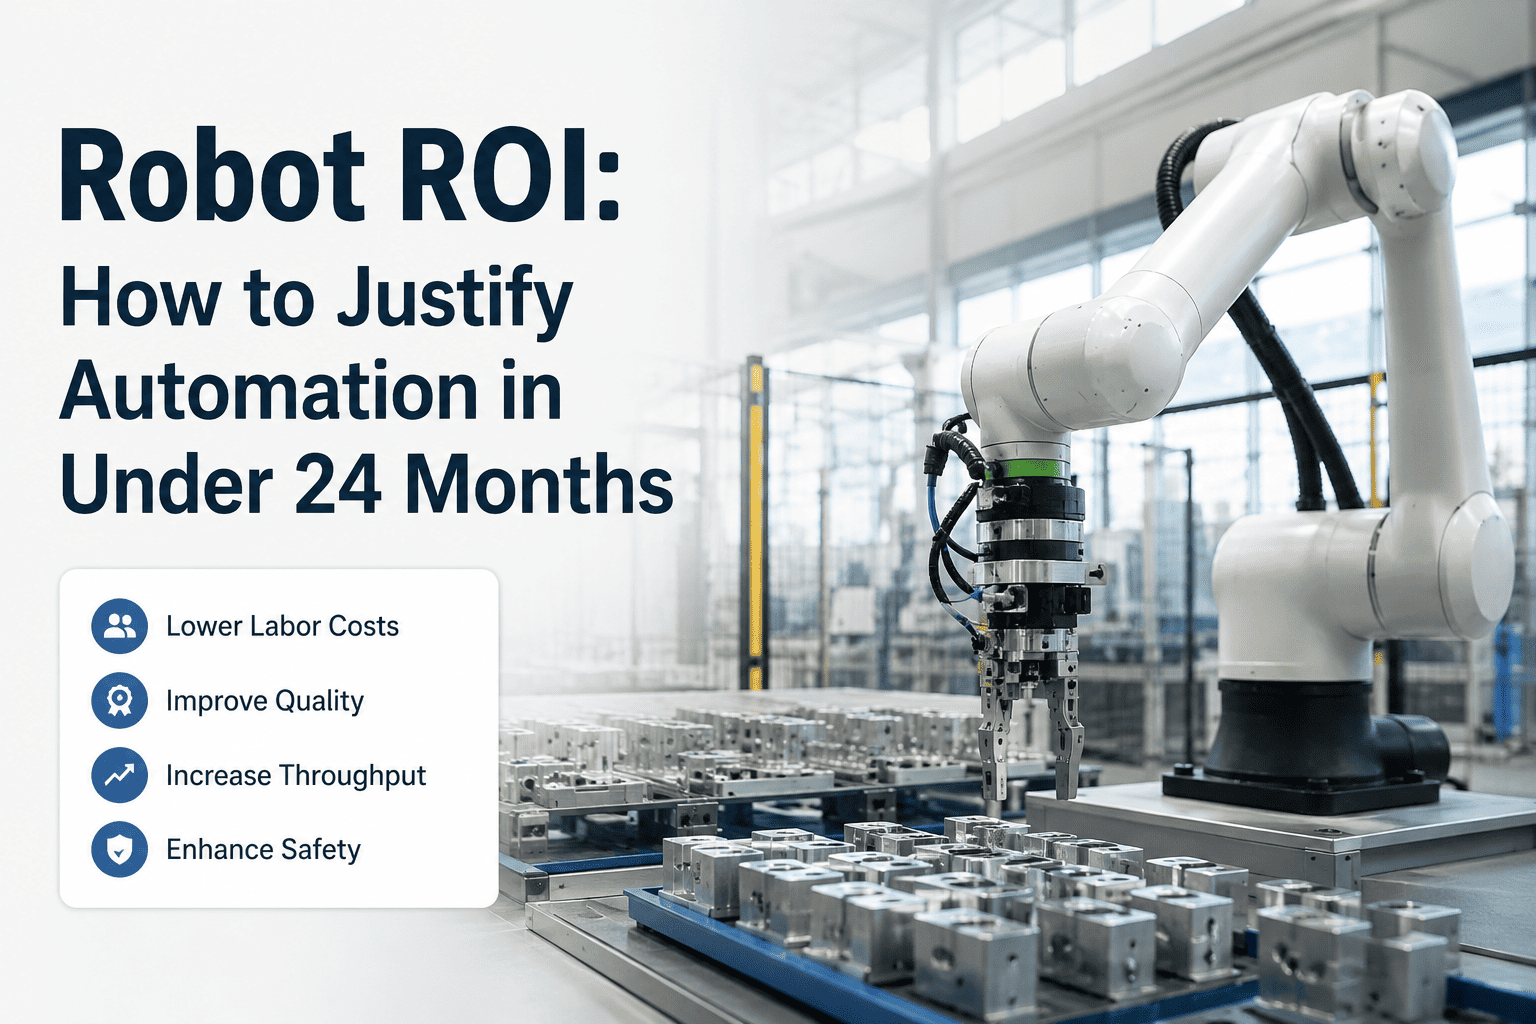
Robot ROI: How to Justify Automation in Under 24 Months
Build a robot ROI case that gets approved — labor, quality, throughput, and safety savings. Step-by-step calculator framework included.
18mo
Median robot payback period
34%
Average labor cost reduction
3.2x
Throughput increase, typical cobot deployment
62%
Drop in quality-related rework costs
Why Most Automation ROI Cases Get Rejected
Finance teams reject robot justifications not because the numbers are wrong — but because they are incomplete. Engineers submit proposals dominated by hardware specs and cycle-time gains. What executives actually need is a full-stack financial model that maps automation savings across four dimensions: labor, quality, throughput, and safety. Miss any one of these and you leave measurable value off the page — and give approvers a reason to stall.
Labor Savings
Direct headcount reallocation, overtime elimination, and shift consolidation. Cobots work 24/7 without benefits, absences, or turnover costs averaging $4,700 per replacement hire.
Quality Gains
Robotic precision cuts defect rates by 40–70%. Reduced scrap, rework, and warranty claims translate directly into margin recovery that finance teams can validate against existing quality data.
Throughput Uplift
Consistent cycle times at rated capacity unlock revenue that manual lines cannot reliably produce. Quantify the value of each additional unit shipped against your selling price.
Safety Savings
Removing workers from high-risk tasks cuts incident rates. Average workplace injury costs $41,000 per event in direct costs alone. Insurance premiums and compliance follow.
See how iFactory Robotics AI builds your live ROI model in days, not months.
Book a Demo
The Robot ROI Calculator: A Five-Step Framework
01
Baseline Current State Cost
Document total annual cost of the process: fully-loaded labor, scrap and rework, downtime incidents, and safety events. This is the number automation must beat.
02
Define Total Automation Investment
Robot hardware, tooling, safety enclosures, integration, licensing, and commissioning. Integration typically runs 30–50% of hardware cost.
03
Model Labor Reallocation Value
Calculate headcount freed, overtime eliminated, and shift consolidation. Include turnover avoidance for high-churn roles.
04
Quantify Quality and Throughput Delta
Model defect rate reduction against current scrap cost. Add throughput uplift: (new cycle time − old cycle time) × units per year × selling price.
05
Calculate Simple Payback and NPV
Payback Period = Total Investment ÷ Annual Net Savings. Sub-24-month payback with positive NPV at Year 3 clears most approval thresholds.
Legacy vs. Automated: The Performance Gap
| Dimension |
Legacy Manual Process |
iFactory Robotics AI |
| Labor Cost per Unit |
High — variable |
Fixed and predictable |
| Defect Rate |
2–6% average |
0.1–0.5% precision |
| Consistency |
Varies by shift/fatigue |
99%+ uptime maintained |
| Scalability |
Proportional headcount |
Add cells, not headcount |
| Safety Incident |
High exposure daily |
Hazardous tasks isolated |
| Data Traceability |
Manual — audit gaps |
Every cycle logged |
| Maintenance |
Reactive failures |
Predictive AI flags |
| ROI Visibility |
No granular attribution |
Live ROI dashboard |
Three High-Impact Deployment Scenarios
Scenario A
High-Volume Assembly
Investment $180K
Labor Saving $168K/yr
Payback 8.4 months
Scenario B
Welding Automation
Investment $420K
Throughput $380K/yr
Payback 14.2 months
Scenario C
Palletising & End-of-Line
Investment $290K
Safety $55K/yr
Payback 16.8 months
Operational Intelligence
- Live OEE tracking
- Cycle deviation alerts
- ERP/MES integration
Predictive Maintenance
- AI motor monitoring
- 21-day failure warning
- 73% downtime reduction
ROI Visibility
- Live savings dashboard
- CFO-ready reports
- Per-cell tracking
Start Justifying. Start Deploying.
Your Robot ROI Case — Validated in One Session
Our engineering team will model your specific opportunity and deliver a CFO-ready business case. No guesswork. Real numbers.