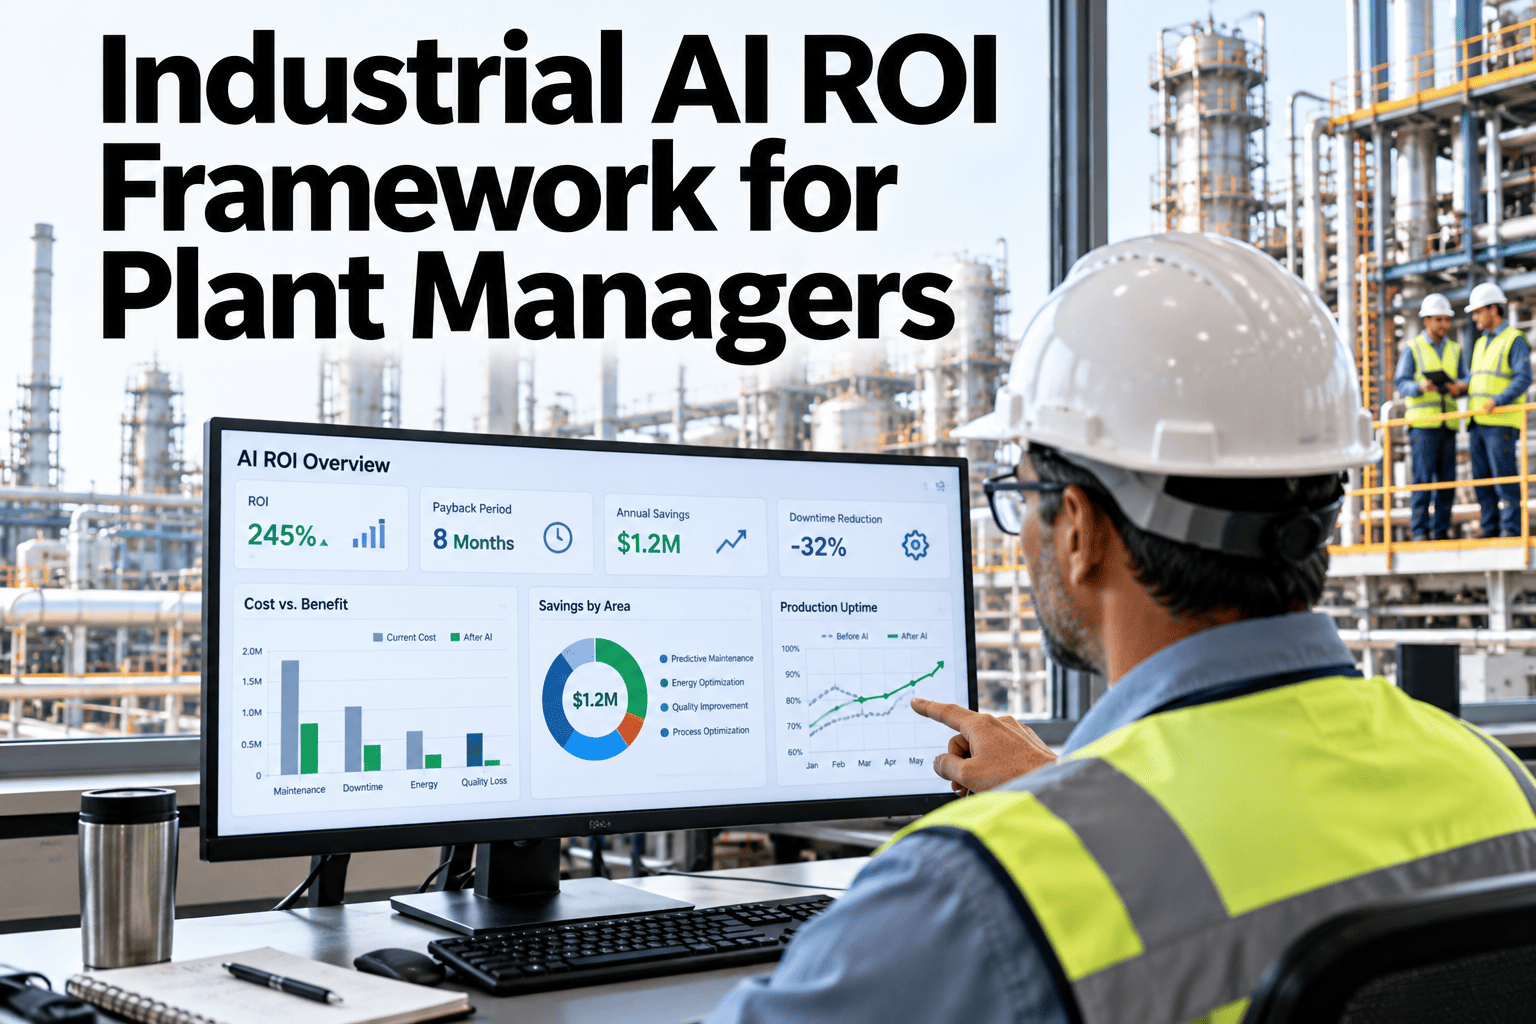
Most AI investment cases fail at the plant manager level not because the technology is unproven, but because the ROI argument is not structured in the language plant managers use to justify capital: avoided downtime cost, energy cost reduction, quality loss prevention, and maintenance spend shift from reactive to planned. A framework that connects AI capabilities to those four outputs — with baselines defined, calculations documented, and evidence sources identified — is the difference between a budget request that survives the review cycle and one that does not. iFactory AI provides both the operational data and the deployment model that makes each calculation specific to your plant. Walk through the ROI framework for your plant in a live session.
Industrial AI ROI Framework for Plant Managers
Four value streams, documented calculation methods, and the evidence sources that make each claim defensible — structured as a inspection plant managers can use in any capital review.
Step 1 — Define Your Baseline Before Anything Else
The baseline is the most important number in any ROI framework and the one most frequently left undefined. Without a frozen, documented baseline, every improvement claim is contestable.
Stream 1 — Avoided Downtime Value
Downtime is the highest-value stream for most plants because the cost of a production hour is large and the improvement from AI is measurable within months.
Stream 2 — Energy Cost Reduction
Energy is usually the second-largest value stream, particularly in energy-intensive processes like cement, steel, chemical, and food manufacturing where AI-driven optimization targets fuel and electrical consumption.
Stream 3 — Quality Loss Prevention
Quality improvement value is often underestimated because it has two components: the direct cost of scrap and rework, and the avoided cost of customer claims and delivery penalties.
Stream 4 — Maintenance Spend Shift
The maintenance value stream is the most complex to calculate because planned maintenance spend may increase as PdM directs more scheduled interventions. The net gain is the reduction in emergency spend — labor premiums, expedited parts, and collateral equipment damage.
Build the ROI Case for Your Plant
iFactory AI provides the operational data that populates every stream of the ROI framework — from downtime hours to energy consumption to quality records. Book a session to run the calculation on your plant's actual numbers.
Assembling the 3-Year Business Case
Stack all four streams against the platform cost across a three-year horizon to produce payback period and net present value — the two numbers that survive capital committee review.
| Component | Year 1 | Year 2 | Year 3 | Note |
|---|---|---|---|---|
| Platform cost | Highest — initial capex + year 1 fee | Annual fee only | Annual fee only | Obtain from iFactory AI scoping |
| Avoided downtime | 30% reduction | 45% reduction | 55% reduction | Model improves with failure history |
| Energy savings | 4% reduction | 6% reduction | 7% reduction | Optimization models mature over time |
| Quality improvement | 20% scrap reduction | 30% scrap reduction | 35% scrap reduction | Process deviation detection matures |
| Maintenance shift | Emergency cost reduced | Further reduction | Sustained | Planned ratio improves year over year |
| Net value (all streams minus cost) | Near breakeven or positive | Strongly positive | Strongly positive | Payback typically 12–18 months |
Frequently Asked Questions
Which value stream should plant managers lead with in a capital review?
Lead with avoided downtime — it is the largest stream for most plants, the most directly measurable, and the most immediately credible to a capital committee. Energy savings and quality improvement strengthen the case but rarely carry it alone. Walk through the case structure for your plant in a session.
How do we handle ROI claims when downtime varies significantly year to year?
Use a rolling 3-year average as the baseline rather than a single year, and apply a sensitivity range — showing the ROI at both the low and high end of the historical downtime range. A robust case that holds at the low end is more credible than a case that only works at the worst year's downtime level. Ask support about baseline methodology for variable downtime environments.
What if the plant has never measured downtime hours accurately?
Start the iFactory AI deployment in measurement mode first — four to eight weeks of accurate downtime data from real equipment signals establishes a reliable baseline even when no historical records exist. This also immediately reveals where the losses are, making the improvement case concrete before capital approval is finalized.
How conservative should the improvement assumptions be in the business case?
Use the lower half of the documented range for Year 1 — 30% downtime reduction rather than 50%, 4% energy reduction rather than 8%. A conservative case that is beaten builds credibility and secures the next phase. An aggressive case that underdelivers creates resistance to future investment regardless of actual performance.
Does iFactory AI provide the data needed to populate the ROI framework after deployment?
Yes. iFactory AI tracks downtime hours, equipment health events, energy consumption trends, and model performance continuously, providing the post-deployment evidence that validates each benefit stream at each review cycle. The framework becomes a living document rather than a one-time capital request. See how iFactory AI's reporting supports ongoing ROI tracking.
Build an AI Investment Case That Survives Capital Review
iFactory AI's four-stream ROI framework gives plant managers the structure, calculations, and evidence sources needed to justify AI investment with confidence. Book a session to start the model on your plant's numbers.