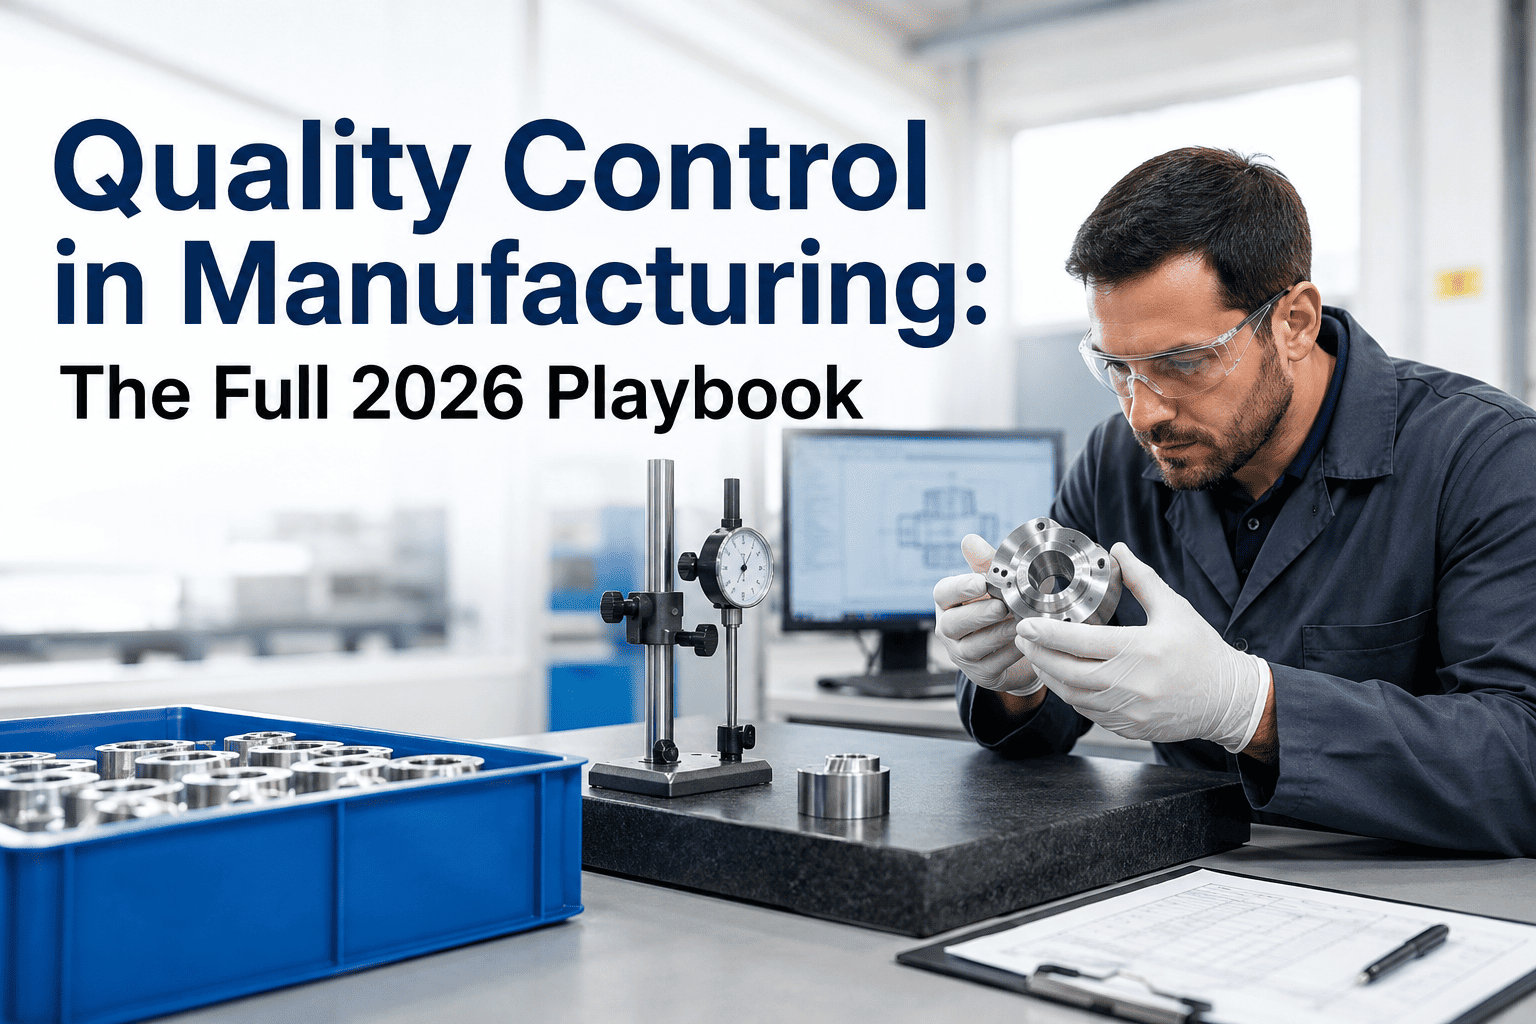
Every hour a defective batch slips through your quality line, every unplanned shutdown that halts production, every demand forecast that leaves you holding excess inventory — these are not random misfortunes. They are the compounding tax of manufacturing operations still running on human intuition and reactive decision-making. Manufacturers using machine learning are eliminating that tax. Those who are not are funding the growth of those who are.
iFactory AI Analytics Platform
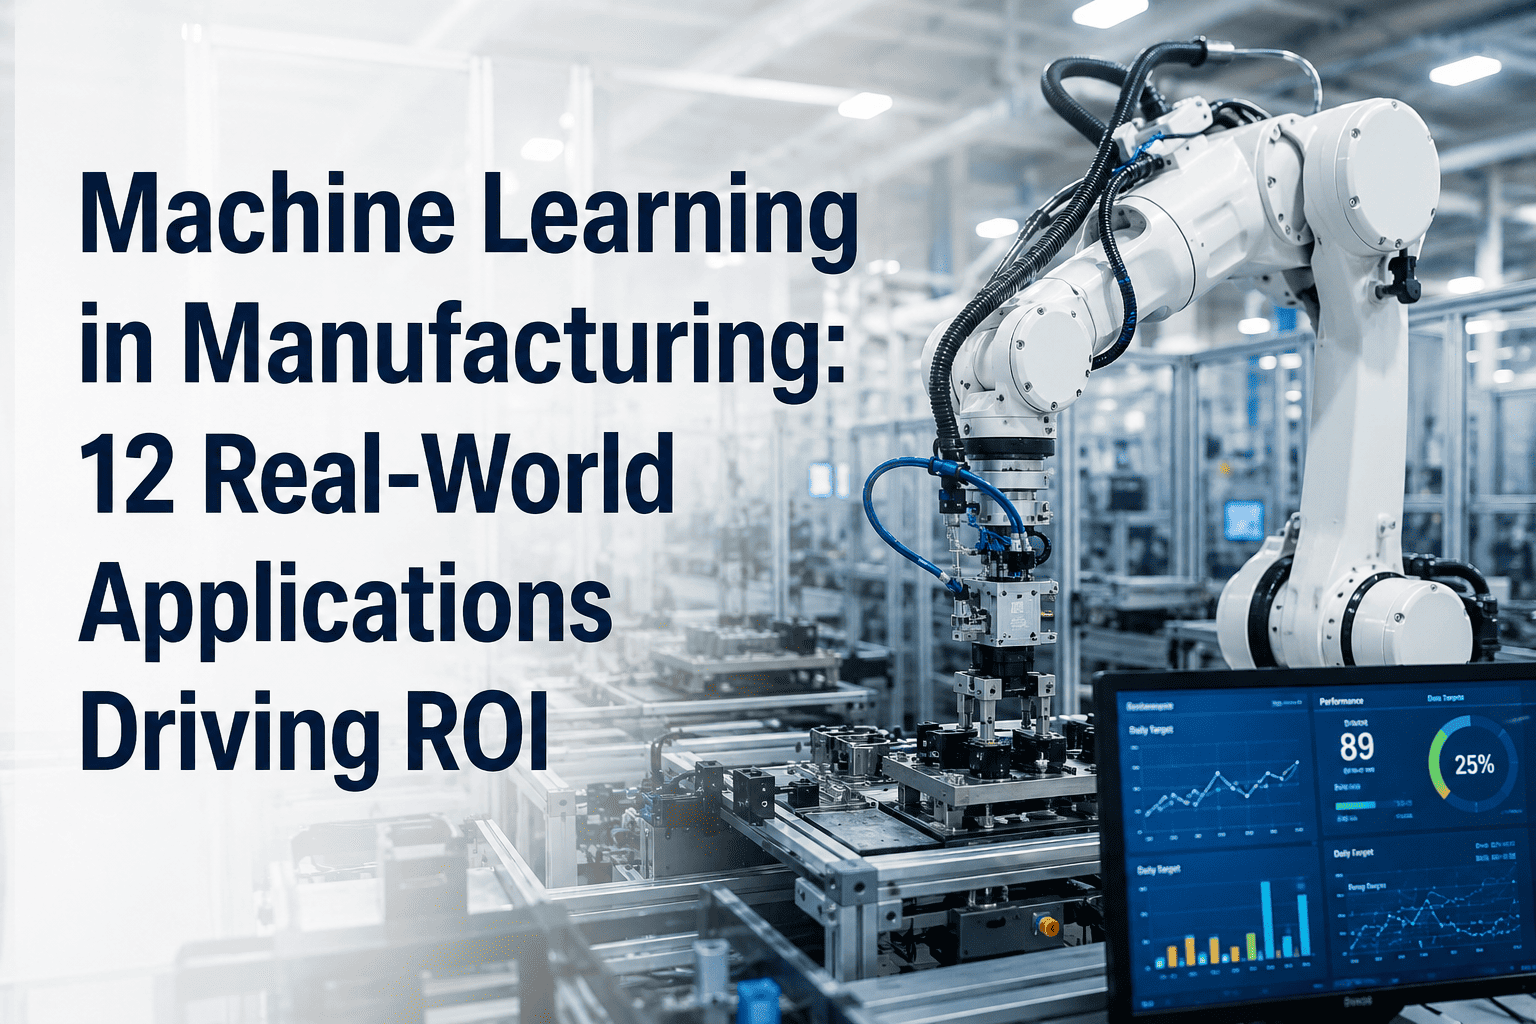
Machine Learning in Manufacturing: 12 Real-World Applications Driving ROI
From defect detection to demand forecasting — how AI and ML are transforming factory floors into precision-optimized operations, with validated ROI data at every stage
35%
Reduction in unplanned downtime with ML maintenance
$2.8M
Average annual savings per facility adopting ML analytics
92%
Defect detection accuracy using deep learning vision
18mo
Typical full ROI payback for ML deployment
Why Machine Learning Is No Longer Optional for Manufacturers
The global manufacturing sector loses an estimated $50 billion annually to unplanned downtime alone. Add quality escapes, demand mismatches, and energy inefficiency, and the true cost of operating without machine learning climbs far higher. ML in manufacturing is not a future capability — it is an operational necessity for any facility that intends to compete at scale through 2030 and beyond.
The following 12 applications represent the highest-ROI entry points for machine learning in manufacturing environments, ranked by implementation maturity and financial impact. Each is operational today, deployable within months, and validated across real industrial environments.
The 12 ML Applications Transforming Manufacturing Operations
01
Predictive Maintenance
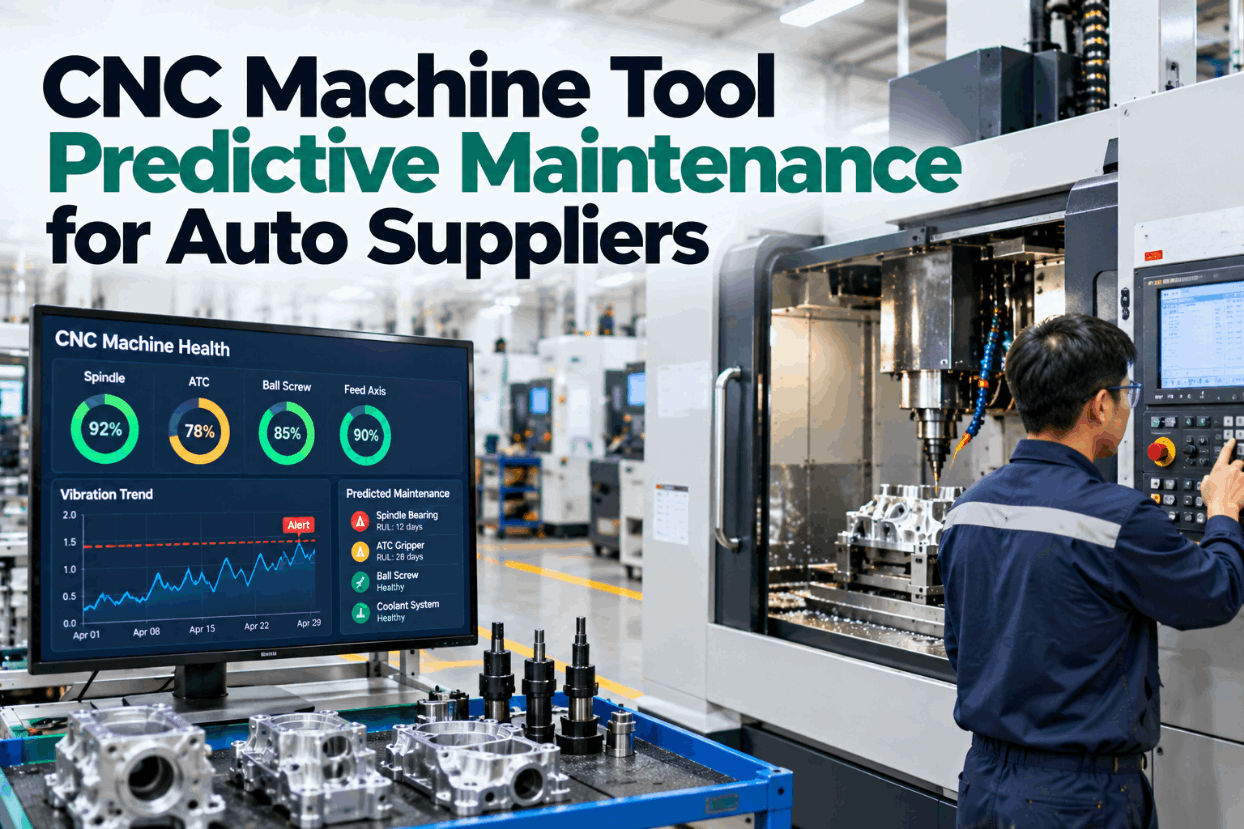
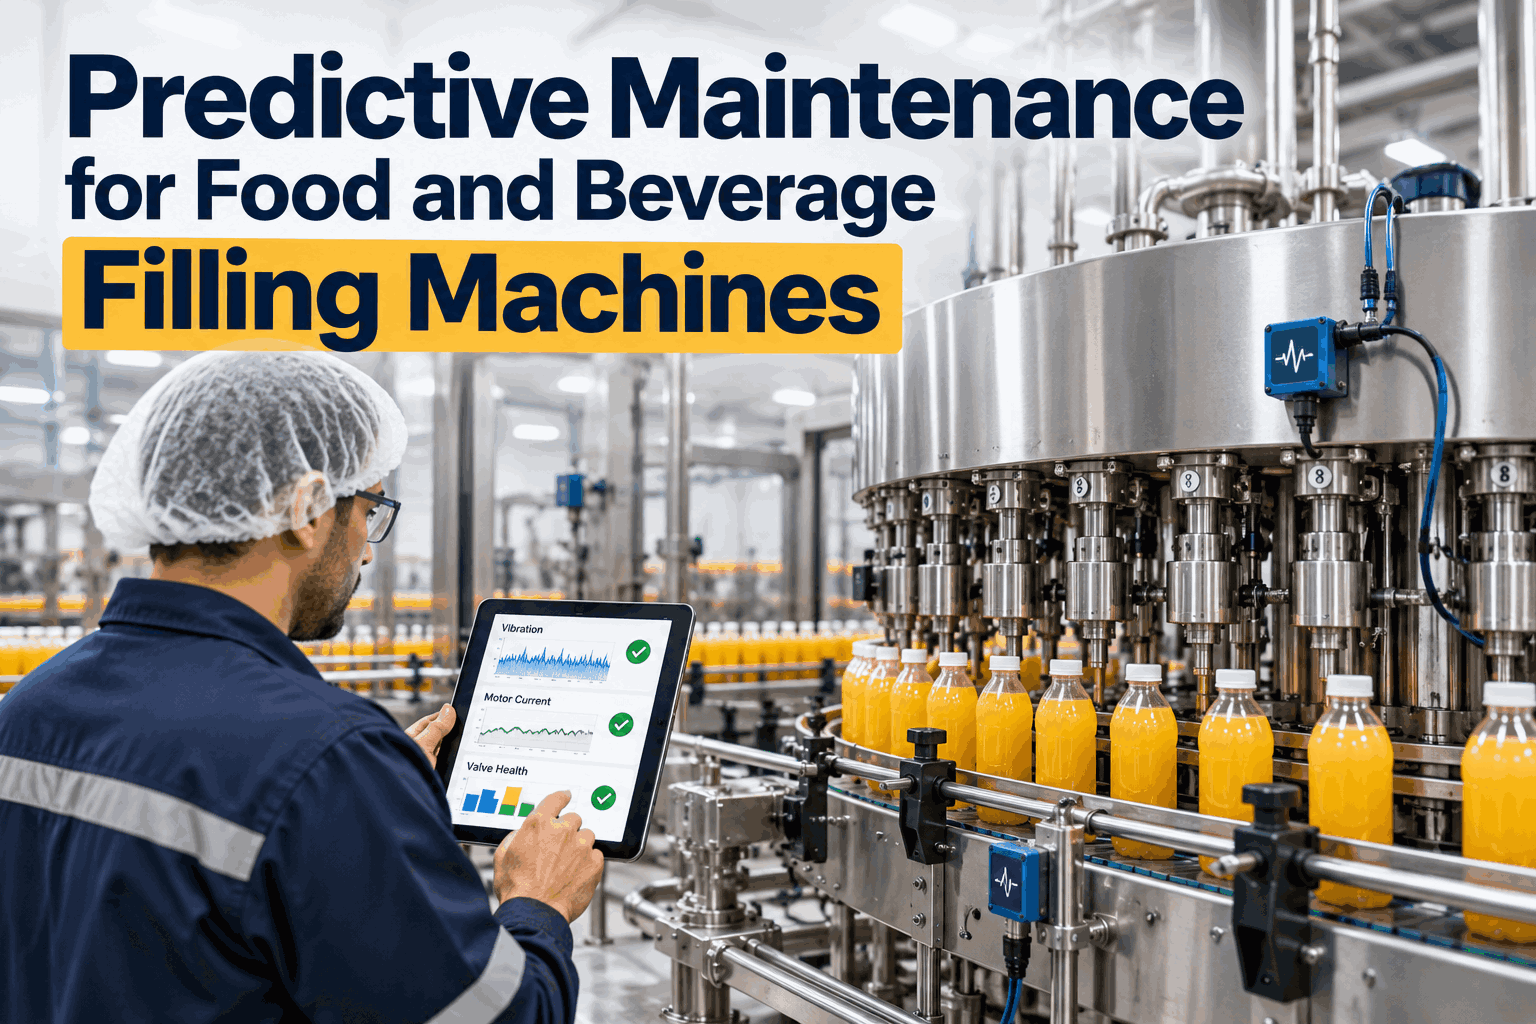
LSTM neural networks and gradient boosting models analyze vibration, temperature, and current signatures to predict equipment failures 14–21 days before they occur. Maintenance shifts from calendar-based to condition-based, eliminating both unplanned shutdowns and unnecessary service events.
ROI Impact: 25–45% reduction in maintenance costs. First avoided failure typically exceeds implementation cost.
02
Computer Vision Quality Control
Convolutional neural networks (CNNs) inspect 100% of production output at line speed, detecting surface defects, dimensional deviations, and assembly errors with 92–98% accuracy — far exceeding human inspection rates. False positive rates are tuned per production tolerance.
ROI Impact: 60–80% reduction in quality escapes. Elimination of sampling-based inspection gaps.
03
Demand Forecasting
Ensemble ML models combining time-series analysis, external market signals, and historical sales data produce demand forecasts accurate to within 4–8% at SKU level. Procurement, production scheduling, and inventory positioning are all downstream beneficiaries of accurate ML forecasting.
ROI Impact: 15–30% reduction in inventory carrying costs. Up to 20% improvement in service levels.
04
Process Parameter Optimization
Reinforcement learning agents continuously test and adjust process parameters — temperature, pressure, speed, feed rate — to maximize yield while minimizing energy consumption and scrap. The ML model learns the production function far more precisely than any engineering model can encode it.
ROI Impact: 3–8% yield improvement. 10–18% energy reduction in optimized processes.
05
Anomaly Detection in Production Data
Unsupervised ML models — isolation forests, autoencoders — learn normal operational signatures and flag deviations in real time across thousands of sensor channels simultaneously. Anomalies that would take human operators days to identify are surfaced in seconds with root cause attribution.
ROI Impact: 70% faster fault identification. Cascading failure prevention worth $400K–$1.2M per avoided incident.
06
Supply Chain Risk Intelligence
ML models ingest supplier performance data, geopolitical signals, logistics disruption patterns, and financial health indicators to score supply chain risk across the full vendor portfolio. Procurement teams receive early warning of disruptions 30–60 days before they materialize.
ROI Impact: 40% reduction in supply disruption events. Significant reduction in emergency sourcing premiums.
07
Energy Consumption Optimization
ML models map energy consumption against production output, time-of-use tariffs, and equipment condition to identify waste and shift load intelligently. Predictive algorithms anticipate peak demand and adjust scheduling to minimize utility costs without impacting throughput.
ROI Impact: 12–22% reduction in energy spend. Measurable ESG improvement for sustainability reporting.
08
Production Scheduling Optimization
ML-driven scheduling engines balance machine availability, material readiness, workforce capacity, and customer priority simultaneously — producing optimized production sequences that human planners cannot compute at scale. Schedule adherence improves while makespan and changeover time decrease.
ROI Impact: 8–15% improvement in OEE. 20–35% reduction in changeover-driven idle time.
09
Remaining Useful Life (RUL) Prediction
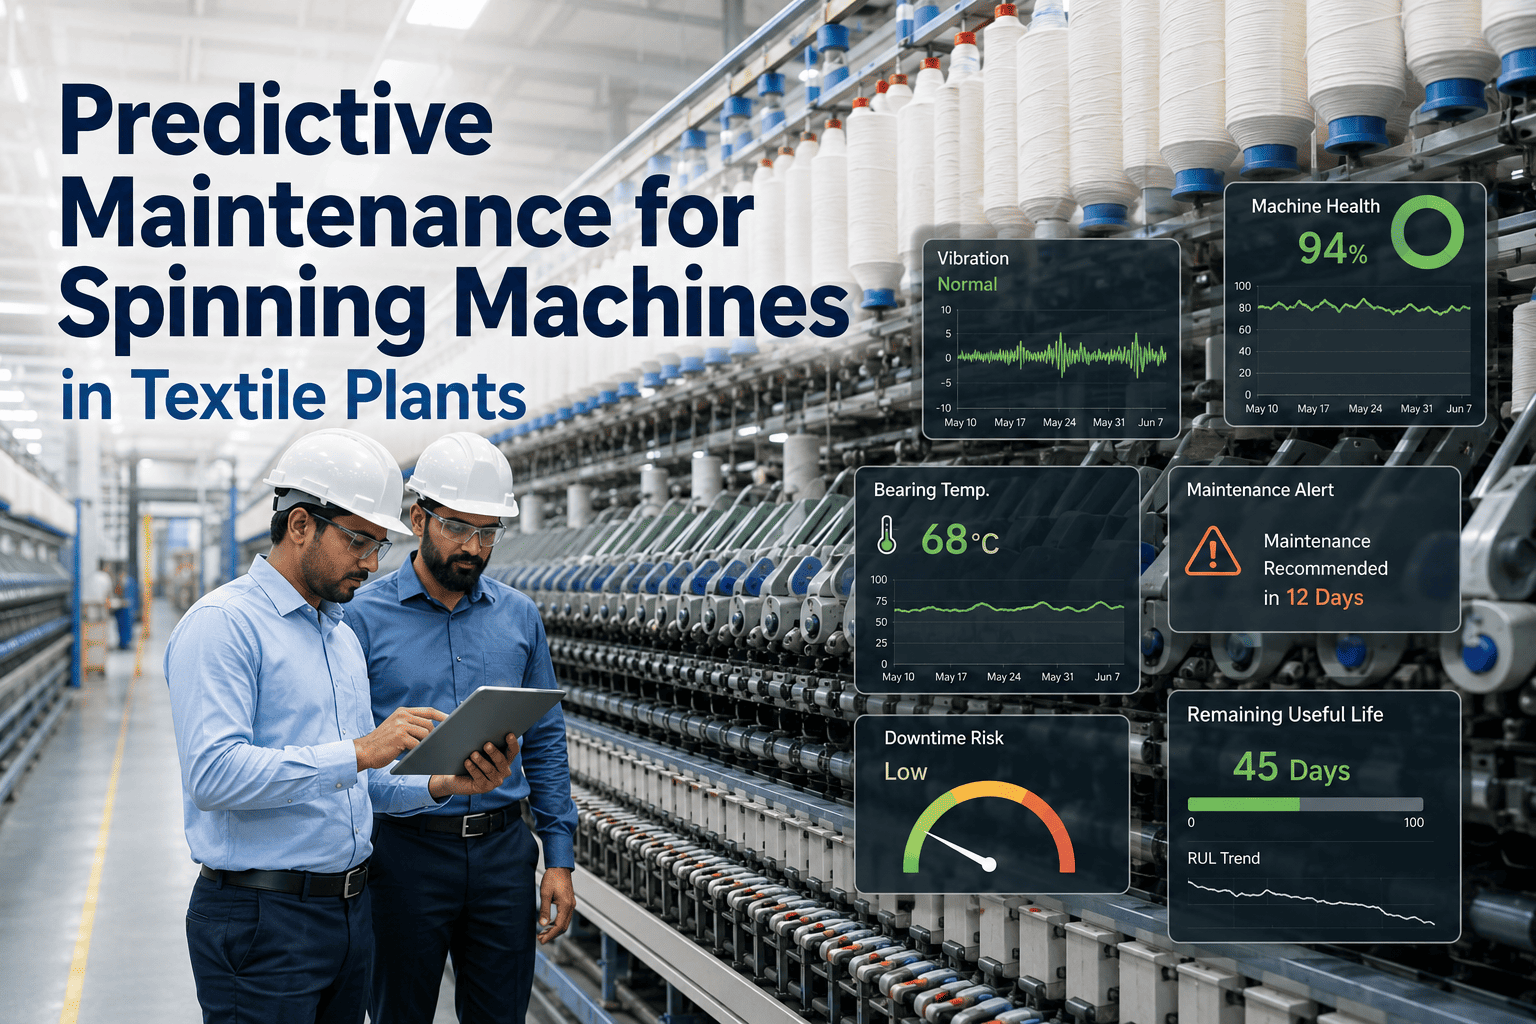
Physics-informed ML models combine sensor data with degradation curves to calculate continuously updating RUL estimates for every critical asset. Maintenance windows are scheduled precisely when needed — not before, not after — eliminating both premature replacement and run-to-failure events.
ROI Impact: 30–50% extension in average asset service life. Capital deferral worth millions at enterprise scale.
10
Root Cause Analysis Automation
Causal ML models trace quality defects, process excursions, and equipment faults back to contributing variables across thousands of data points — work that previously required days of engineer time. Root cause identification that took 72 hours is compressed to under 4 hours with ML attribution.
ROI Impact: 85% reduction in root cause investigation time. Faster corrective action, fewer repeat events.
11
Workforce Safety and Ergonomics
Computer vision models monitor workstation ergonomics, PPE compliance, and unsafe proximity to hazardous equipment in real time — without recording or storing personal identifiable video. Safety incidents are flagged before they become injuries, and compliance documentation is auto-generated.
ROI Impact: 40–60% reduction in recordable safety incidents. Significant reduction in workers' compensation liability.
12
Warranty and Field Failure Prediction
ML models correlate production process signatures with field failure and warranty claim data to identify manufacturing conditions that predict downstream reliability issues. Quality problems are caught at the production stage — before they become warranty costs, recalls, or reputation damage.
ROI Impact: 25–40% reduction in warranty claims. Significant product liability risk reduction.
Legacy Operations vs. ML-Optimized Manufacturing: The Performance Gap
The gap between ML-enabled and legacy manufacturing operations is widening every quarter. The comparison below translates operational differences into financial terms that matter to executive leadership.
| Operational Dimension |
Legacy Friction |
ML-Optimized Excellence |
| Maintenance Strategy |
Calendar-based scheduling. Failures missed between service windows. Emergency repairs cost 3–5x planned maintenance. |
Condition-based, ML-predicted. Every maintenance event is precisely timed. Emergency repair budget approaches zero. |
| Quality Inspection |
Sampling inspection. Defects escape into shipments. Recalls and warranty costs absorb 2–4% of revenue. |
100% AI vision inspection at line speed. Defect rate measured in parts per million. Warranty exposure drops 30–40%. |
| Demand Planning |
Spreadsheet forecasts with ±25% error. Excess inventory or stockouts are the perpetual outcome of human forecasting limits. |
ML ensemble models with ±5% accuracy. Inventory carrying costs cut 20%. Fill rates climb above 98%. |
| Energy Management |
Flat consumption regardless of production volume or tariff rates. Energy spend treated as a fixed cost. |
Dynamic load scheduling. Consumption optimized against real-time tariffs. Energy treated as a controllable variable. |
| Root Cause Analysis |
72–96 hours of engineering investigation per incident. Same root causes repeat because investigation depth is limited. |
Causal ML identifies root cause in under 4 hours across thousands of variables. Repeat incidents drop 70%. |
| Production Scheduling |
Planner-dependent scheduling with limited visibility into constraint interactions. Schedule adherence below 80%. |
ML-optimized sequencing across all constraints simultaneously. Schedule adherence above 95%. OEE improves 10–15%. |
| Safety Monitoring |
Periodic audits. Reactive incident reporting. OSHA recordables absorbed as cost of doing business. |
Real-time CV monitoring. Proactive risk intervention. Recordable incidents reduced 50%+. Liability exposure minimized. |
How ML Transforms Three Core Manufacturing Outcomes
Workflow Intelligence
ML eliminates decision latency at every operational layer. Maintenance decisions that required engineer analysis now execute automatically. Quality decisions that required supervisor review happen at machine speed. Production scheduling that required planner expertise runs continuously without human input. The workflow accelerates because intelligence is embedded in the process, not layered on top of it.
Operational Decision Speed: 10x to 100x faster
Overhead Reduction
ML-driven automation removes cost from every category that scales with human effort — inspection labor, maintenance planning, scheduling coordination, compliance documentation, and report generation. As ML models mature, marginal cost per unit of production decreases while output capacity expands. The overhead structure that was fixed becomes variable and shrinking.
Typical Overhead Reduction: 18–32% within 24 months
Output and Growth Capacity
ML unlocks throughput that was previously limited by human decision capacity. Quality ML allows faster line speeds without sacrificing defect rates. Predictive maintenance allows higher asset utilization without increased failure risk. Optimized scheduling extracts more output from the same physical capacity. Growth occurs without proportional capital investment because ML makes existing assets more productive.
OEE Improvement: 12–22% without capital expenditure
Implementation Approach: Starting With the Highest-ROI Applications
The most common ML implementation mistake in manufacturing is attempting to deploy all twelve applications simultaneously. The organizations producing the strongest results follow a deliberate sequencing logic: start with the application that produces the fastest measurable ROI on the most critical assets, use those savings to fund expansion, and scale to full coverage within 12–18 months.
Step 1
Select Your Highest-Value Entry Point
For most manufacturers, predictive maintenance on critical rotating equipment (motors, pumps, compressors) delivers the fastest ROI because the cost of a single avoided failure is measurable and often exceeds the full implementation cost. Begin with 10–20 assets. Instrument, connect, and prove value before expanding scope.
Step 2
Define Financial KPIs Before Deployment
Identify 3–5 metrics that translate directly to dollars: cost per downtime hour, defect-related rework spend, energy cost per unit of output, inventory carrying cost as a percentage of revenue. Establish baseline values. Report ML-driven improvement in these terms monthly to maintain executive confidence and budget continuity.
Step 3
Expand Based on Demonstrated Savings
Each phase of ML deployment should fund the next through documented savings. Predictive maintenance ROI funds quality ML deployment. Quality ML savings fund demand forecasting and energy optimization. This self-funding expansion model eliminates dependence on annual budget cycles and sustains momentum throughout the deployment journey.
iFactory AI Analytics Platform
Request a Performance Audit for Your Facility
Our manufacturing ML engineers will analyze your current operations, identify your highest-ROI entry points, and deliver a phased deployment roadmap with projected savings — at no cost and no obligation.
12
ML applications proven in live manufacturing environments
$2.8M
Average annual savings per facility
4–6wk
Time to first measurable ML-driven result
10–30x
Validated return on ML investment