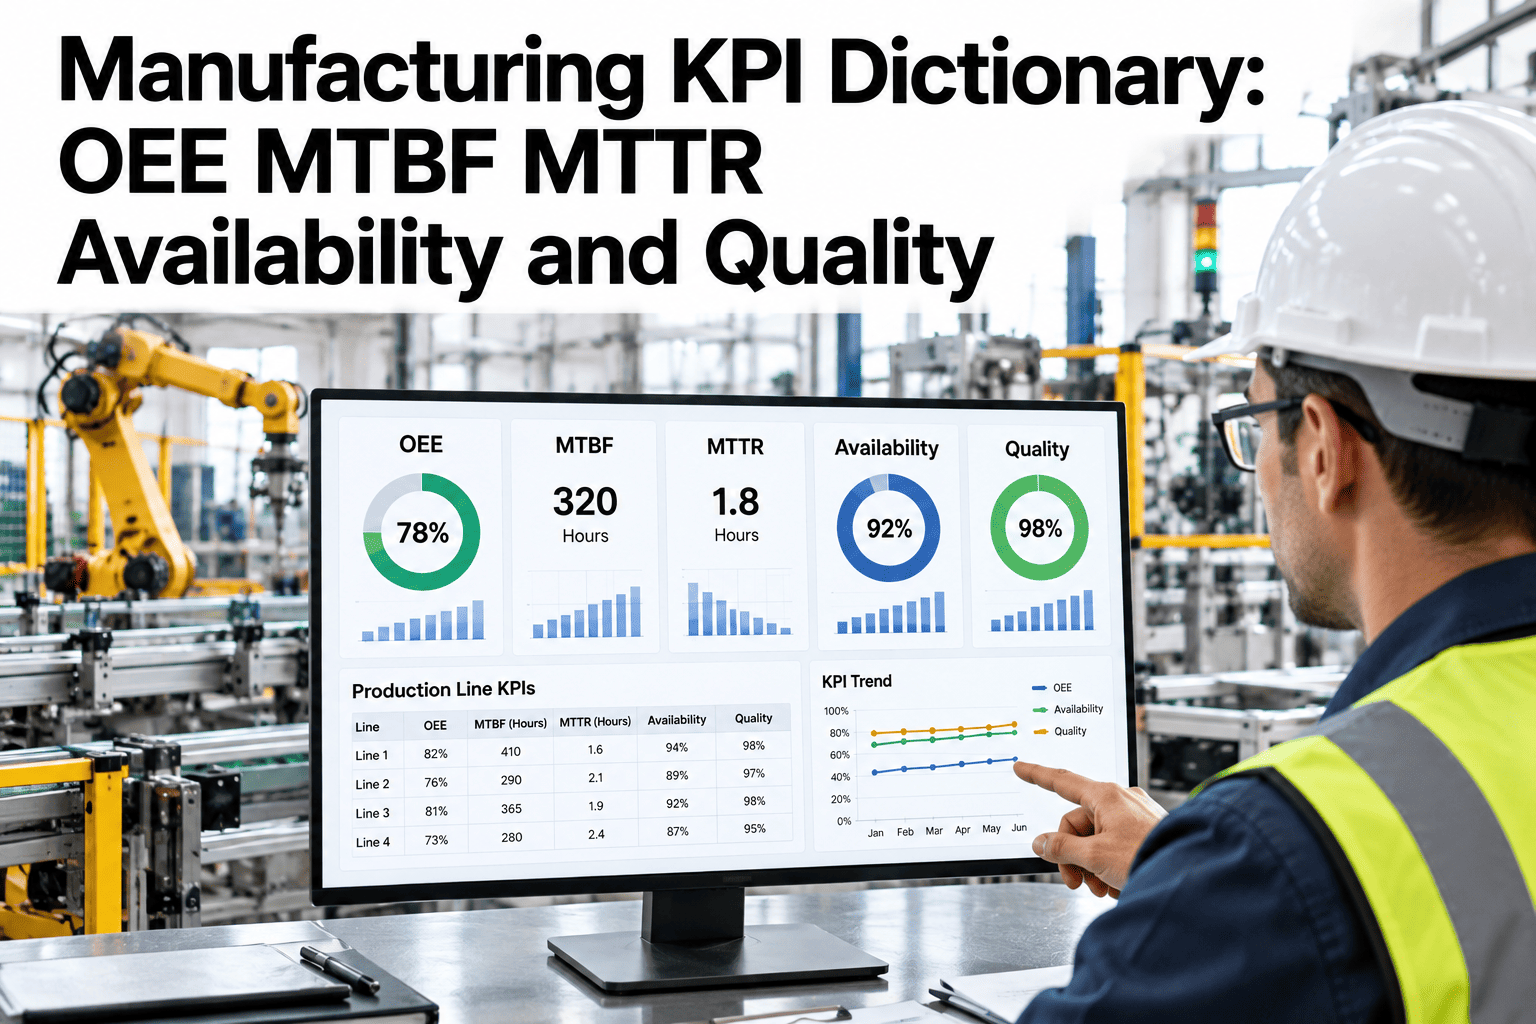
Walk into three plants and ask for their OEE and you may get three different numbers for the same machine. The gap is rarely effort. It comes from definitions, such as what counts as planned time, which stops are excluded and how good output is counted. A shared KPI dictionary removes that argument by writing each measure down once, with its formula and its limits. Teams who want their KPIs calculated consistently can ask iFactory AI how its manufacturing KPIs are defined and calculated.
The Manufacturing KPI Dictionary: One Definition for Every Number
OEE, MTBF, MTTR, availability and quality, defined once and calculated the same way everywhere. iFactory AI keeps every plant and shift on the same page.
How the Core KPIs Connect
OEE is built from three smaller measures, and those three connect to the maintenance KPIs behind them. Seeing the chain explains where each number comes from.
The Dictionary: Terms, Formulas and Meanings
Use this table as the reference sheet for your plant. Formulas are standard, and your own rules decide what counts as planned time or a good unit.
| KPI | Formula | Plain Meaning |
|---|---|---|
| Availability | Run time divided by planned production time | How often the machine was running when it should have been |
| Performance | Ideal cycle time times total count, divided by run time | How fast it ran compared with its ideal speed |
| Quality | Good count divided by total count | How many units were right |
| OEE | Availability x Performance x Quality | Share of planned time that produced good parts at ideal speed |
| MTBF | Operating time divided by number of failures | How long a machine typically runs between failures |
| MTTR | Total repair time divided by number of repairs | How long a typical repair takes |
| First pass yield | Units right first time divided by units started | How much output needs no repeat work |
| Scrap rate | Scrapped units divided by total units | How much output is lost completely |
A Worked OEE Example
Numbers make the formulas real. Follow one machine through a single shift.
Worked Maintenance Example: MTBF, MTTR and Availability
Maintenance KPIs tell the story behind lost availability. Here is a simple example over one period.
Operating time
A machine runs for 300 hours in the period.
Failures and repair
It fails 3 times, and total repair time is 6 hours.
MTBF and MTTR
MTBF is 100 hours (300 divided by 3), and MTTR is 2 hours (6 divided by 3).
Inherent availability
MTBF divided by MTBF plus MTTR gives about 98 percent.
Get Every Plant Calculating KPIs the Same Way
Book a 30-minute session and iFactory AI will review your KPI definitions and show how consistent calculation changes your reports.
Which KPI Answers Which Question
Different questions need different KPIs. Choosing the right one avoids drowning in dashboards.
| Your Question | Best KPI | Look Next At |
|---|---|---|
| Are we using planned time well? | Availability | Downtime reasons and changeovers |
| Are we running at the right speed? | Performance | Slow cycles and micro-stops |
| Are we making good parts? | Quality and first pass yield | Scrap and rework causes |
| How reliable is this machine? | MTBF | Failure modes and maintenance plan |
| How quickly do we recover? | MTTR | Spare parts and repair procedures |
Common KPI Mistakes
Most KPI problems come from habits, not formulas. Avoiding these keeps your numbers trusted.
Different definitions in different plants
Comparisons become meaningless and arguments replace action.
Counting planned stops as downtime
Availability looks worse than it is and hides real losses.
Using the wrong ideal cycle time
Performance looks high or low for the wrong reasons.
Reporting averages only
Averages hide the machines and shifts that need help.
Chasing the number
Teams game a KPI when its definition is loose.
KPI Hygiene Checklist
Run this list before any KPI goes on a screen or in a review. Each box protects the trust in the number.
A Composite Scenario: Two Plants, Two OEEs
This is a composite example, not a named company. It shows how definitions, not performance, explained a gap.
What iFactory AI Adds to KPI Management
iFactory AI is smart manufacturing and industrial software that calculates KPIs from live production data. Explore the KPI dashboards in a live product tour on realistic data.
A 30-Day Plan to Roll Out the Dictionary
A month is enough to agree definitions and start trusting your numbers. This is a realistic path.
Review of Manufacturing KPI Practice
A practical review of what keeps KPIs trustworthy, written as editorial guidance rather than a named expert quote.
Write the definition down
A KPI without a written formula is an opinion with a number attached.
Show the drivers
OEE alone says little, but availability, performance and quality explain it.
Compare like with like
Plants and shifts can only be compared when they use the same rules.
Frequently Asked Questions
How is OEE calculated?
OEE equals availability multiplied by performance multiplied by quality. A machine with 87.5% availability, 85.7% performance and 95% quality has an OEE of about 71%. See OEE calculated live from machine data in a short demo. Always show the three drivers beside the total.
What is the difference between MTBF and MTTR?
MTBF is the average operating time between failures, a measure of reliability. MTTR is the average time to repair a failure, a measure of recovery speed. Together they explain much of the availability a machine delivers.
Why do two plants report different OEE for the same product?
Usually because they define planned time, exclusions or good counts differently. Ask support how definitions are standardised across plants in practice. A shared dictionary removes most of the gap.
Is a high OEE always good?
Not if the definition is loose or the ideal cycle time is set too slowly. A high number built on soft rules hides losses. Check the definition before celebrating the figure.
How quickly can we standardise our KPIs?
Many teams agree and apply a shared dictionary within a month on one line. Book time to scope a KPI standardisation project with your plants. Starting with one line keeps the change manageable.
Put Every Plant on the Same KPI Page
iFactory AI calculates OEE, MTBF, MTTR, availability and quality from live production data, using one shared dictionary. Book a walkthrough to see it on your own machines.