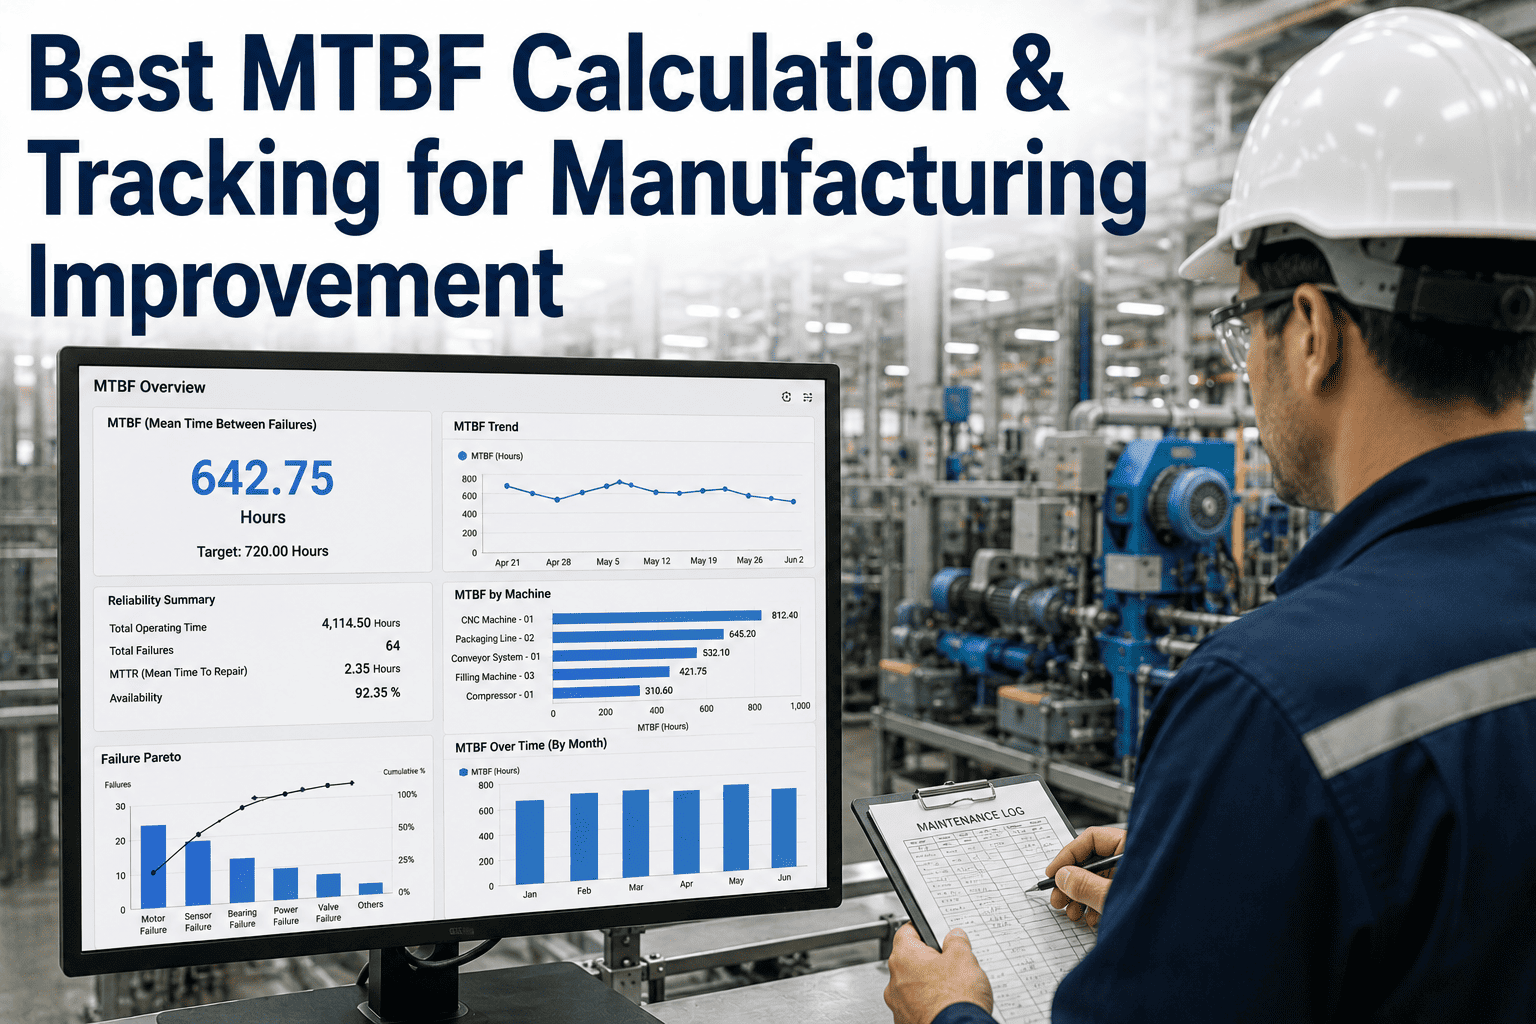
MTBF and MTTR get mentioned in the same breath so often that they start to sound like two halves of one idea, but they answer two genuinely different questions. MTBF asks how long a piece of equipment runs before it fails; MTTR asks how long it takes to get that equipment running again once it has. A plant can have an excellent MTBF and a terrible MTTR, or the reverse, and each combination points maintenance leadership toward a completely different fix. Confusing the two, or worse, blending them into a single vague "reliability score," is how improvement budgets end up spent on the wrong problem. This guide separates the two clearly and shows how to read them together — and if you'd like both tracked automatically on your own assets, book a demo with iFactory.
Two Metrics, Two Questions, Two Different Fixes
MTBF measures how often equipment fails. MTTR measures how fast you recover. Confusing the two sends improvement budget to the wrong problem.
Side by Side: What Each Metric Actually Measures
Placing the two definitions next to each other makes the distinction obvious — one is about frequency, the other is about recovery speed, and neither one implies anything about the other.
Mean Time Between Failures
The average operating time between one failure and the next, measured across a defined period.
Answers: "How reliable is this equipment?"
Driven by: design quality, wear patterns, preventive maintenance discipline, operating conditions.
Mean Time To Repair
The average time from failure detection to verified return to normal operation.
Answers: "How fast can we recover when it fails?"
Driven by: technician skill, spare parts availability, diagnostic tools, response procedures.
The Four Combinations — and What Each One Means
Reading MTBF and MTTR together, rather than in isolation, is what actually tells you where to focus. The same overall availability figure can come from four very different underlying situations.
High MTBF, Low MTTR
Rarely fails, and recovers fast when it does. The target state — protect it with continued preventive maintenance and a well-stocked spares program.
High MTBF, High MTTR
Rarely fails, but each failure is a long, painful event. Focus on repair speed — spares availability, diagnostic tooling, technician training on this specific asset.
Low MTBF, Low MTTR
Fails often, but recovers quickly each time. Total downtime may look acceptable, but frequent stops still fragment throughput. Focus on root-cause reliability work.
Low MTBF, High MTTR
Fails often and takes a long time to fix each time. The highest-priority asset in the plant for a full reliability review — this combination compounds losses fastest.
See Which Quadrant Your Assets Fall Into
iFactory tracks MTBF and MTTR side by side for every asset, so the right fix is obvious instead of guessed at.
How Both Feed Into Availability
MTBF and MTTR combine into a single availability figure, which is often what actually matters most to production planning — but arriving at that figure without understanding its two components leaves you unable to act on it.
A machine with a 200-hour MTBF and a 2-hour MTTR reaches roughly 99% availability. Improving MTTR to 1 hour moves availability only marginally — improving MTBF to 400 hours has a far larger effect, illustrating why knowing which lever to pull matters more than watching availability alone.
Frequently Asked Questions
Which metric should a plant prioritize improving first, MTBF or MTTR?
It depends on which quadrant a given asset currently sits in, which is exactly why tracking both together matters more than optimizing either one blindly. An asset with a low MTBF and high MTTR combination generally deserves priority since it compounds losses on both fronts, while an asset with a strong MTBF but a lagging MTTR often has a faster, cheaper fix available through better spares stocking or technician training rather than a deeper reliability redesign.
Can MTTR improvements actually make MTBF worse?
Yes, in a specific and important way — rushing repairs to hit an MTTR target without addressing the underlying failure cause can lead to a quick fix that fails again sooner than a more thorough repair would have. This is why the two metrics should be reviewed together rather than optimized independently; a maintenance team incentivized purely on MTTR speed has a real incentive to patch rather than properly diagnose, which erodes MTBF over time.
How do we calculate MTBF for equipment that has never actually failed yet?
For newer equipment with limited failure history, MTBF estimates typically rely on manufacturer reliability specifications, similar equipment's historical performance, or a running calculation that gets more accurate as real operating data accumulates. Treat early MTBF figures on new equipment as provisional and expect the number to stabilize meaningfully after the first several months of live failure data collection.
Is a higher availability number always better than a lower one, regardless of the MTBF/MTTR mix behind it?
Not necessarily from a risk perspective, even though the raw output impact is similar. An asset achieving 99% availability through a very high MTBF and slow MTTR carries more schedule risk than one achieving the same 99% through a lower MTBF and very fast MTTR, because an unexpected long repair on the first asset has a much larger potential downside if something goes wrong with the repair itself.
How do we start tracking MTBF and MTTR together instead of just availability?
The starting requirement is consistent failure event logging with accurate timestamps for both the failure onset and the verified repair completion — most of the underlying data already exists in a CMMS or maintenance log, and the gap is usually in calculating and displaying the two metrics side by side rather than collecting new data. Book a demo to see this breakdown running against your own asset history.
Stop Guessing Which Metric Needs Attention
Book a 30-minute demo and see MTBF and MTTR tracked side by side for every asset on your line.