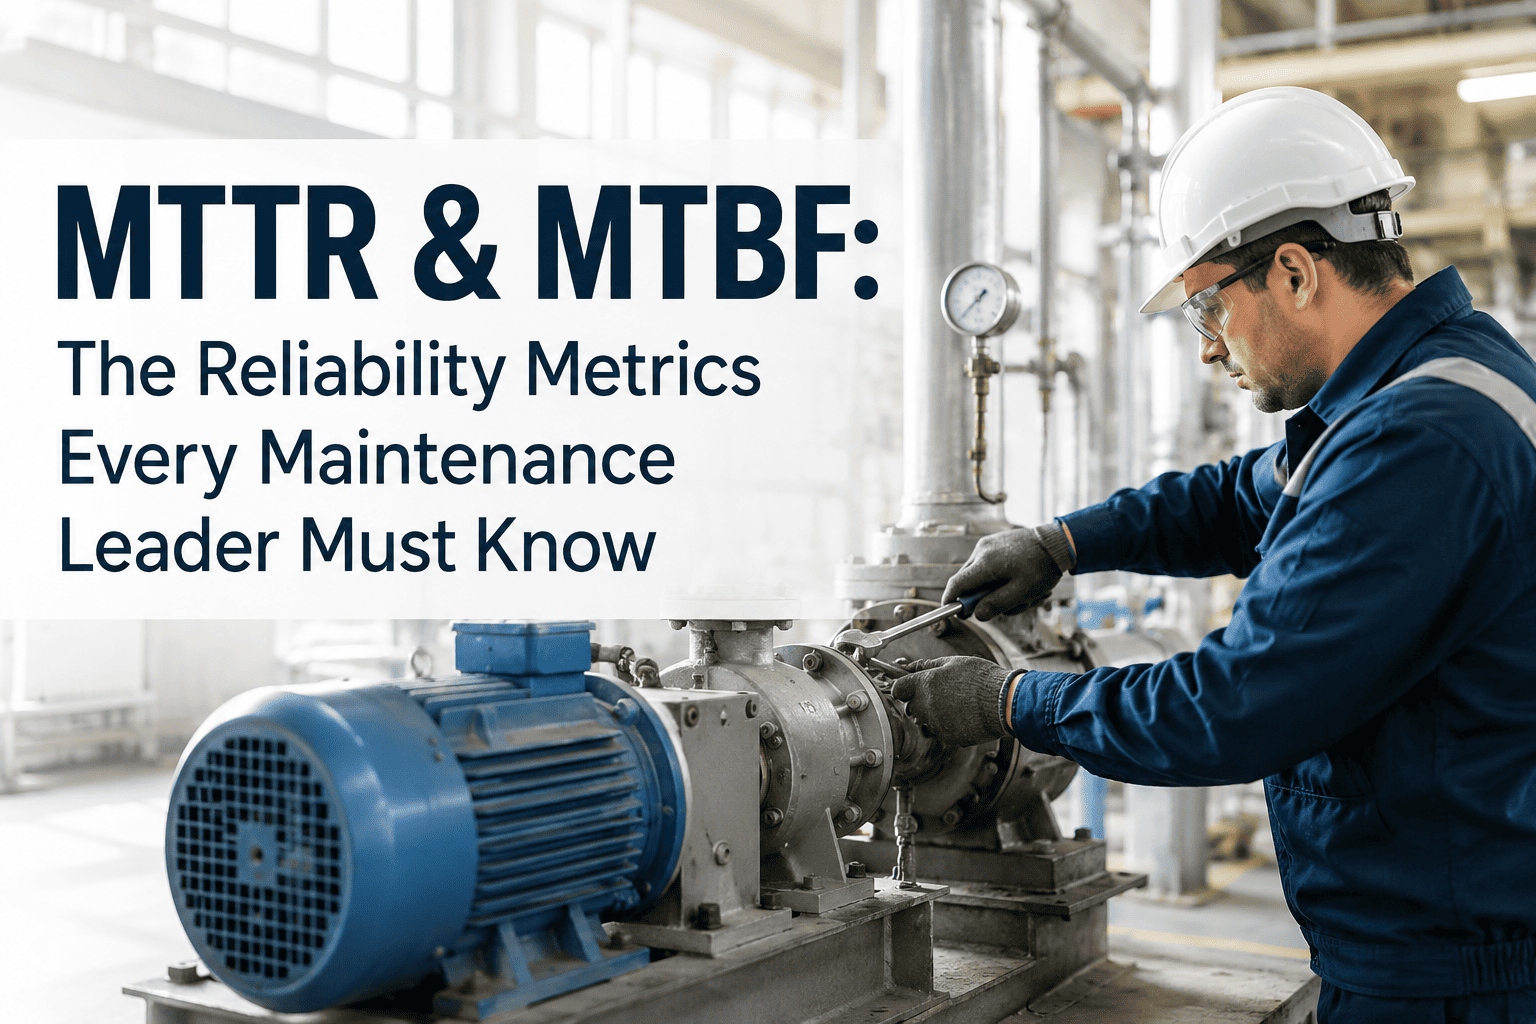
Most maintenance departments track more metrics than anyone actually reviews, and fewer metrics than they actually need, at the same time, because nobody built the KPI list around a deliberate structure. A maintenance KPI framework fixes that by organizing metrics into a hierarchy, leading indicators that predict future performance sitting at the foundation, lagging indicators that confirm past results sitting above them, so a team knows exactly which numbers to check weekly and which ones matter more on a monthly or quarterly cadence. Without that structure, KPI reviews drift toward whichever number happens to look alarming that week, rather than following a consistent, balanced discipline that actually improves reliability over time. Teams ready to build a properly structured KPI framework can start that process with iFactory's support team.
A Plant Tracking Only Lagging Metrics Is Always Reacting, Never Predicting
iFactory structures your maintenance KPIs into a proper hierarchy, leading indicators at the foundation and lagging indicators confirming the results, so your team knows exactly which numbers to act on and when.
Why Most KPI Dashboards Fail to Change Behavior
A dashboard with thirty metrics dilutes attention until nothing on it gets acted on consistently, while a dashboard with only lagging metrics tells a team what already went wrong without ever giving them time to intervene. The right framework isn't about tracking more, it's about structuring fewer, better-chosen metrics so each one has a clear owner and a clear action attached to it.
Too Many Metrics to Actually Review
A sprawling KPI list dilutes focus until weekly reviews become a scan for anything red rather than a genuine performance discipline.
Only Lagging Metrics Get Tracked
MTBF, MTTR, and total downtime confirm what already happened, but without leading indicators a team has no early warning before the next failure.
No Consistent Review Cadence by Metric Type
Leading indicators need weekly attention to catch developing problems, while lagging indicators are better suited to monthly review, and treating every metric the same undermines both.
Metrics Become Scorecards Instead of Diagnostic Tools
Tying KPIs directly to individual performance consequences pushes teams to game the numbers rather than use them to genuinely improve reliability.
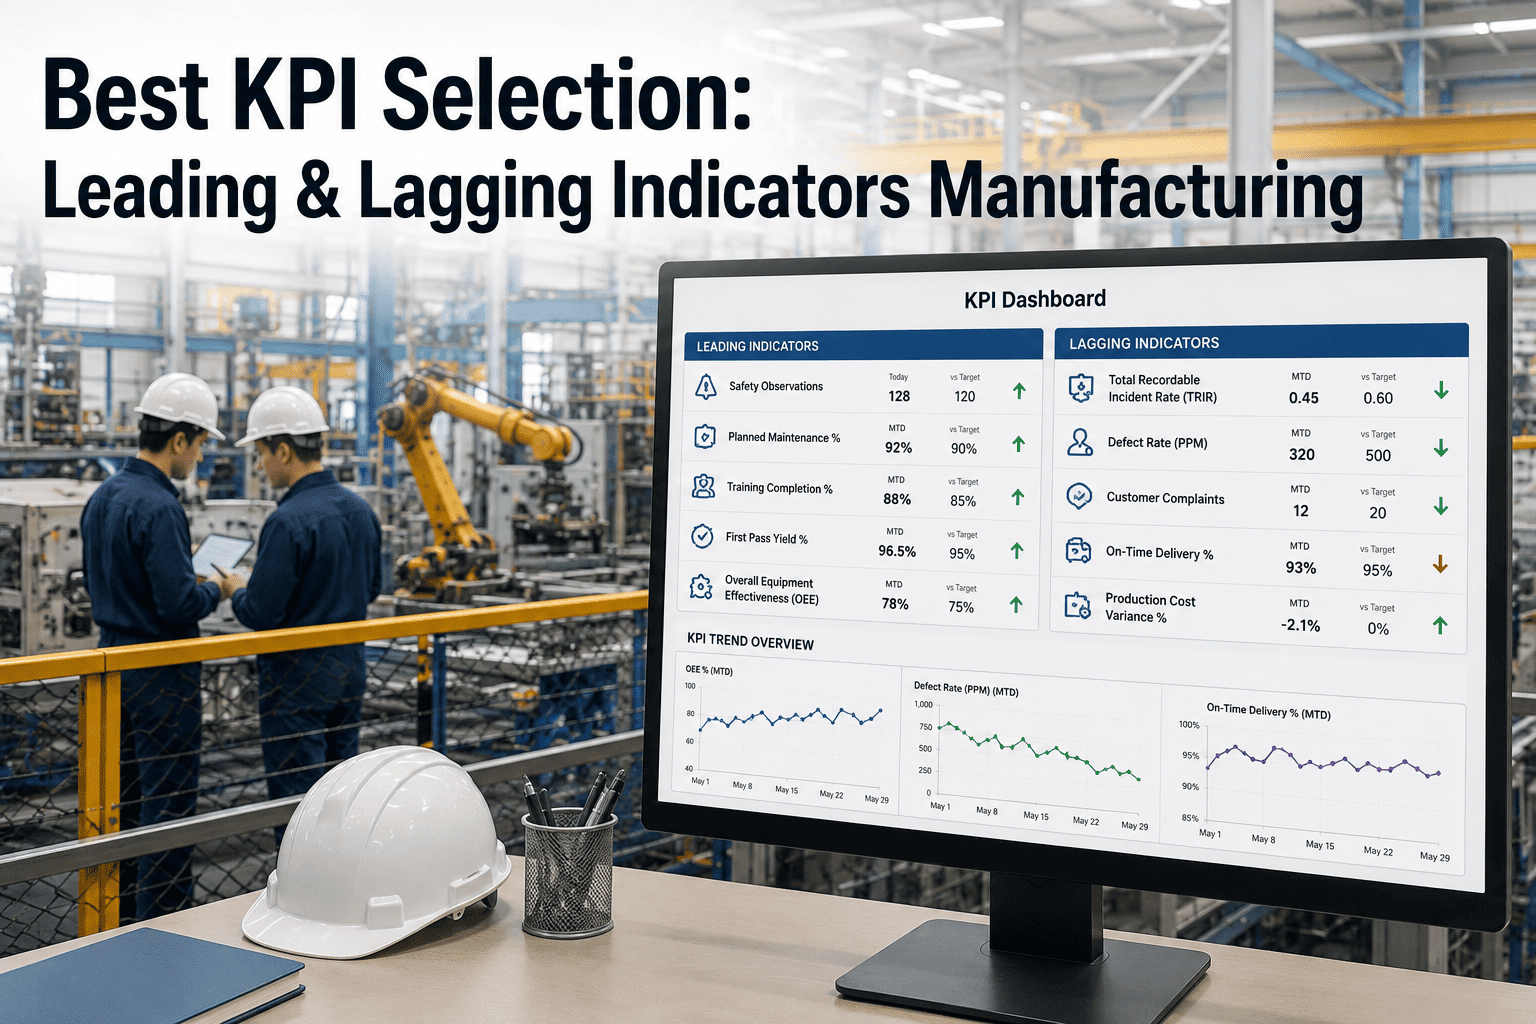
Leading and Lagging Indicators, Side by Side
A balanced framework needs both categories working together, since leading indicators without lagging confirmation can't prove real outcomes improved, and lagging indicators alone leave no time to act before the damage is done.
| Metric | Type | World-Class Benchmark | Review Cadence |
|---|---|---|---|
| PM Compliance Rate | Leading | 90%+ | Weekly |
| Schedule Compliance | Leading | 90%+ | Weekly |
| Backlog Ratio | Leading | 2-4 weeks | Weekly |
| MTBF | Lagging | Trending upward | Monthly |
| OEE | Lagging | 85%+ | Monthly |
Building the Framework in the Right Order
A KPI framework built from the top down, starting with ambitious lagging metrics before the underlying data foundation exists, tends to produce numbers nobody trusts. Building from the base up produces a framework that actually holds up under scrutiny.
Fix Work Order Data Quality First
Mandatory fields, accurate timestamps, and consistent failure codes at close-out, since every KPI above this layer depends on this data being clean.
Establish the Core Leading Indicators
PM compliance and schedule compliance, tracked weekly, since these require no historical baseline and are actionable immediately.
Layer in Lagging Indicators Once Data Matures
MTBF and MTTR become meaningful once enough clean failure and repair records have accumulated to calculate them reliably.
Connect the Dots Between Tiers in Every Review
A monthly review that explicitly links a leading indicator's movement to its expected lagging outcome builds the team's understanding of why both matter.
Stop Drowning in Metrics Nobody Actually Reviews
iFactory structures your maintenance KPIs into a clear leading-and-lagging hierarchy, so your team always knows which number to check this week and why.
A Composite Scenario: The Dashboard With Thirty Metrics and Zero Action
A composite plant's reliability team had built an impressively comprehensive dashboard tracking over thirty maintenance metrics, updated automatically from their CMMS, and yet unplanned downtime had shown no meaningful improvement in over a year. A review of their actual weekly meeting notes revealed the team rarely discussed more than two or three numbers consistently, usually whichever happened to look worst that particular week.
The team rebuilt their framework around just five core metrics, structured explicitly into leading and lagging tiers, with PM compliance and schedule compliance reviewed every week and MTBF and OEE reviewed monthly alongside a discussion of how the leading indicators from the prior weeks had moved. Within two quarters, PM compliance had climbed from the high seventies into the mid-nineties, and MTBF on their most critical assets began trending upward for the first time in the team's recent memory.
Common Mistakes in Maintenance KPI Framework Design
Tracking Everything Instead of the Right Few
A comprehensive dashboard that nobody reviews consistently produces less real improvement than a focused five-metric framework someone actually acts on weekly.
Reviewing Every Metric on the Same Schedule
Leading indicators need weekly attention to catch developing problems early, while forcing lagging indicators onto the same cadence adds noise without adding insight.
Skipping the Data Quality Foundation
Calculating MTBF or PM compliance from incomplete work order close-outs produces numbers that look precise but don't hold up under scrutiny.
Turning KPIs Into Individual Scorecards
Attaching personal consequences directly to a metric incentivizes gaming the number rather than genuinely improving the underlying reliability it's meant to reflect.
Is Your Plant Ready to Build a Structured KPI Framework
Work orders close out with complete, mandatory fields
Clean timestamp and failure code data is the foundation every leading and lagging metric above it depends on.
You can name which metrics are leading versus lagging today
If your current dashboard doesn't distinguish the two, that's the first structural fix a new framework should make.
Leadership is willing to start with fewer metrics
A disciplined five-metric framework consistently reviewed beats a comprehensive dashboard nobody actually acts on.
Review cadences are already differentiated by metric type
Weekly leading indicator reviews paired with monthly lagging indicator reviews is the structure a mature framework runs on.
Frequently Asked Questions
Which three KPIs should a plant start with if it isn't tracking anything consistently today?
A widely recommended starting set is OEE, PM compliance, and the planned-to-reactive maintenance ratio, since OEE confirms whether maintenance is protecting production capacity, PM compliance reveals scheduling discipline, and the planned-to-reactive ratio shows whether the team is preventing problems or firefighting them. These three together give a plant almost everything it needs to understand its current reliability posture before adding more granular metrics. Plants wanting help selecting the right starting set can talk to iFactory support.
Why does PM compliance matter more than MTBF if MTBF is the "real" outcome?
MTBF is genuinely the outcome that matters most, but by the time it declines, the failures behind that decline have already happened, which means MTBF alone offers no opportunity to intervene before damage is done. PM compliance is the leading indicator most directly correlated with future MTBF, so a compliance rate dropping below roughly eighty-five percent reliably predicts a measurable rise in breakdown frequency within the following sixty to ninety days, giving a team real time to act.
How many KPIs is too many for a maintenance dashboard?
There's no universal number, but most reliability programs that actually change behavior settle on somewhere between five and twelve core metrics, structured clearly into leading and lagging tiers with a defined owner and review cadence for each. Dashboards that grow well beyond that tend to dilute attention until teams default to scanning for whatever looks alarming that week rather than following a consistent, balanced review discipline.
How long does it take to see results after restructuring a KPI framework?
Leading indicators like PM compliance and schedule compliance often show measurable improvement within four to eight weeks once planning discipline takes hold, while lagging reliability metrics like MTBF and OEE typically take three to six months to reflect that improvement, since they depend on failure data accumulating over a longer period. Book a demo to see how a restructured framework gets tracked against both timelines.
Should every plant in a multi-site group use the exact same KPI framework?
The core structure, leading indicators reviewed weekly and lagging indicators reviewed monthly, should stay consistent across every site so performance can be compared fairly, but specific targets may need to flex based on equipment age, criticality, and current maturity stage. A twenty-year-old facility and a newly commissioned plant can both use the same framework while working toward different near-term benchmarks within it.
Build a KPI Framework Your Team Will Actually Use Every Week
iFactory structures leading and lagging maintenance indicators into one clear, actionable framework, so reliability improvement becomes a discipline, not a dashboard nobody checks.