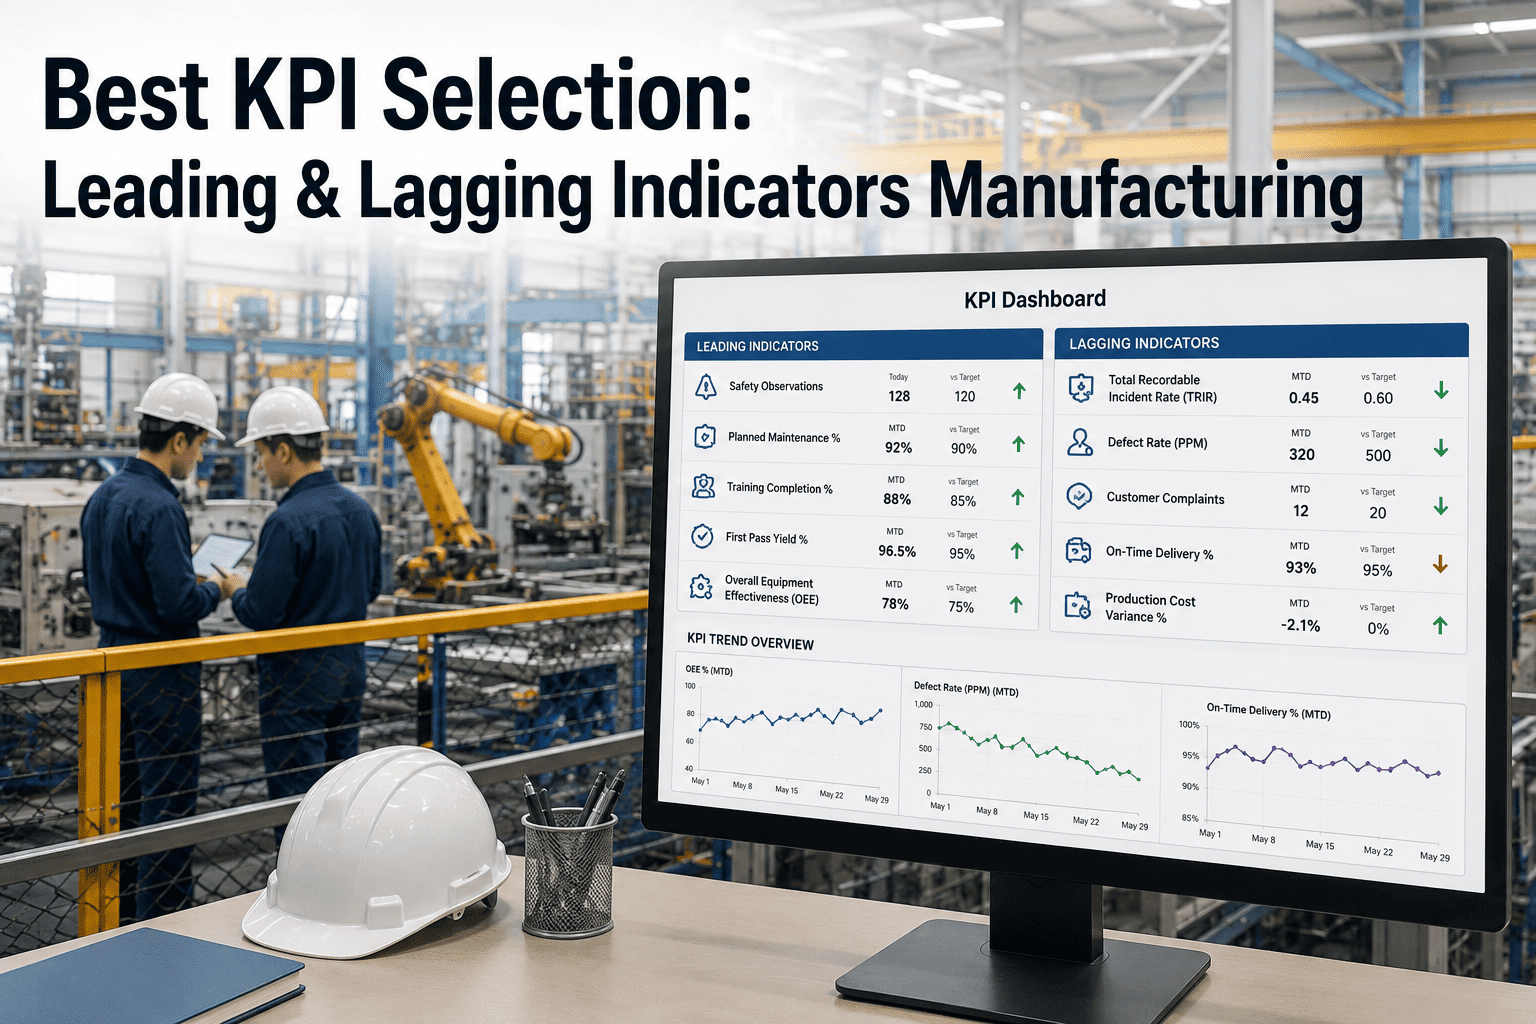
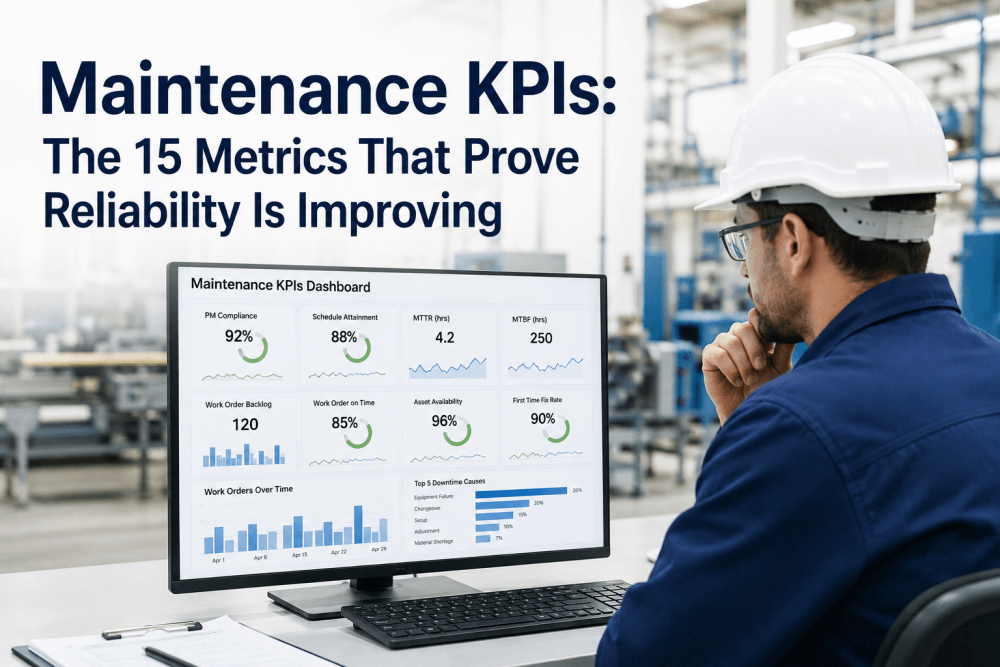
Walk onto almost any plant floor and you'll find a wall of numbers — OEE, scrap rate, downtime hours, throughput, first-pass yield — updated daily, sometimes hourly, and largely ignored by the people who could act on them. The problem usually isn't a shortage of metrics. It's that most of what gets tracked is lagging: it tells you what already happened, after the shift is over and the cost is booked. A dashboard built entirely on lagging indicators is a rearview mirror bolted to the front of the car. The plants that actually move their numbers pair every lagging KPI with a leading one that gives someone time to act before the result is locked in, and a short working session with our team can walk through what that pairing looks like against your own KPI list.
KPI Design · Leading vs Lagging Indicators
Choosing Manufacturing KPIs That Predict Outcomes, Not Just Report Them
Most dashboards are built from whatever data was easiest to pull, not from a deliberate mix of indicators that predict performance and indicators that confirm it. This is a working framework for selecting both — and knowing which one belongs in front of an operator versus a director.
Leading Indicator
Measures a condition or behavior that predicts a future result. It moves before the outcome does, which is exactly what gives someone time to intervene.
- Preventive maintenance compliance rate
- Operator training hours completed
- Percentage of jobs with a documented setup sheet
- Sensor-flagged vibration anomalies per week
Lagging Indicator
Measures a result that has already occurred. It's accurate and easy to audit, but by the time it appears on a report, the cost or the miss is already booked.
- Overall Equipment Effectiveness (OEE)
- Scrap and rework cost
- Unplanned downtime hours
- On-time delivery percentage
Why the Distinction Matters
A Dashboard Full of Lagging Metrics Can Only Tell You What You Already Lost
Lagging indicators earn their place on any dashboard because they're objective, easy to calculate from data that already exists, and difficult to argue with — a scrap cost of forty thousand dollars for the month is a fact, not an opinion. The trouble is that a plant relying only on lagging metrics finds out about a problem the same way it finds out about a car accident: after it's happened, when the only options left are cleanup and damage control. A supervisor staring at last month's downtime report has no lever left to pull on last month's downtime. Leading indicators exist to close that gap. They track the inputs and conditions that reliably precede an outcome, so a rising trend shows up while there's still time to change course — a maintenance compliance rate slipping below target this week is a signal that downtime is likely to rise next month, not a report that it already has. The strongest manufacturing dashboards treat lagging metrics as the scoreboard and leading metrics as the plays being run to influence that score, and they make sure every important lagging KPI has at least one leading indicator feeding into it.
How the Two Connect
Leading Indicators Sit Upstream of the Lagging Result They Predict
The relationship between a leading and a lagging indicator isn't arbitrary — it follows a causal chain that starts with a controllable behavior and ends in a business result. Mapping that chain for each of your core KPIs is what turns a metric list into an actual management system, because it tells a supervisor exactly which lever connects to which outcome instead of leaving them to guess.
Controllable Input
PM tasks completed on schedule
→
Leading Indicator
PM compliance rate
→
Lagging Result
Unplanned downtime hours
→
Business Outcome
Throughput & on-time delivery
Applied by Function
Leading and Lagging Pairs Across Common Manufacturing Functions
The same leading-lagging logic applies differently depending on which part of the plant you're measuring. A few common pairs across the functions most dashboards try to cover:
| Function | Leading Indicator | Lagging Indicator It Predicts |
|---|
| Maintenance | PM compliance rate | Unplanned downtime hours |
| Quality | In-process inspection pass rate | Final scrap and rework cost |
| Safety | Near-miss reports filed | Recordable incident rate |
| Workforce | Cross-training completion rate | Absenteeism-driven line stoppages |
| Supply Chain | Supplier on-time delivery rate | Line stoppages due to material shortage |
See Which Leading Indicators Actually Predict Your Downtime
Every plant's causal chain is a little different. A short session maps your current lagging metrics back to the leading indicators that move ahead of them, using your own historical data.
Common Pitfalls
Where KPI Selection Usually Goes Wrong
Most dashboards don't fail because nobody thought about metrics — they fail because the selection process optimized for what was easy to pull rather than what actually predicted performance. A few patterns show up repeatedly across plants that later have to rebuild their KPI structure from scratch.
Tracking only what the ERP already reports
Lagging financial and production metrics get pulled first because they already exist in a report somewhere, while the leading behavioral data that predicts them never gets collected at all.
Too many metrics, no hierarchy
A dashboard with forty KPIs and no distinction between leading and lagging gives everyone equal weight to numbers that matter very differently, which usually means none of them get acted on consistently.
Leading indicators that don't actually lead
A metric only counts as leading if it reliably moves before the result it's meant to predict — training hours logged with no link to fewer defects is just another lagging number in disguise.
No owner assigned to the leading metric
A leading indicator only creates value if someone is responsible for reacting when it moves; without an assigned owner it becomes background noise on a dashboard nobody checks.
Selection Framework
A Four-Step Process for Building a Balanced KPI Set
01
Start from the business outcome, not the available data
Identify the two or three results that matter most — on-time delivery, cost per unit, safety incident rate — before looking at what's easy to measure.
02
Map the causal chain backward
For each lagging outcome, ask what controllable input, if it slipped, would predictably cause that outcome to worsen within a known time window.
03
Assign a measurement cadence to each pair
Leading indicators typically need daily or shift-level visibility since their value is in early warning, while lagging indicators are often reviewed weekly or monthly.
04
Assign ownership and a response threshold
Every leading indicator needs a named owner and a defined trigger point at which they're expected to act, or the metric becomes decoration rather than a management tool.
Matching Metrics to Roles
Not Every KPI Belongs on Every Screen
A common failure mode is showing every role the same dashboard. An operator needs a real-time leading indicator they can act on within the hour, a supervisor needs a shift-level summary that blends both leading and lagging views, and a director needs the lagging trend that justifies a resourcing decision. Flattening all three into one dashboard usually means the operator drowns in numbers they can't influence and the director scrolls past the detail they don't need.
Operator
Real-time leading indicators tied to the immediate task — cycle time drift, in-process defect flags, machine parameter deviation.
Supervisor
Shift-level blend of leading and lagging — PM compliance for the shift alongside downtime hours booked so far.
Director
Monthly and quarterly lagging trends tied to cost, throughput, and delivery — the numbers that justify capital and staffing decisions.
Build a Role-Specific KPI Set for Every Level of Your Plant
A dashboard designed for one audience rarely serves all three. See how a leading-lagging framework translates into different views for operators, supervisors, and directors.
The plants that struggle with KPI adoption almost always have the same root cause — they picked metrics because the data existed, not because the metric predicted anything useful. Once a team maps two or three leading indicators back to the lagging results they actually care about, the conversation in daily meetings changes completely, from reviewing what already went wrong to deciding what to do about a number that's still moving.
Rohan Deveraux-Iyer
Manufacturing Performance Analytics Consultant · 11 years in plant KPI design
Frequently Asked
KPI Selection — Common Questions
How many KPIs should a single dashboard actually show?
Most plants get better results from five to eight well-chosen KPIs per role than from twenty poorly prioritized ones, because a shorter list with a clear leading-lagging pairing is far more likely to get checked and acted on every shift.
Book a review to see a right-sized set built around your own priorities.
Can a metric be both leading and lagging depending on context?
Yes — scrap rate is a lagging indicator of quality performance but can act as a leading indicator of a machine drifting out of calibration if it's reviewed at a shift level rather than a monthly one, so the classification depends on the time window and what decision it's meant to inform.
What if we don't have historical data to validate a leading indicator?
Start with the indicator that has the strongest logical causal link to the outcome, track both together for a few months, and let the correlation confirm or disprove the pairing rather than waiting for perfect historical validation before acting.
Ask our team how this validation process works in practice.
Who should own a leading indicator on the plant floor?
Ownership should sit with whoever has the authority to act when the number crosses a threshold — a maintenance supervisor for PM compliance, a quality lead for in-process inspection rates — rather than being centralized with someone who only reviews the dashboard after the fact.
How often should a KPI set be reviewed and revised?
A quarterly review is usually enough to catch indicators that have stopped predicting their paired outcome, whether because a process changed or the original causal link weakened, without constantly reshuffling a dashboard people are still learning to trust.
Book a session to set up that review cadence for your plant.
Turn a Wall of Numbers Into a Set of KPIs People Actually Act On
iFactory helps manufacturing teams pair every lagging outcome with the leading indicators that predict it, and routes the right view to operators, supervisors, and directors so each role sees exactly what they need to act on.