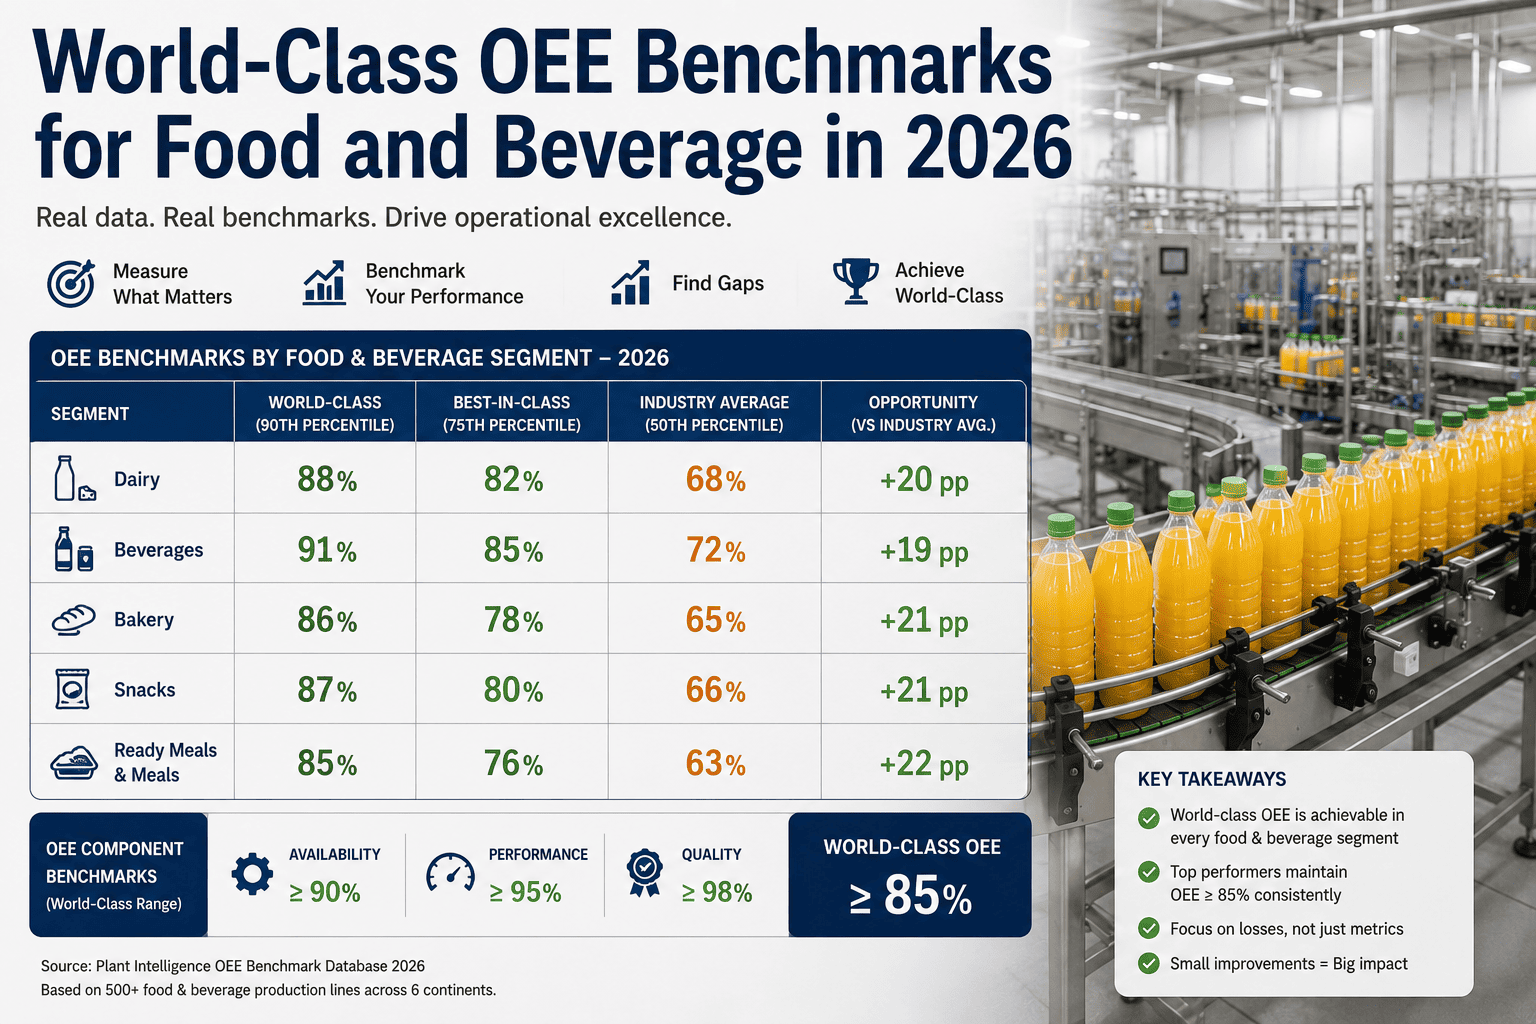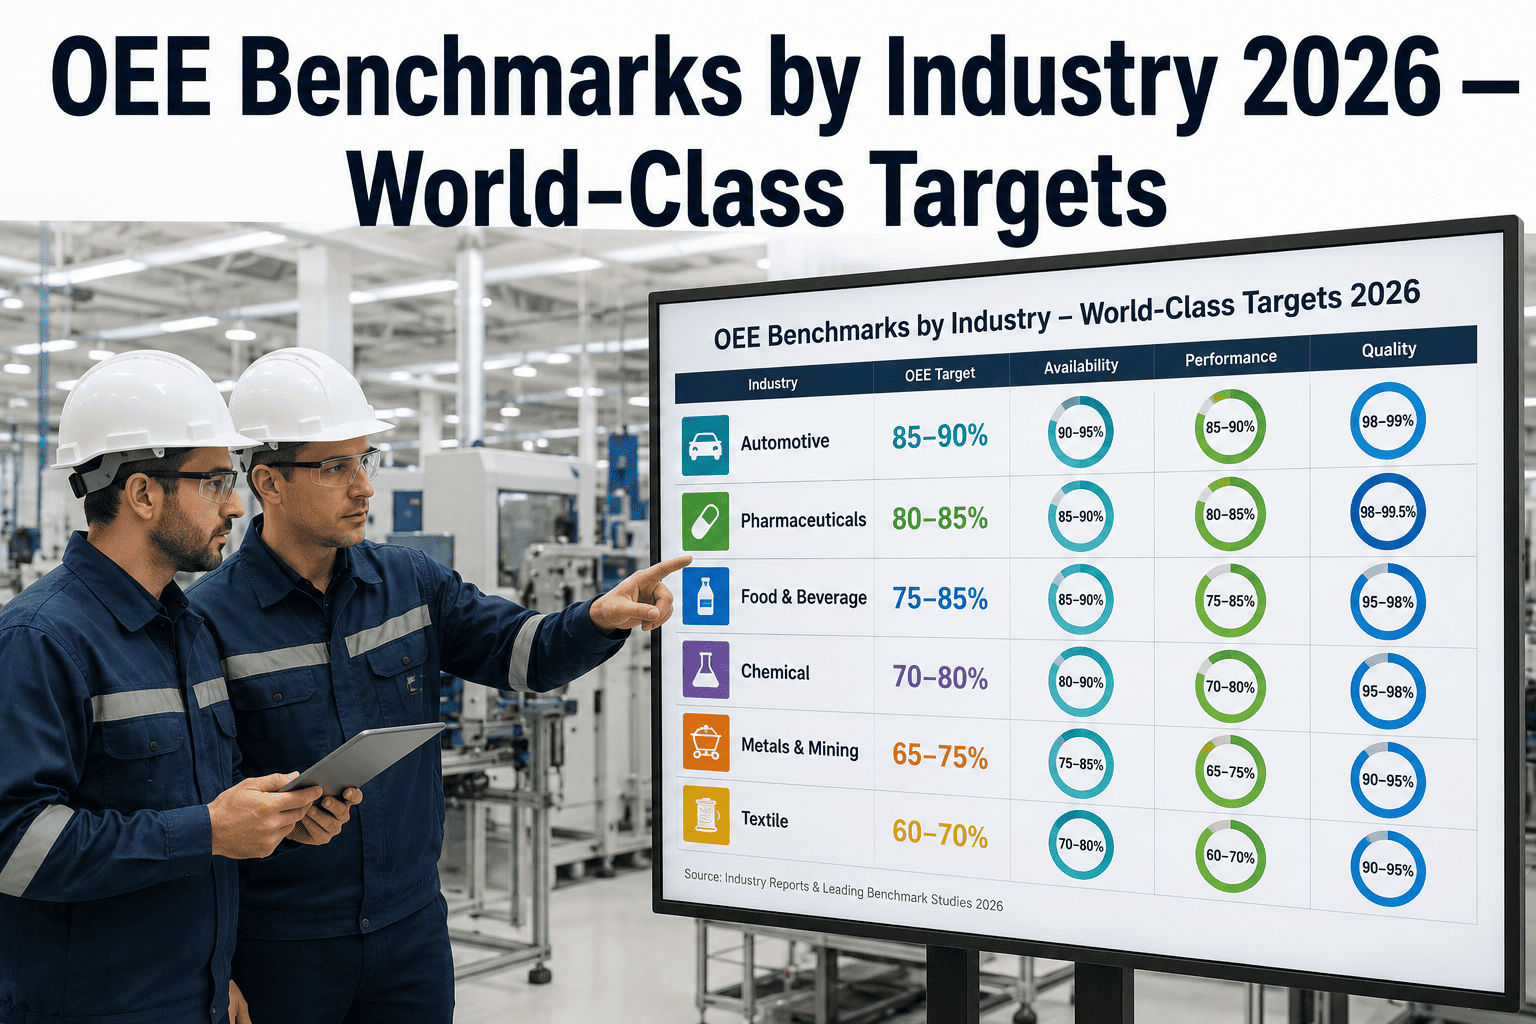
Overall Equipment Effectiveness has become the universal scoreboard for manufacturing performance, but the number on its own means very little without an industry-appropriate benchmark to compare it against. A steel plant running 75% OEE is performing exceptionally well given the process complexity involved, while an automotive line at the same 75% is likely leaving significant throughput on the table against a world-class target closer to 85%. Updated 2026 benchmarks put world-class OEE at 85%+ for automotive, 65%+ for pharmaceutical, 80%+ for FMCG, 75%+ for steel, and 78%+ for food manufacturing, each reflecting the specific loss profile inherent to that process type. To see how your plant compares and what's realistically achievable, Book a Demo with iFactory's benchmarking team.
Know What World-Class Actually Looks Like in Your Industry.
iFactory AI tracks OEE continuously and breaks losses into the six categories that actually drive improvement, benchmarked against your specific industry standard.
Why a Single Global OEE Target Doesn't Work Across Industries
The commonly cited "world-class OEE is 85%" figure originated from discrete manufacturing and automotive assembly contexts, and applying it uniformly across every industry creates two problems: it sets unrealistic expectations for process industries with inherently higher changeover complexity, and it lets discrete manufacturers with genuine improvement headroom settle for underperformance because 75% still sounds respectable in the abstract.
Pharmaceutical manufacturing, for example, carries validation and cleaning requirements between batches that structurally cap achievable performance loss lower than a comparable FMCG line producing a single consistent product. Steel production involves continuous process constraints around temperature and material flow that create availability losses simply not present in discrete assembly. Industry-specific benchmarks account for these structural differences rather than measuring every plant against a single number that only fits certain process types.
World-Class OEE Targets by Industry
The gauges below reflect the updated world-class OEE benchmark for each major manufacturing sector as of 2026.
Availability, Performance, and Quality — Where Each Industry Loses Most
OEE is the product of three components, and the industry that struggles most with one component often struggles least with another, which is exactly why a single aggregate target obscures more than it reveals.
| Industry | Primary Loss Driver | Secondary Loss Driver |
|---|---|---|
| Automotive | Changeover time (Performance) | Minor stoppages (Performance) |
| Pharmaceutical | Cleaning validation (Availability) | Batch record delays (Availability) |
| FMCG | Changeover between SKUs (Performance) | Packaging defects (Quality) |
| Steel | Planned maintenance windows (Availability) | Temperature-related rework (Quality) |
| Food | Sanitation cycles (Availability) | Fill accuracy rejects (Quality) |
The Loss Categories Behind Every OEE Gap
Unplanned equipment failure remains the most direct availability loss and the highest priority for predictive maintenance investment.
Time lost switching between products or batches, often the single largest recoverable loss category in FMCG and automotive.
Short, frequent stops that rarely get logged individually but compound into significant performance loss over a shift.
Running below rated speed to avoid quality issues or equipment strain, a hidden performance loss many plants underestimate.
Quality loss during process warm-up or changeover stabilization before parameters reach steady-state production condition.
Ongoing quality loss during steady-state production, the category most directly addressed by inline AI vision inspection.
How Plants Move From Current OEE Toward Their Industry Benchmark
Automated OEE calculation — availability, performance, and quality are calculated continuously from machine data rather than manual shift-end entry, eliminating reporting lag and inconsistency.
Loss categorization — every minute of lost OEE is attributed to one of the six big loss categories, building an accurate Pareto of what to fix first.
Industry benchmark comparison — current performance is measured against the appropriate industry-specific target rather than a generic global figure.
Targeted improvement tracking — improvement initiatives are tracked against their specific loss category to confirm real OEE movement rather than assumed gains.
Why TEEP Matters Once OEE Improvement Plateaus
Plants that have closed most of the gap to their industry OEE benchmark often find further improvement harder to identify using OEE alone, since OEE only measures effectiveness during scheduled production time. Total Effective Equipment Performance extends the same calculation across all calendar time, revealing capacity that exists but is never scheduled — a distinction that matters significantly when evaluating whether the next unit of demand growth requires new capital equipment or simply better utilization of existing assets during currently unscheduled hours.
This shift from OEE to TEEP as the primary improvement lens typically happens once a plant is consistently performing at or above its industry benchmark, at which point the conversation moves from "how do we run better" to "how do we run more."
OEE Benchmarks by Industry — Frequently Asked Questions
Why is pharmaceutical OEE benchmarked so much lower than automotive?
Pharmaceutical manufacturing carries mandatory cleaning validation and batch documentation requirements between production runs that structurally consume availability time in a way automotive assembly does not, so 65% represents genuine excellence within that process constraint rather than underperformance.
How do we calculate OEE accurately if we're currently doing it manually?
Manual OEE calculation is prone to underreporting minor stoppages and inconsistent shift-to-shift data entry. Automated calculation from existing PLC or SCADA data typically reveals a lower true OEE than manual reporting suggested, which is a common and expected finding in initial deployments.
Which of the six big losses should we tackle first?
This depends entirely on your specific loss Pareto, which is why loss categorization matters more than generic advice. Most plants find one or two categories account for the majority of their gap to benchmark, and addressing those first delivers the fastest OEE improvement.
Can we compare OEE across different plants within our company fairly?
Only if the plants run comparable processes and product types, since OEE benchmarks vary by industry and even by specific process within an industry. Comparing a continuous process line against a high-mix changeover line using raw OEE numbers alone can be misleading without loss category context.
How long does it take to move from current OEE to our industry benchmark?
This varies significantly based on the size of the gap and which loss categories dominate, but most plants see meaningful progress within six to twelve months of implementing automated tracking and targeted improvement action. Reach out via iFactory support for a realistic estimate based on your current numbers.
See How Your OEE Compares to Your Industry's World-Class Target.
Book a session with iFactory to benchmark your current OEE and identify which loss category offers the fastest path to improvement.