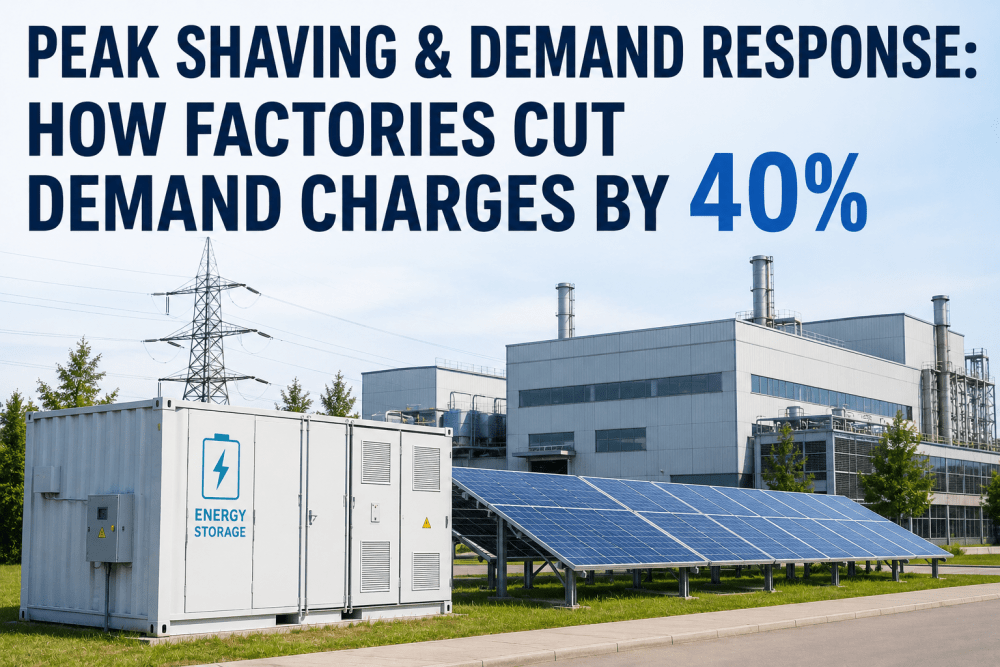
Demand charges quietly make up 30% to 70% of an industrial electricity bill—yet most factory leaders only see one big number on the invoice. The good news: those charges aren't fixed costs. They're a measurement of your worst 15 minutes of the month, and modern peak shaving and demand response strategies can shrink them by 40% or more without slowing production. Here's how U.S. manufacturers are flattening their load curves with AI forecasting, battery storage, and smart load shifting—and what it takes to build a program that actually pays back.
40%
share of bill from demand charges
15 min
interval that sets your monthly peak
$500K+
typical annual savings, mid-size plant
3–5 yr
payback on BESS + controls
The Demand Charge Problem Most Plants Miss
Most U.S. industrial utility tariffs bill in two parts: energy (kWh you consume) and demand (kW you peak at). Demand charges are calculated from your single highest 15-minute interval each billing cycle—one bad spike on one bad day can set your bill for the entire month. In capacity-constrained grids like PJM, those peak intervals also follow you forward: your summer "capacity tag" gets baked into next year's rates. A 200 kW spike at the wrong moment can cost a plant tens of thousands of dollars across the next twelve months.
$25–$40
Typical demand charge per kW-month (U.S. industrial)
Higher in CA, NY, MA, PJM territories
28–60%
Reported demand-charge reduction with BESS + EMS
8.7x
Higher savings from facility-controlled vs utility-controlled storage
30%
5-year TCO reduction with strategic load balancing
Not sure what your demand charges actually look like? Book a demo and we'll walk through a sample 15-minute interval analysis with you.
Peak Shaving vs Demand Response: Two Levers, Different Jobs
These terms get used interchangeably—but they solve different problems. Peak shaving is something you do for yourself, every billing cycle, to keep your own peak under a threshold. Demand response is something you do for the grid, on event days, in exchange for a payment from the utility or ISO. The best programs use both. Peak shaving runs every day in the background; demand response harvests extra revenue on the 10–40 highest-stress grid days per year.
GoalLower your monthly peak kW
TriggerInternal threshold, runs daily
PayoffAvoided demand charges
ToolsBESS, generators, load shedding, EMS
Control100% facility-controlled
GoalReduce load when grid is stressed
TriggerUtility/ISO signal, event days only
PayoffCapacity payments + energy revenue
ToolsCurtailment plan, BESS, aggregator
ControlCoordinated with utility/aggregator
The 5 Strategies That Drive a 40% Demand Charge Reduction
The 40% number isn't a marketing claim—it's an industry benchmark drawn from documented BESS deployments in U.S. and EU manufacturing. But hitting it consistently requires more than buying a battery. It takes a stack of five coordinated strategies, each addressing a different failure mode in how factories currently use power.
01
AI Load Forecasting
Machine learning models (LSTM, gradient boosting) predict the next 15–60 minutes of facility load using production schedule, weather, time of day, and historical patterns. Forecasts trigger storage dispatch before the peak hits—not after.
Typical accuracy: 95%+ on 15-min intervals
02
Battery Energy Storage (BESS)
Lithium-iron-phosphate batteries charge during off-peak hours and discharge during your forecasted peak window. Sized correctly, a 250 kWh / 125 kW system can shave 100+ kW off the monthly peak for a mid-size plant.
Documented: 28% monthly cost reduction
03
Production Load Shifting
Reschedule non-time-critical work—batch processes, chillers, compressors, EV chargers, electric heating—to off-peak windows. A schedule-aware EMS turns this into automated rules tied to your tariff calendar.
10–25% peak reduction with zero capex
04
Behind-the-Meter Generation
Solar PV, CHP, or natural gas gensets can offset grid draw during predictable peaks. Solar pairs especially well with BESS—midday surplus charges the battery for afternoon shaving.
Best for plants with 1,000+ kW peaks
05
Demand Response Enrollment
Enroll in utility or ISO programs (PJM, CAISO, ERCOT) to earn capacity payments for being available to curtail on event days. Revenue stacks on top of peak shaving savings without conflict.
$30–$60/kW-year in payments
Want a tailored stack for your plant? Book a demo with iFactory and we'll model the right combination based on your load profile.
How the Workflow Actually Runs
A peak shaving program isn't a one-time install—it's a continuous loop. Sensors stream interval data, AI forecasts the next peak, the EMS chooses the cheapest response (battery dispatch, load shed, or generator), and the system learns from every decision. Here's the full cycle iFactory's Energy Monitoring module runs in production environments:
1
Meter & Submeter Data Capture
Smart meters and submeters stream 1-second to 1-minute interval data into the EMS. PLC, Modbus, and OPC-UA tags pull equipment-level load from compressors, chillers, ovens, and lines.
2
AI Forecasts Next 15-Min Peak
LSTM and ensemble models combine current load, production schedule, weather, and historical patterns to predict whether the rolling demand window will exceed your threshold.
3
EMS Selects Cheapest Response
The control engine ranks options: battery discharge, deferrable load shed, generator start, or DR event participation. The cheapest action that hits the target wins.
4
Dispatch & Verify
Commands fire to BESS inverters, VFDs, or contactors. Meter feedback confirms the peak was avoided. If it wasn't, the model logs the miss and retrains overnight.
5
Report & Settle
Monthly reports reconcile actual peaks against the utility bill, surface savings, and document DR event performance for capacity payments.
ROI Math: What a Mid-Size Plant Actually Saves
Numbers vary by tariff, but the model is consistent. Here's a worked example for a 5 MW factory in a high-demand-charge territory (PJM, CAISO, or similar). The illustration below mirrors what iFactory customers typically see in years 1–5 after deploying integrated peak shaving and demand response.
| Line Item | Before | After Year 1 | After Year 3 |
|---|
| Monthly peak demand | 4,800 kW | 3,400 kW | 2,900 kW |
| Demand charge rate | $28 / kW-mo | $28 / kW-mo | $28 / kW-mo |
| Annual demand charges | $1,612,800 | $1,142,400 | $974,400 |
| DR capacity revenue | $0 | $48,000 | $72,000 |
| BESS arbitrage savings | $0 | $36,000 | $58,000 |
| Net annual benefit | — | $554,400 | $768,400 |
Curious what these numbers look like for your tariff? Book a demo and we'll run the model on your last 12 months of utility data.
What iFactory's Energy Monitoring Brings to the Stack
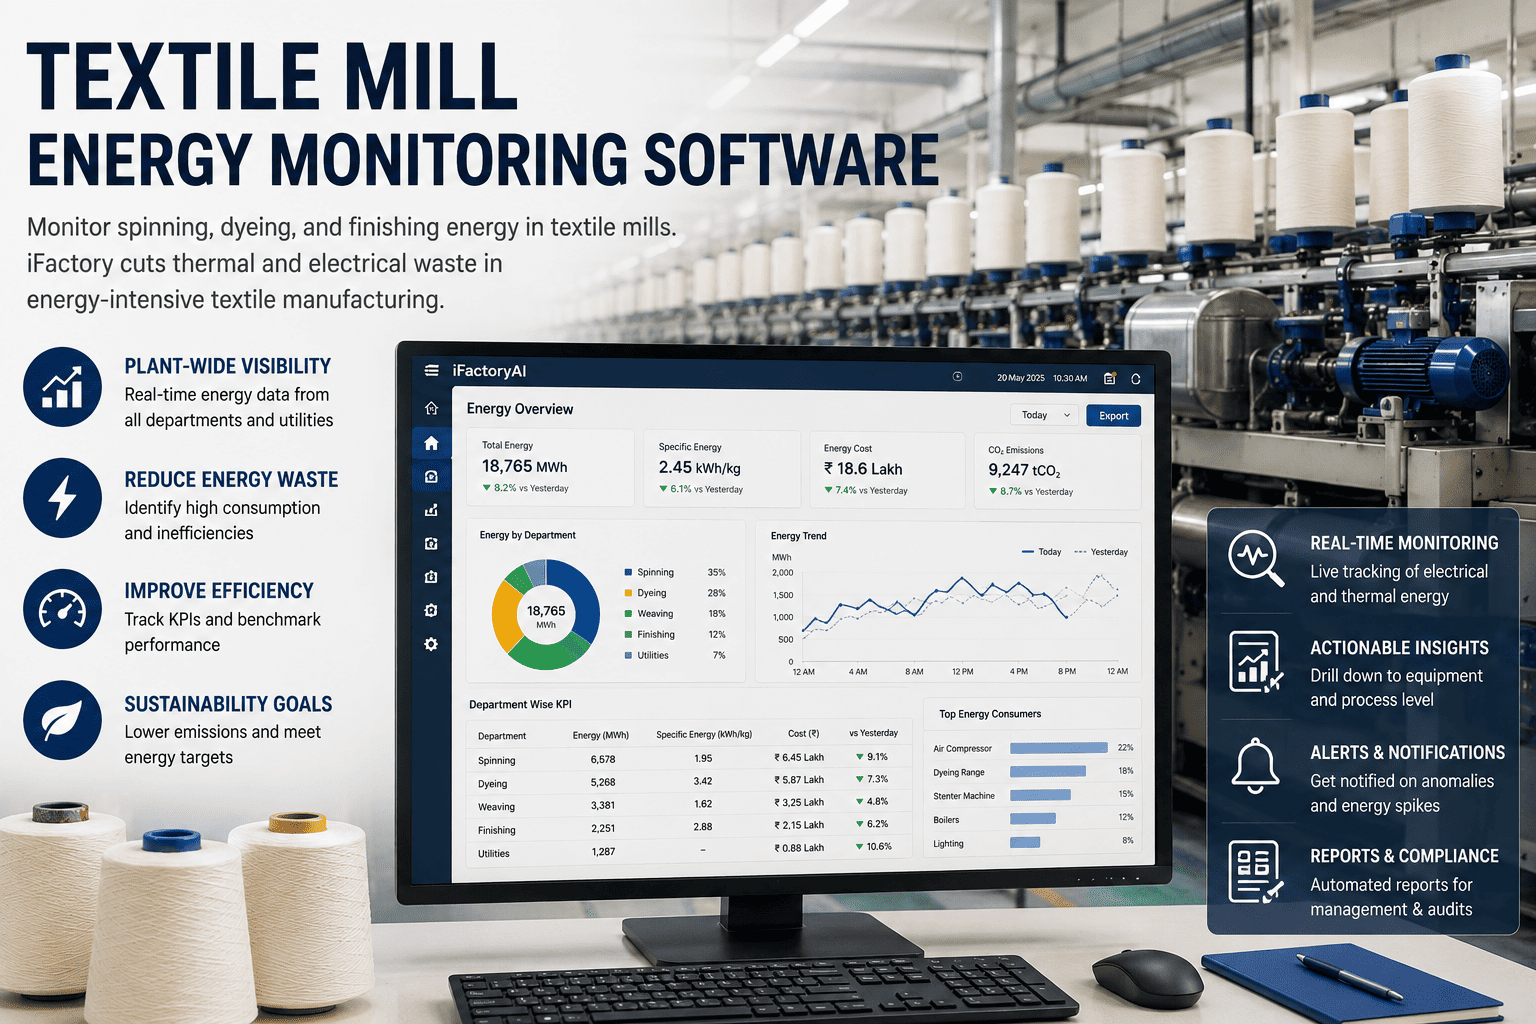
Most peak shaving deployments stall in the same place: the battery vendor handles inverter control, the SCADA team handles equipment data, the finance team handles tariffs—and no single platform connects them. iFactory's Energy Monitoring module sits between meters, BESS, production systems, and your utility bill in one workflow.
Real-Time Interval Analytics
Live 15-minute demand windows, rolling-peak projections, and tariff-aware threshold alerts on a single dashboard.
AI Forecasting Engine
Built-in LSTM and gradient-boosted models predict the next peak using your production schedule, weather, and historical patterns.
BESS & Generator Dispatch
Send dispatch commands to battery inverters, VFDs, and gensets via Modbus, OPC-UA, or REST—no separate SCADA needed.
DR Event Automation
Receive OpenADR or aggregator signals, execute pre-defined curtailment playbooks, and auto-generate settlement reports.
Tariff-Aware Optimization
Models your exact rate schedule including TOU, demand ratchets, coincident peak, and capacity tags so dispatch decisions reflect real bill impact.
Bill Reconciliation
Import utility bills automatically, match line items to dispatch events, and prove savings to finance with audit-ready reports.
See iFactory's Energy Monitoring in Action
One platform for interval analytics, AI forecasting, BESS dispatch, DR automation, and bill reconciliation—built for U.S. manufacturers serious about cutting demand charges.
Implementation Roadmap: From Audit to 40%
Plants that achieve sustained 40% reductions follow a predictable path. Skipping steps—especially the baseline audit—is the most common reason programs underperform. Here's the sequence that consistently works:
Weeks 1–2
Baseline Audit & Tariff Analysis
Pull 12 months of interval data. Identify peak-setting events, ratchet exposure, and capacity tag dependencies. Quantify the dollar value of each kW shaved.
Weeks 3–4
Submetering & Visibility
Install submeters on the top-10 load contributors. Connect data to the EMS. Often this alone surfaces 5–10% savings from anomaly detection before any storage is added.
Months 2–3
Load Shifting Rules
Automate non-critical loads—battery charging, HVAC pre-cooling, batch processes—around tariff windows. Zero-capex phase that proves out the platform.
Months 4–6
BESS Sizing & Install
Right-size lithium-iron-phosphate storage based on the audit's peak-duration analysis. Commission with the EMS handling dispatch.
Months 7–9
AI Forecasting Activation
Train models on 6+ months of post-install data. Move from threshold-triggered dispatch to predictive dispatch. This is where the curve bends from 25% to 40%+ reduction.
Month 10+
DR Enrollment & Revenue
Enroll the same assets in utility or ISO demand response programs. Stack capacity payments on top of peak-shaving savings without operational conflict.
Expert Review
"The storage economics story has shifted from 'install a battery' to 'run a flexible energy asset portfolio intelligently over time.' Coordinated flexible buildings could create $100 billion to $200 billion in power-system savings over two decades. The plants winning today aren't the ones with the biggest batteries—they're the ones with the smartest dispatch."
— Industry analysis on AI-driven energy storage, 2026
$11B
AI energy storage market by 2026
46%
Revenue uplift with AI forecasting
500%
PJM capacity rate increase 2025/26
Conclusion: The 40% Is Repeatable When You Build the System Right
Cutting industrial demand charges by 40% isn't a science project anymore—it's an engineering exercise with proven components: interval visibility, AI forecasting, battery storage, automated load shifting, and demand response enrollment. The plants that get there don't buy a single magic box. They build a coordinated system where every kW dispatched is tied back to a dollar on the utility bill. With PJM capacity rates climbing and grid stress growing, the cost of not running a peak shaving program is rising faster than the cost of starting one.
Ready to Cut Your Demand Charges by 40%?
iFactory's Energy Monitoring module ships with AI forecasting, BESS dispatch, DR automation, and bill reconciliation pre-integrated. Most U.S. manufacturers see measurable peak reduction in the first 60 days.
Frequently Asked Questions
What's the difference between peak shaving and demand response?
Peak shaving is something you do every billing cycle to lower your own monthly peak demand and reduce demand charges on your utility bill. Demand response is a utility or ISO program where you get paid to reduce load on specific event days when the grid is stressed. Most factories should run both—peak shaving daily for billing, demand response on event days for extra revenue.
How much can a factory realistically reduce demand charges?
Documented case studies show 28% to 60% demand charge reduction depending on tariff structure, load profile, and the strategies deployed. A 40% reduction is a realistic target for a mid-size U.S. plant that combines submetering, AI forecasting, battery storage, and automated load shifting. Plants with rigid production schedules tend to see savings on the lower end; plants with flexible batch processes can reach the upper end.
Do I need battery storage to do peak shaving?
No. You can capture 10–25% peak reduction with zero capex by automating load shifting—moving non-critical loads like chillers, compressors, EV chargers, and batch processes around your tariff windows. Battery storage is what gets you from that 25% baseline up to 40%+, because it lets you shave spikes that production scheduling alone can't avoid.
How does AI improve peak shaving over rule-based systems?
Rule-based systems react after a threshold is crossed—often too late to prevent the peak from being recorded by the utility meter. AI forecasting models predict the next 15–60 minutes of load using production schedule, weather, and historical patterns, so dispatch starts before the spike hits. In practice this is the difference between 25% and 40%+ demand charge reduction.
What's the typical payback period for a peak shaving program?
For a mid-size U.S. factory combining battery storage, EMS software, and demand response enrollment, payback typically lands between 3 and 5 years. Plants in high-demand-charge territories (California, New York, Massachusetts, PJM) and those that stack DR revenue on top of peak shaving see paybacks closer to 3 years. Software-only deployments using existing assets can pay back in under 12 months.