PM compliance looks different from the corporate office than it does at the plant. From the plant, a missed PM is a scheduling problem caused by a breakdown that pushed the week sideways. From the multi-site operations view, six plants averaging 74% PM compliance is a reliability program that is systematically underdelivering on its most basic commitment — that scheduled maintenance will actually happen. A compliance dashboard that gives regional and corporate operations teams the same visibility that each plant manager has locally is what turns PM compliance from a site-level scheduling issue into a cross-site performance standard. iFactory AI tracks PM compliance across every site, every asset class, and every maintenance team, making the gaps and their patterns visible to the right people at the right level. See how iFactory AI tracks PM compliance across your multi-site operation.
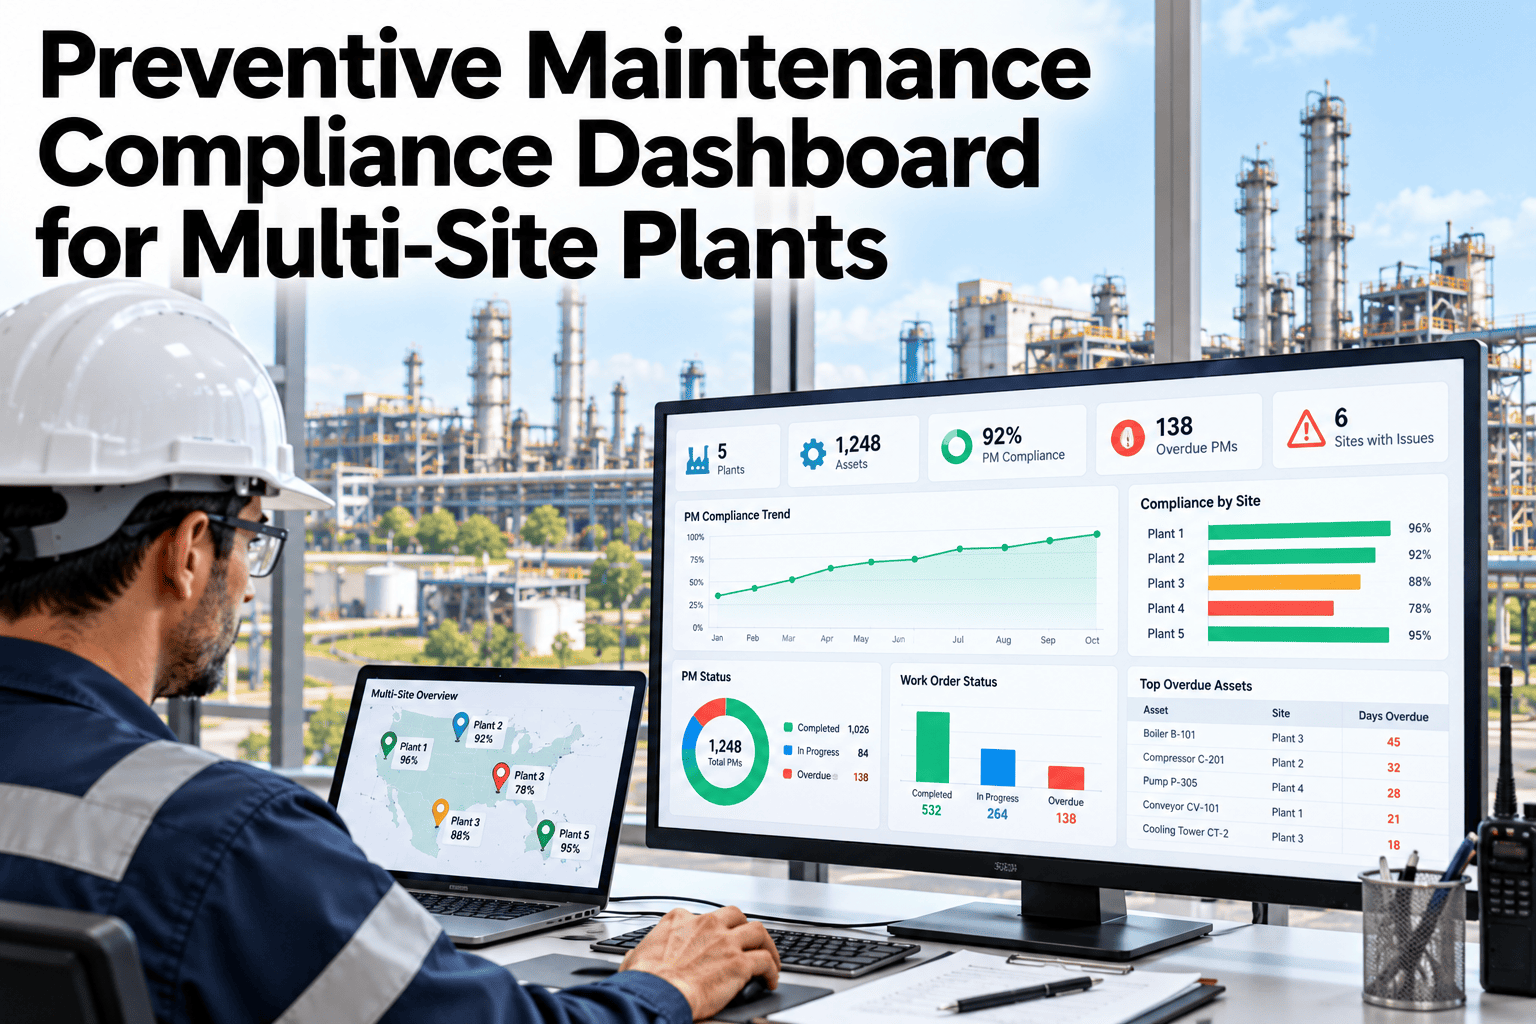
Preventive Maintenance Compliance Dashboard for Multi-Site Plants
Site-level compliance tracking, asset-class breakdown, overdue task visibility, and trend analysis — the dashboard that holds every plant to the same PM standard.
Why PM Compliance Varies Across Sites
Cross-site PM compliance variation is rarely random. The sites with consistently low compliance share recognizable patterns that the dashboard makes visible and that operations leadership can address.
The Multi-Site PM Compliance Dashboard
A useful multi-site PM compliance dashboard answers four questions across every site simultaneously: how compliant is each site, is it trending up or down, what asset class is driving the gap, and how many overdue tasks are outstanding.
From Compliance Visibility to Improvement Action
Compliance visibility without a structured response process produces dashboards that are reviewed and then ignored. The response process turns dashboard findings into defined actions with owners and deadlines.
Hold Every Site to the Same PM Standard
iFactory AI tracks PM compliance by site, asset class, and week across your entire plant portfolio — making declining trends and chronic underperformers visible before they become reliability failures. Book a session to see the multi-site dashboard for your operation.
Frequently Asked Questions
Can iFactory AI pull PM compliance data from different CMMS platforms across sites?
Yes. iFactory AI integrates with multiple CMMS platforms simultaneously, normalizing PM completion data from different systems into a consistent cross-site view. Sites running different CMMS tools contribute to the same compliance dashboard without requiring a single-CMMS mandate. Ask support about CMMS compatibility for your specific platforms.
What is a realistic PM compliance target for a multi-site industrial operation?
Best-practice operations target 90%+ PM compliance across all sites, with no site below 80% for more than two consecutive weeks. A portfolio average of 85–90% is achievable within twelve months for operations that start the program with active regional oversight and a structured response process for underperforming sites. Walk through compliance benchmarks for your industry in a session.
How do we distinguish between sites with genuine resource constraints and sites where compliance recording is unreliable?
Cross-reference PM compliance against unplanned failure rates for the same assets and the same period. A site with high reported PM compliance but also high unplanned failure rates on recently-PM'd assets has a recording quality problem. A site with low compliance and high unplanned failures has an execution problem. iFactory AI surfaces both patterns from the same data, so the regional team can direct the right intervention to each site.
Should PM compliance targets be the same across all sites regardless of their asset age and condition?
The compliance percentage target should be consistent — 90%+ is the standard — but the PM task frequency for aging assets will be higher, meaning the resource requirement to achieve the same compliance percentage is greater. Multi-site dashboards should normalize for PM schedule density alongside compliance percentage so regional managers can distinguish a site that is compliant on a lean schedule from one that is compliant on a demanding schedule.
Can the compliance dashboard be configured to alert regional managers automatically when a site drops below threshold?
Yes. iFactory AI supports configurable compliance threshold alerts that route automatically to regional operations managers when a site falls below the defined threshold for two or more consecutive weeks. The alert includes the site's compliance percentage, the trend direction, and the asset class with the largest overdue task backlog — so the regional manager has context for the conversation before contacting the site. See the alert configuration for multi-site compliance in a live demo.
Make PM Compliance Visible Across Every Site You Manage
iFactory AI tracks PM compliance by site, week, and asset class across your full plant portfolio — with automatic alerts when sites drift below target. Book a walkthrough to see the multi-site compliance dashboard built for your operation.