Every defective part that escapes your line is a process capability failure waiting in the data — and most manufacturing teams are still reacting to scrap reports instead of predicting them. Process capability indices — Cp, Cpk, Pp, and Ppk — are the four statistical metrics that separate plants which consistently ship to spec from plants that hope they do. Understanding what each index measures, when to use it, and what the number actually means on the shop floor is the difference between passing your next PPAP audit and explaining variation to your largest customer. This guide breaks down each index in plain language, shows the formulas and gives you the practical thresholds U.S. manufacturers use every day.
iFactory Quality Management Intelligence
Process Capability: Cp, Cpk, Pp, Ppk Made Simple
A practical guide for U.S. quality engineers — formulas, real-world thresholds, defect-rate translations, and the integration pattern that turns capability indices into live shop-floor decisions.
1.33
Minimum Cpk for most U.S. manufacturers
63 ppm
Defect rate at Cpk = 1.33 (4-sigma level)
3.4 ppm
Defect rate at Cpk = 2.0 (Six Sigma)
30+
Data points minimum for credible study
What Process Capability Actually Measures
Process capability answers one question: given how much your process naturally varies, how reliably will it produce parts inside the engineering spec? It requires two inputs — the specification limits set by design or the customer (USL and LSL), and the actual variation measured from production data (standard deviation). When the natural spread of your process is narrower than the spec window, you have headroom. When it isn't, you have scrap. Capability indices reduce that comparison to a single number every operator, engineer, and auditor can read at a glance.
The Four Indices: Cp, Cpk, Pp, Ppk Explained
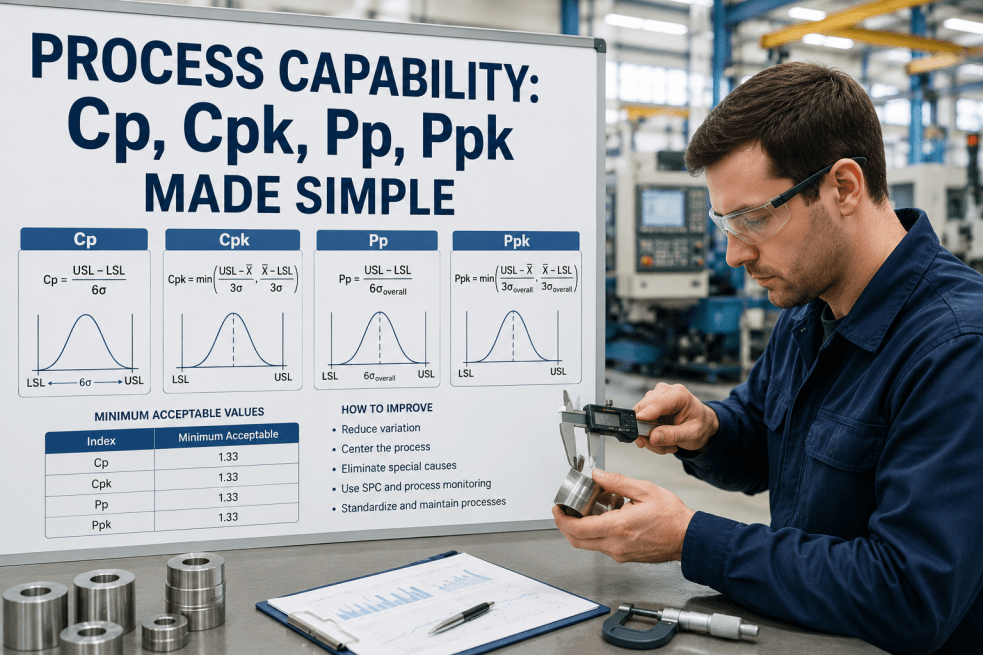
Cp and Cpk use the within-subgroup (short-term) standard deviation and describe what your process is capable of when stable. Pp and Ppk use the overall (long-term) standard deviation and describe how your process actually performed across the study window. The "k" versions (Cpk, Ppk) account for centering — they penalize a process whose mean drifts away from the middle of the spec. The non-k versions (Cp, Pp) assume perfect centering and only measure spread.
Cp — Potential Capability
Cp = (USL − LSL) / 6σwithin
Compares the spec width to the short-term process spread. Ignores where the mean actually sits. A high Cp with a low Cpk is the classic centering problem.
Cpk — Actual Capability
Cpk = min[(USL − μ) / 3σwithin, (μ − LSL) / 3σwithin]
Same short-term spread as Cp but accounts for centering. Cpk is always ≤ Cp. The gap between them tells you how much you can gain by re-centering alone.
Pp — Potential Performance
Pp = (USL − LSL) / 6σoverall
Same idea as Cp but uses the overall standard deviation, which captures shifts, drifts, and batch-to-batch variation across the whole study.
Ppk — Actual Performance
Ppk = min[(USL − μ) / 3σoverall, (μ − LSL) / 3σoverall]
The long-term reality check. If Cpk is high but Ppk is much lower, your process is not as stable as your control charts suggest.
Want to see how iFactory turns live SPC data into real-time Cpk dashboards across every workstation? Book a free 30-minute walkthrough with an iFactory quality engineer.
Cp vs Cpk vs Pp vs Ppk: The Comparison That Matters
The difference between the four indices is not academic — it determines whether your capability number reflects a controlled process or a noisy one. The table below summarizes how the indices differ along the two axes that actually matter: short-term vs long-term variation, and centering-aware vs centering-blind.
| Index | Time Window | Accounts for Centering? | Best Used When |
|---|
| Cp | Short-term (within-subgroup) | No | Process is stable and you want to know the potential capability ignoring mean drift |
| Cpk | Short-term (within-subgroup) | Yes | Process is in statistical control — the standard index for ongoing production reporting |
| Pp | Long-term (overall) | No | New process, PPAP submission, or initial study where stability isn't proven |
| Ppk | Long-term (overall) | Yes | Reporting actual performance over weeks or months — what the customer experienced |
What Capability Numbers Actually Mean: Defect Rates and Sigma Levels
A Cpk number on its own is abstract. Translated into defects per million opportunities (DPMO) and sigma level, it becomes a number leadership and customers immediately understand. The thresholds below assume a normal distribution and a centered process.
| Cpk Value | Sigma Level | Defects per Million | Interpretation |
|---|
| < 1.00 | < 3σ | 66,800+ DPMO | Not capable — process is producing out-of-spec parts; corrective action required immediately |
| 1.00 | 3σ | ~2,700 DPMO | Barely capable — any drift will produce defects; not acceptable for most customer programs |
| 1.33 | 4σ | ~63 DPMO | Capable — standard minimum for automotive, electronics, and general manufacturing in the U.S. |
| 1.67 | 5σ | ~0.6 DPMO | Excellent — required for safety-critical automotive parts and aerospace components |
| 2.00 | 6σ | ~3.4 DPMO | World-class — Six Sigma benchmark; common target for medical device critical features |
A Worked Example: Calculating Cpk on the Floor
Imagine a CNC turning operation with a shaft diameter specification of 25.00 mm ± 0.10 mm. The Upper Specification Limit (USL) is 25.10 mm, the Lower Specification Limit (LSL) is 24.90 mm. After collecting 50 consecutive measurements, the process mean (μ) is 25.04 mm and the short-term standard deviation (σ) is 0.025 mm. Cp is (25.10 − 24.90) / (6 × 0.025) = 0.20 / 0.15 = 1.33. So far, capable. But Cpk takes the minimum of two distances: (25.10 − 25.04) / (3 × 0.025) = 0.80 and (25.04 − 24.90) / (3 × 0.025) = 1.87. Cpk = 0.80. The process has enough spread room — Cp is fine — but the mean has drifted toward the upper limit, and the part is no longer capable. Recentering the mean to 25.00 mm without changing variation would bring Cpk up to 1.33.
1
Verify Statistical Control
Confirm the process is stable using control charts before calculating Cp or Cpk. An out-of-control process produces meaningless capability numbers.
2
Collect Sufficient Data
Use a minimum of 25–30 consecutive subgroups or 100+ individual measurements for credible estimates. Smaller samples inflate or deflate Cpk unpredictably.
3
Check Normality
Standard Cp/Cpk formulas assume a normal distribution. For non-normal data, use a transformation or non-normal capability methods.
4
Calculate Both Cp and Cpk
Reporting only one hides the centering story. A large Cp − Cpk gap means your improvement priority is centering, not variation reduction.
5
Track Over Time
A capability study is a snapshot. Live Cpk monitoring in a digital quality system surfaces drift before it becomes scrap.
Common Mistakes That Invalidate Capability Studies
Capability indices are powerful only when calculated on data that meets their underlying assumptions. The most expensive mistakes in U.S. manufacturing quality programs come from misreading the number, not the math itself.
Mistakes to Avoid
Calculating Cpk on an unstable process — if the control chart shows special-cause variation, the resulting Cpk is mathematically valid but practically meaningless
Using too few data points — Cpk from 10 measurements can swing 30%+ on the next sample; aim for 30 minimum, 100 ideal
Ignoring distribution shape — flatness, position, and runout are typically non-normal; standard formulas overstate capability
Reporting only Cpk — without Cp, the customer cannot tell if you have a spread problem, a centering problem, or both
Mixing short-term and long-term data — calling Cpk what is actually Ppk inflates the headline number and misleads PPAP reviewers
What Good Looks Like
Stable process verified first — control charts in statistical control across at least 20 subgroups before capability is calculated
Adequate sample size — 30 minimum for preliminary, 100+ for formal capability and PPAP submission requirements
Normality tested or transformed — Anderson-Darling or similar, with documented transformation method if non-normal
Cp and Cpk reported together — with the gap explicitly called out as a centering opportunity or a spread opportunity
Short-term vs long-term clearly labeled — Cpk vs Ppk reported separately so reviewers see both stability and capability
Tired of capability studies that take days to compile manually?
iFactory's Quality Management module calculates Cp, Cpk, Pp, and Ppk in real time from live PLC and gauge data — no Excel, no delay, no human error.
Improving a Process That Misses Its Cpk Target
If your Cpk falls short, the gap between Cp and Cpk tells you where to start. A small gap (Cp ≈ Cpk) means the process is centered but the spread is too wide — focus on variation reduction. A large gap (Cp >> Cpk) means the spread is acceptable but the mean is drifting — focus on recentering. The improvement levers below address both failure modes systematically.
Reduce Variation
Tighten measurement system error first (MSA), then address machine, material, method, and operator sources. Statistical Process Control surfaces special causes; Design of Experiments (DOE) optimizes process parameters.
Recenter the Mean
Adjust setpoints, fixturing, or tool offsets so the process mean sits on nominal. Automated offset correction from live measurement data eliminates operator-dependent drift between shifts.
Tighten Control Limits
Move from reactive inspection to predictive SPC. Real-time control charts catch drift inside the spec window before it produces a defect, preserving capability over time.
Capability-Based PM
Trigger preventive maintenance from declining Cpk trends, not calendar dates. Bearings, fixtures, and tooling almost always show capability degradation weeks before they produce out-of-spec parts.
Expert Review: From Capability Numbers to Capability Culture
Expert Review
Why most U.S. plants calculate Cpk but never improve it
"The most common failure pattern I see in U.S. manufacturing quality programs is what I call Cpk theater — the number gets calculated for the customer PPAP, filed, and never looked at again until the next audit. That is not a capability program. That is documentation."
"A real capability program has three properties. First, capability is measured continuously from live data, not retrospectively from sampled Excel files. Second, every operator on the floor knows what their station's current Cpk is and what the trend looks like — not just the quality engineer. Third, declining capability triggers action before it produces a customer reject, not after."
"When U.S. plants move from quarterly capability studies to live Cpk dashboards integrated with their MES and quality systems, two things happen quickly. Scrap drops because operators see drift in real time. And PPAP submissions accelerate because the data is already in the system, already validated, already trended."
"The capability indices themselves are not the goal. The goal is a process that is so well understood and so tightly controlled that the indices barely move. When Cpk stops being a number you chase and starts being a number you defend, you have arrived."
iFactory Quality Management: Capability Indices as a Live Operating Metric
iFactory's Quality Management module ingests measurement data from CMMs, vision systems, in-process gauges, and operator entries — then calculates Cp, Cpk, Pp, and Ppk continuously against your engineering specs. Live capability dashboards on the shop floor show each operator their station's current capability, the trend, and the distance to threshold. Out-of-control conditions trigger alerts before parts go out of spec, and PPAP-ready capability reports generate in seconds, not days.
Real-time Cp/Cpk/Pp/Ppk: Live calculation from streaming measurement data — no batch exports, no spreadsheet macros, no waiting for the weekly quality meeting to know your capability number
Automatic stability checks: Built-in control chart logic verifies statistical control before reporting capability — your Cpk numbers are always calculated on stable data and never misleading
Non-normal capability: Distribution fitting and Box-Cox transformation for flatness, position, runout, and other naturally non-normal characteristics common in machining and molding
PPAP-ready reports: Capability studies, histograms, control charts, and capability summaries export in customer-specific formats — automotive, aerospace, medical device, and electronics standards supported
Operator-floor dashboards: Every station shows current Cpk, trend, and threshold distance in plain language — empowering operators to act on drift before it becomes scrap on the next inspection
Predictive capability alerts: Trend-based warnings fire when Cpk is declining toward threshold — connecting capability degradation to preventive maintenance, tool changes, and process adjustments automatically
Frequently Asked Questions
What is the difference between Cpk and Ppk in simple terms?+
Cpk uses short-term, within-subgroup variation and tells you what your process is capable of when it is running stably. Ppk uses long-term, overall variation and tells you what your process actually delivered across the full study period including shifts and drifts. If your process is truly stable, Cpk and Ppk will be very close. A large gap means there are shifts or special causes happening between subgroups that your short-term data does not capture.
Is Cpk of 1.33 good enough for U.S. automotive customers?+
Cpk ≥ 1.33 is the standard minimum for general automotive components and most electronics. For safety-critical automotive parts — airbags, braking, steering — customers typically require Cpk ≥ 1.67. Aerospace and medical device critical features often require Cpk ≥ 2.0. Always check the specific PPAP requirement in your customer contract; the threshold is part of the agreement, not a universal default.
How many data points do I need for a credible Cpk calculation?+
For a preliminary capability assessment, 25 to 30 consecutive measurements is the practical minimum. For a formal capability study or PPAP submission, 100 or more measurements collected across multiple shifts, operators, and material lots is strongly recommended. Smaller samples produce Cpk values that swing significantly with the next sample, which is why small-batch capability claims are often rejected by auditors.
Can Cpk be calculated for non-normal data?+
The standard Cpk formula assumes normality. For non-normal distributions — common with flatness, position, runout, and one-sided characteristics — you have three options: transform the data (Box-Cox or similar), use a non-normal capability method based on percentiles (the ISO 21747 approach), or fit a specific distribution and calculate capability from its percentiles. Modern quality software handles this automatically; the key is to never apply normal-distribution Cpk to data that clearly is not normal.
Why is my Cp much higher than my Cpk, and what should I do?+
A large gap between Cp and Cpk means your process spread is acceptable but the mean has drifted off-center, closer to one specification limit. The fix is recentering, not variation reduction — adjust tool offsets, setpoints, fixturing, or operator standard work to move the mean back to nominal. Recentering is almost always faster and cheaper than reducing variation, so when Cp − Cpk is large, take the centering win first before investing in machine upgrades.
Conclusion: Capability as a Competitive Advantage
Cp, Cpk, Pp, and Ppk are not just audit metrics — they are the language in which capable manufacturers describe what their processes can and cannot do. The plants winning long-term contracts in 2026 are the ones whose capability indices are live, visible, and acted on every shift, not calculated quarterly and filed in a binder. Master the four indices, calculate them on stable data with adequate sample size, and translate them into the defect-rate language your customers actually care about. Then use a modern quality platform to make capability a live operating metric rather than a retrospective report — and capability stops being a number you defend at audits and starts being a number that wins your next program.
iFactory Quality Management
Turn Cp, Cpk, Pp, and Ppk Into Live Shop-Floor Decisions
iFactory calculates capability indices in real time from your gauges, CMMs, and vision systems — surfaces drift before it becomes scrap, and generates PPAP-ready reports in seconds. No spreadsheets. No delay. No audit anxiety.
Live
Real-time Cpk dashboards on every workstation
100%
PPAP-ready capability reports automated
30+
Measurement systems integrated natively
Zero
Spreadsheet errors in capability calculations