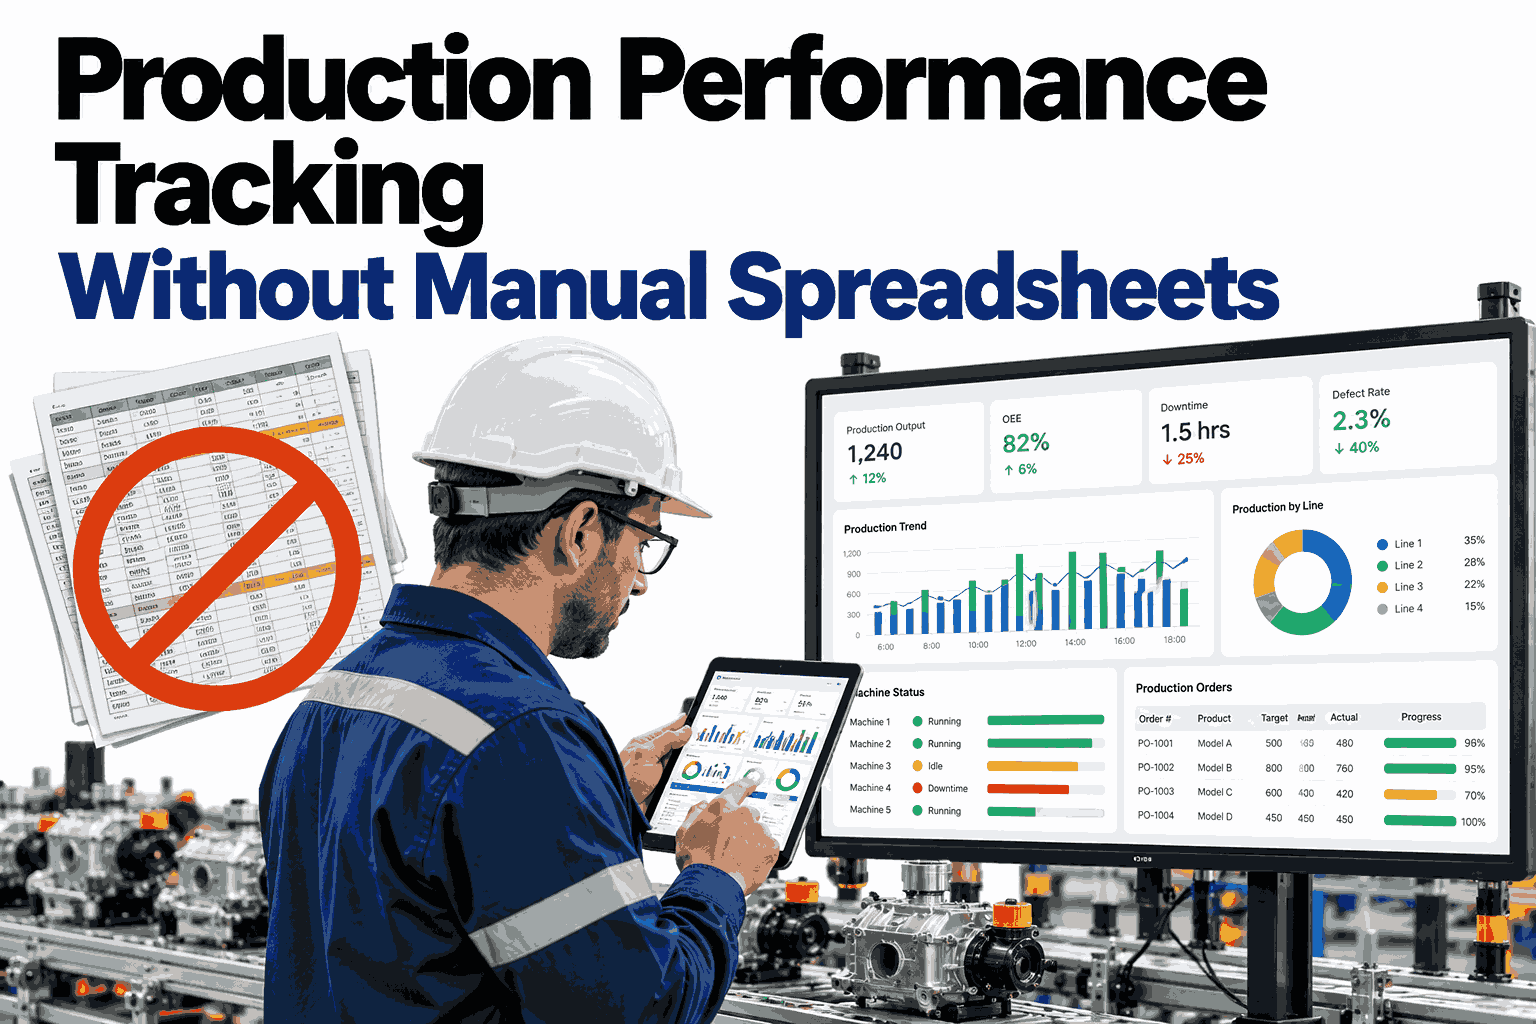
Most plants still review performance on Monday, using numbers retyped from shift sheets into a workbook that only one person fully understands. By the time a figure reaches the meeting, the line has already lost another week of hours to the same avoidable problem. Production performance tracking without manual spreadsheets captures output, stops and rejects at the machine and shows them while the shift can still change. To see how that looks on your own lines, request a live tracking walkthrough with the iFactory AI team.
Replace the Monday Spreadsheet With Production Numbers You Can Act On Today
iFactory AI collects output, downtime and quality data directly from your equipment, so supervisors see the real state of every line instead of a summary written hours earlier.
Six Places a Production Spreadsheet Quietly Goes Wrong
A spreadsheet is a flexible tool, which is exactly why it becomes risky as production grows, and most plants adopted theirs for good reasons when output was simpler. Every new line, shift and product adds another tab, another formula and another person who must remember how it all connects, until the workbook turns into a system nobody designed but everyone relies on.
The mock sheet above shows three ordinary faults: a misplaced comma that multiplies output by ten, a stop time nobody recorded, and a reject count rounded from memory. None of these are careless acts. They are what happens when data passes through human hands several times before it becomes a number on a report.
Taken together, these faults do not just produce wrong numbers. They produce numbers that people stop trusting, and once a team stops trusting its own data, meetings turn into arguments about the figures instead of decisions about the line.
The Real Cost Is Not the Error, It Is the Age of the Number
Even a perfectly typed spreadsheet arrives late. A problem that starts at ten in the morning may not appear in any report until the following week, and by then the cause has been forgotten, the operator has changed shift and the same stop has repeated many more times.
Time to visibility is the quiet variable behind most performance gaps, and it is also the easiest one to improve once data no longer waits for a person to type it. A supervisor who learns about a rising stop pattern within minutes can move a technician, adjust a changeover or call maintenance before the shift ends. A supervisor who learns about it next week can only write it into an action list.
This is why tracking without spreadsheets is not mainly about saving clerical hours, although it does that too. It is about moving performance information from a historical record to an operating tool that people use during the shift, when action is still cheap.
Four Numbers That Replace a Dozen Spreadsheet Tabs
Most workbooks grow by adding columns. Good tracking does the opposite, because a handful of well-defined measures explain most of what happens on a production line. Overall equipment effectiveness, usually shortened to OEE, combines three of them into one score.
Availability measures how much of the planned time the machine actually ran. Performance compares real speed with the ideal speed, and quality counts the share of good units out of everything produced. Multiplying them shows how small losses stack, since three apparently healthy percentages still leave roughly a quarter of capacity unused.
Many plants cite 85 percent OEE as a world-class reference, while average plants often sit well below it. Treat any benchmark as a conversation starter and set your own target by product and line, because a fair target for a changeover-heavy line differs from one for a dedicated line.
The Spreadsheet Routine Compared With Automated Tracking
The difference shows up in every small task a plant performs each shift. Here is how the common routines change when data stops depending on typing.
| Routine task | With spreadsheets | With automated tracking | What changes |
|---|---|---|---|
| Counting output | Operator tallies units on paper and a clerk enters the total later | Counts come from the machine signal as units are produced | Numbers are available during the shift |
| Recording stops | Start and end times are estimated and the reason is written from memory | Stops are timed automatically and operators select a reason in seconds | Short stops stop disappearing |
| Calculating OEE | Formulas in a workbook that vary between lines | One standard calculation applied to every machine | Lines can be compared fairly |
| Shift handover | Verbal summary plus a paper log | Shared live view of the last hours and open issues | The next shift starts informed |
| Weekly review | Hours spent building charts before the meeting | Charts are ready and the meeting starts with decisions | Time moves from preparing to acting |
| Audit and traceability | Search through files and folders for the right sheet | Searchable history by line, shift and product | Questions are answered in minutes |
Notice that the table never says people become unnecessary. Operators and supervisors still decide what a stop means and what to do about it, and the software simply gives them accurate evidence without the clerical step in between.
See Your Own Line Tracked Without a Single Spreadsheet
Share how your plant records output and stops today, and see how iFactory AI would capture the same information automatically for your machines and shifts.
From Machine Signal to Supervisor Screen in Five Steps
Automated tracking is a simple chain. Each stage cleans up and adds meaning to the data, so that what reaches the screen is something a supervisor can act on without interpretation. Because the same rules run on every line, a result on one line means the same thing as a result on another, which is rarely true of workbooks that each team has adapted in its own way.
The third step matters most and is the one spreadsheets handle worst. A number without context, such as forty minutes of downtime, cannot be acted on, while the same number tied to a specific machine, product and cause points straight to a fix.
What One Shift Looks Like When the Board Updates Itself
Picture a line with an 85 percent hourly target. In a spreadsheet world, the dip at midday would surface the next morning. On a live board, it appears while the shift is still running.
The two low bars show a stoppage window around nine and ten. With live tracking, the supervisor sees the dip at the first low hour, checks the reason code and calls maintenance, so the recovery in the next bars is a result of action rather than luck.
Over a month, those small same-day recoveries add up to more output from the same equipment and the same people, without any new machine being purchased. They also build a habit: when supervisors see that a quick reaction visibly changes the next hour, they start checking the board by choice rather than by instruction.
The Six Big Losses a Spreadsheet Tends to Hide
OEE work usually groups waste into six categories. Spreadsheets can hold these columns, but only if somebody records each stop and slow period in the right place, which rarely happens at line speed.
Minor stops and reduced speed are the classic blind spots. A thirty-second jam does not feel worth writing down, and a machine running slightly under its rated speed does not look broken, yet both repeat all day and can quietly outweigh a single large breakdown.
The bars are an example of a pattern many plants discover, not a universal measurement. Automatic capture matters here because a machine does not forget a short stop, so the real size of each loss category finally appears. Teams that want to see this on their own equipment can review a loss breakdown for your lines with the iFactory team.
A Four-Step Path Away From Manual Tracking
Few plants switch everything at once, and they do not need to. A staged path lets the team trust the new numbers before the old routine is retired.
The parallel run in step two is the most important habit. It turns a software decision into a team decision, because operators and managers see with their own eyes where the live numbers differ from the sheet, and why.
Four Reasons Teams Delay, and What Usually Turns Out to Be True
Hesitation is normal and usually reasonable. These are the concerns plants raise most often, set against what teams commonly find once they start.
Each of these concerns deserves a real answer on your own floor, which is why a short session with your actual machines tells you more than any general claim can. Bring one product, one line and one recent bad week, and the conversation quickly becomes specific instead of theoretical.
A Checklist Before You Retire the Workbook
A little preparation keeps the pilot focused and the results easy to read for everyone involved.
If you cannot tick every box yet, that is normal. Most of these items are settled during the first working session, and a good partner helps build the stop reason list and cycle time table instead of expecting them ready on day one.
One Live Board, Four Different Questions Answered
A tracking system earns its place when each person on the floor gets a useful answer from the same data. Spreadsheets rarely manage this, because the workbook is built for whoever compiles it rather than for the people who need it during the shift.
Because everyone works from the same figures, the weekly review changes character. Instead of debating whose numbers are right, the team spends its time agreeing on which loss to attack first and who owns the action.
A Simple Way to Estimate What Waiting Is Costing You
You do not need precise data to see why this matters. A rough calculation using hidden minutes, the ones that never reach the spreadsheet, is enough to start the conversation inside your plant.
These figures are an example only, so replace them with your own estimates. Even so, the pattern is common: small losses that feel too minor to record are multiplied across shifts and days until they equal a full working week of lost output on a single line.
Plants often start by running this estimate for their two or three most important lines. If the total looks larger than expected, that is a sign the hidden minutes are real and worth measuring accurately.
What Production Teams Ask Before Leaving Spreadsheets Behind
Give Your Team Live Production Numbers Instead of Last Week's Spreadsheet
Book a session with iFactory AI to review how your lines record output, stops and rejects today, and see how automatic tracking and OEE reporting can fit your plant.