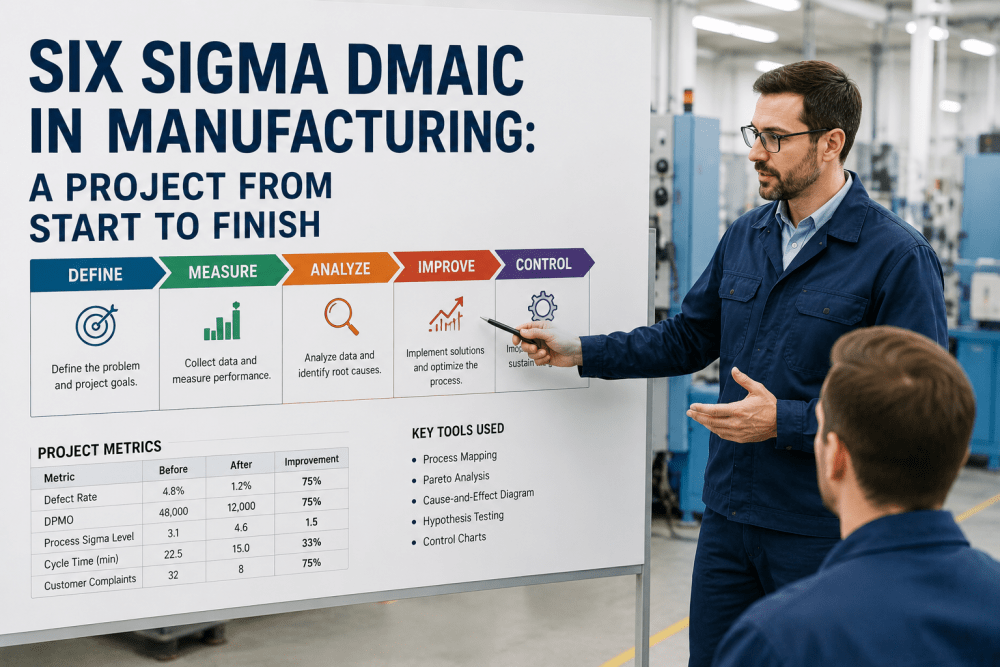
In modern U.S. manufacturing, the gap between profitable and struggling operations often comes down to one factor: process consistency. Six Sigma DMAIC — Define, Measure, Analyze, Improve, Control — is the structured methodology that turns scattered improvement efforts into measurable financial outcomes. From automotive plants in Michigan to pharmaceutical lines in New Jersey, DMAIC remains the operating discipline behind sub-3.4 defects-per-million-opportunities performance. This guide walks you through a complete DMAIC project from charter to control plan, with the tools, statistical methods and digital infrastructure that make modern Six Sigma work at scale.
Run Your Next DMAIC Project on a Connected Manufacturing Platform
iFactory AI unifies SPC, quality control, OEE analytics, and CAPA workflows — giving your Six Sigma teams the live shop-floor data they need to Measure, Analyze, and Control in real time.
Why DMAIC Still Wins in U.S. Manufacturing
DMAIC isn't theory — it's a sequence of decision gates that prevent improvement projects from becoming expensive guesswork. Each phase produces a deliverable that the next phase depends on, which is why high-performing plants treat DMAIC as a discipline, not a toolkit. The methodology scales from a single cell-level defect reduction to enterprise-wide cost-of-poor-quality (COPQ) initiatives.
Define
- Project charter with scope and timeline
- Voice of Customer (VOC) and CTQ tree
- SIPOC diagram for process boundaries
- Financial impact baseline
Measure
- Data collection plan and MSA
- Process capability (Cp, Cpk) baseline
- Current sigma level calculation
- Operational definitions locked
Analyze
- Root cause via Fishbone, 5-Why
- Hypothesis testing and regression
- Pareto and value stream analysis
- Validated drivers of defects
Improve
- DOE (Design of Experiments)
- Pilot runs and failure mode analysis
- Solution selection matrix
- Implementation roadmap
Control
- Statistical Process Control (SPC) charts
- Updated SOPs and visual work instructions
- Response plan with escalation triggers
- Handoff to process owner with KPI dashboard
Why the Control phase matters most: The Control phase is where most projects fail — not because gains weren't real, but because they weren't institutionalized. A proper control plan locks in SPC limits, response plans, training matrices, and digital dashboards that detect drift before it becomes a defect. This is where platforms like iFactory AI replace paper-based control charts with live monitoring.
A Real DMAIC Project: Reducing Weld Defects on a Tier-1 Auto Line
To make this concrete, let's walk through a representative Black Belt project: a Tier-1 automotive supplier was running 4,200 DPMO on a robotic weld cell, costing roughly $380,000 annually in rework and scrap. The team chartered a 16-week DMAIC initiative. Here is how each phase unfolded — and what tools made the difference.
Define — Weeks 1 to 2
- Problem statement: weld porosity defects on left-hand control arm at 0.42% reject rate
- Goal statement: reduce defect rate to under 0.05% within 16 weeks
- SIPOC built; project charter signed by VP Operations and Quality Director
- Financial sponsor confirmed projected $310K annualized savings
Measure — Weeks 3 to 5
- Gage R&R study on porosity inspection — 18% study variation, acceptable
- Baseline Cpk = 0.71 across 30 days of production data
- Current sigma level: 2.3 — significant room for improvement
- Data pipeline established from PLC and vision-inspection system into central database
Analyze — Weeks 6 to 9
- Fishbone identified 14 candidate causes across Man, Method, Machine, Material
- Multi-vari study isolated shielding gas flow rate and torch angle as primary suspects
- Regression analysis confirmed R² = 0.78 between gas flow and porosity rate
- Pareto: 82% of defects occurred during shift handover transitions
Improve — Weeks 10 to 13
- 2-factor DOE on gas flow (18, 22, 26 CFH) and torch angle (12°, 15°, 18°)
- Optimal settings: 22 CFH, 15° — confirmed via 500-part pilot run
- Shift handover SOP redesigned with mandatory parameter verification
- Pilot achieved 0.04% defect rate — exceeded target
Control — Weeks 14 to 16
- Real-time SPC charts deployed on shop-floor terminals via iFactory AI
- Automated alerts wired to maintenance and quality teams on UCL/LCL breach
- Updated control plan, FMEA, and operator training matrix
- Project handed off to process owner; 90-day audit confirmed sustained gains
The DMAIC Toolbox: What Belt Holders Actually Use
Each DMAIC phase has a signature set of tools. The mark of a mature Six Sigma program isn't using every tool on every project — it's choosing the right tool for the data and the question. Below is the operating reference most Black Belt projects rely on across U.S. manufacturing sectors.
| Phase | Primary Tools | Statistical Methods | Typical Deliverable |
|---|---|---|---|
| Define | Project Charter, SIPOC, VOC, CTQ Tree | Pareto on historical defect data | Signed Charter |
| Measure | Data Collection Plan, MSA, Process Map | Gage R&R, Cp/Cpk, baseline sigma | Validated Baseline |
| Analyze | Fishbone, 5-Why, FMEA, Multi-Vari | Hypothesis testing, ANOVA, regression | Validated Root Causes |
| Improve | DOE, Solution Matrix, Pilot Plan | Full / fractional factorial, response surface | Verified Solution |
| Control | SPC, Control Plan, Updated SOP | I-MR, Xbar-R, p-chart, capability re-study | Live Control System |
Green Belt vs Black Belt: Project Scope and Responsibility
Six Sigma certification levels are not about prestige — they map directly to project complexity, statistical depth, and financial scope. Understanding the right belt for the right project protects both the practitioner and the company's return on improvement spend.
Yellow Belt
- Project team member, not leader
- Local-cell improvements, <$20K scope
- Basic tools: 5S, visual management, simple data collection
- Typically 1–2 days of training
Green Belt
- Leads departmental DMAIC projects part-time
- $50K–$150K typical financial impact per project
- Comfortable with hypothesis testing, basic DOE
- 2–4 weeks training plus certification project
Black Belt
- Full-time project leader, mentors Green Belts
- $250K+ projects, cross-functional scope
- Advanced DOE, regression, multivariate analysis
- 4–6 weeks training, 1–2 certified projects required
Expert Perspective: Why Modern DMAIC Needs a Digital Backbone
DMAIC was developed in the 1980s when data collection meant clipboards and Minitab runs were a weekly event. The methodology is sound — but the data infrastructure of that era is gone. Today's high-performing Six Sigma programs operate on continuous, streaming shop-floor data, which fundamentally changes the speed and quality of every phase.
"The single biggest gap I see in mid-market U.S. manufacturers running Six Sigma is the disconnect between the DMAIC framework and the data systems beneath it. Teams spend 40 to 60 percent of project time hunting for, cleaning, and validating data that should be flowing automatically from machines, MES, and quality systems. Once that pipeline exists, project cycle times routinely drop from 16 weeks to 8 weeks, and the Control phase actually holds."
Live PLC and sensor data eliminates the 2–3 week manual baseline study. Cpk calculations run continuously, not as a snapshot.
Multi-variate analysis on millions of data points reveals interactions that sample-based studies miss entirely.
Automated SPC alerts prevent project gain erosion. Manual control charts fail within 6 months in 70% of plants.
Equip Your Belt Holders with a Modern DMAIC Platform
iFactory AI provides the connected quality, SPC, and analytics infrastructure that turns Six Sigma projects from quarterly initiatives into a continuous improvement engine. See how leading U.S. manufacturers run faster DMAIC cycles with real shop-floor data.
Closing the Loop: DMAIC as an Operating Discipline
Six Sigma DMAIC isn't a one-time methodology — it's an operating discipline that defines how your plant learns from variation. The framework is mature, the tools are well-documented, and the financial case is proven. What separates plants that capture value from those that don't is the infrastructure: a connected data platform that lets your Green and Black Belts spend their time analyzing and improving, not chasing spreadsheets. When DMAIC sits on top of a modern manufacturing platform, every project becomes faster, every solution sticks longer, and every dollar of improvement is visible to leadership. That's how American manufacturers turn quality from a cost center into a competitive moat. Ready to see how it works in your facility? Book a Demo.
Six Sigma DMAIC — Frequently Asked Questions
How long does a typical DMAIC project take in a U.S. manufacturing plant?
A standard Green Belt project runs 12 to 16 weeks; Black Belt projects with broader scope typically run 16 to 24 weeks. With a connected data platform like iFactory AI providing live shop-floor data, plants routinely compress Measure and Analyze phases — bringing total project duration down to 8 to 12 weeks without sacrificing statistical rigor. Book a Demo to see how this compression works in practice.
What's the difference between DMAIC and DMADV?
DMAIC (Define, Measure, Analyze, Improve, Control) applies to existing processes that need optimization. DMADV (Define, Measure, Analyze, Design, Verify) is Design for Six Sigma — used when creating a new process or product from scratch. Most plant-floor improvement work uses DMAIC; new product introduction (NPI) and new line commissioning typically use DMADV.
Do I need expensive statistical software to run DMAIC projects?
Not necessarily. Minitab and JMP remain industry standards for statistical analysis, but modern manufacturing platforms now embed SPC, capability analysis, and basic hypothesis testing directly into the production dashboard. This means Green Belts can run capability studies and control charts on live data without exporting to a separate tool — closing the loop between analysis and action.
Why do so many Six Sigma projects fail in the Control phase?
The most common failure mode is reverting to paper-based control charts and manual SPC. Once the Black Belt moves to the next project, no one is actively watching the limits. The gains erode within 3–6 months. Plants that sustain DMAIC results almost always have a digital control system that alerts the process owner automatically on UCL/LCL breaches, expired training, and control plan deviations. Book a Demo to explore automated Control phase tooling.
Can DMAIC work in low-volume, high-mix manufacturing?
Yes, but the data strategy differs. In high-volume operations, you have large sample sizes and traditional SPC tools work cleanly. In low-volume, high-mix environments, teams use short-run SPC, individual-moving-range charts, and stratification by part family. The DMAIC framework remains identical — only the statistical tools and sampling plans adapt to the production reality.
Turn Six Sigma Into a Continuous Improvement Engine
Join U.S. manufacturers using iFactory AI to compress DMAIC cycle times, sustain Control phase gains, and give every belt holder live access to shop-floor quality data.

.png)