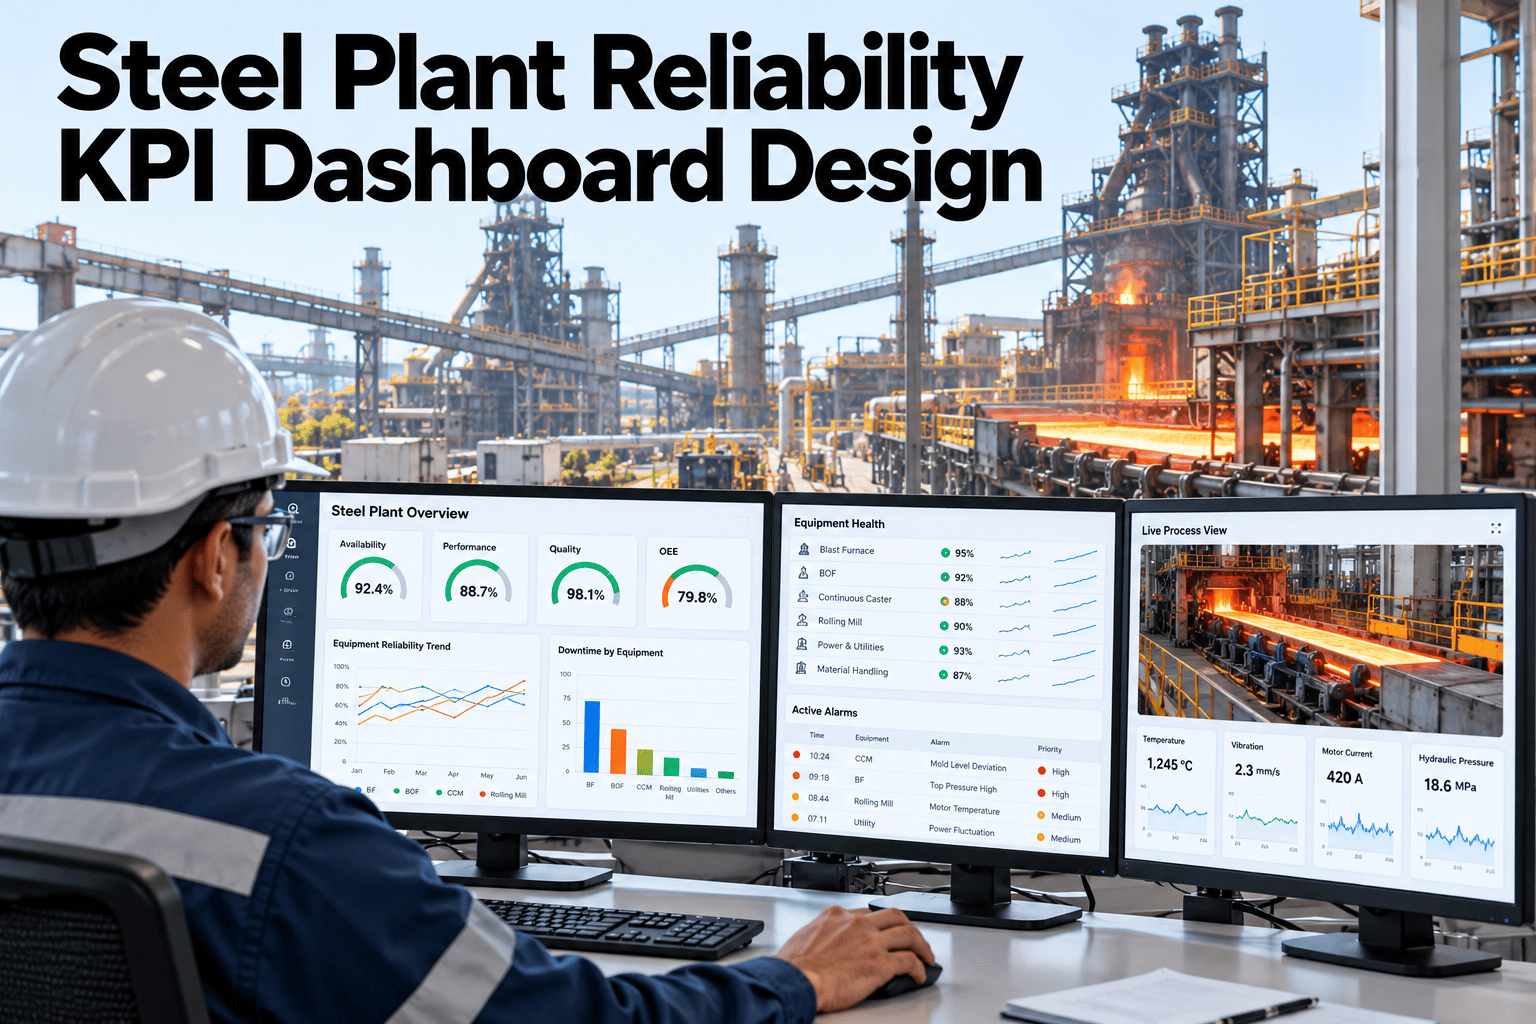
Reliability in a steel plant is not a maintenance department metric — it is a business performance metric. When a blast furnace blower trips or a hot strip mill bearing fails, the impact registers immediately in production loss, energy waste, refractory damage, and delayed customer orders. A reliability KPI dashboard that only looks backward — reporting last month's MTBF and maintenance cost — does not give plant leadership the advance signals needed to prevent the next failure. The right dashboard combines leading and lagging indicators, surfaces asset health trends in time to act, and links reliability performance directly to production output. See how iFactory AI structures the reliability dashboard for steel plants.
iFactory AI · Steel Plant Reliability
The Reliability KPI Dashboard for Steel Plant Leadership
A design checklist for steel plant reliability dashboards — from the KPIs that go on the executive view to the asset health scores that guide the maintenance planner.
Executive
Production availability · Maintenance cost/tonne · OEE
Plant Manager
MTBF · MTTR · PM compliance % · Unplanned downtime hours
Reliability Engineer / Maintenance Planner
Asset health scores · Failure mode trends · Work order backlog · Spare parts coverage
Why Steel Plant Reliability Dashboards Fail
Most reliability dashboards at steel plants suffer from the same fundamental design problem: they are built by engineers who know the data, not by the managers and planners who need to act on it.
Too Much Historical Data
Last year's MTBF tells you what happened, not what is happening. A reliability dashboard must include leading indicators — asset health trends, vibration anomaly scores, PM completion rates — that give advance warning before the failure occurs.
No Link to Production Output
Reliability KPIs presented in isolation — without showing their connection to production availability and OEE — make it difficult for plant leadership to prioritize maintenance investment. Every reliability metric should have a direct production impact line.
Asset-Class Aggregation
Averaging MTBF across all rotating equipment hides that one gearbox accounts for 60% of all bearing failures on the rolling mill. Steel plant reliability KPIs need equipment-specific tracking, not fleet averages.
No Predictive Layer
A dashboard that only reports failure history provides no basis for forward-looking maintenance decisions. Asset health scores, remaining useful life estimates, and anomaly confidence scores belong on the same screen as MTBF and MTTR.
The Complete Steel Plant Reliability KPI Checklist
Organized by dashboard tier — from board-level production availability to the engineer-level asset health scores that drive daily maintenance planning decisions.
Tier 1 — Executive and Plant Leadership View
Production Availability %
The single most important reliability KPI for plant leadership — total scheduled production time less unplanned downtime, expressed as a percentage. Directly connects maintenance performance to production output.
Maintenance Cost per Tonne Produced
Normalizes maintenance spend against production volume, making comparisons across periods with different output levels meaningful and supporting CAPEX justification with cost-per-unit data.
OEE — Overall Equipment Effectiveness
The composite indicator that captures availability, performance, and quality in one number. Essential for board-level reporting and cross-site benchmarking.
Unplanned Downtime Cost (Monthly)
Translates reliability performance into financial terms, enabling direct comparison with maintenance investment alternatives and supporting the business case for predictive maintenance programs.
Tier 2 — Plant Manager and Maintenance Manager View
MTBF by Critical Asset Class
Mean time between failures tracked separately for EAF components, rolling mill bearings, blast furnace blowers, and caster equipment — because a single average across all equipment is meaningless in a steel plant's heterogeneous asset base.
MTTR — Mean Time to Repair
Repair response and execution efficiency. MTTR improvement is often more achievable in the short term than MTBF improvement and has direct impact on production availability.
PM Compliance % — Planned vs. Executed
The ratio of planned preventive maintenance tasks completed on schedule. Consistently low PM compliance is a leading indicator of increasing unplanned failures — the dashboard should alert before PM compliance drops, not after failures increase.
Planned vs. Unplanned Maintenance Ratio
A world-class maintenance operation targets 80% planned maintenance and 20% reactive. Steel plants starting from reactive cultures typically run at 40–60% planned. This ratio is the clearest summary indicator of maintenance program maturity.
Emergency Work Order Rate
Work orders classified as emergency indicate failures that were not predicted or scheduled. Tracking this rate by asset class identifies where the predictive maintenance program is not yet generating sufficient advance warning.
Craft Labor Efficiency
Ratio of wrench time to total maintenance labor time. Low wrench time indicates coordination, parts availability, or scheduling problems that prevent technicians from completing maintenance tasks efficiently once they start.
Tier 3 — Reliability Engineer and Maintenance Planner View
Asset Health Score by Equipment
Composite score combining vibration anomaly level, temperature trend, oil analysis result, and maintenance history into a single condition indicator for each critical asset. The primary input for the daily maintenance planning decision.
Remaining Useful Life Estimate
AI-generated estimate of days or production cycles remaining before failure probability reaches the intervention threshold. Used to schedule replacement in the next planned outage window rather than reacting to failure.
Vibration Trend by Bearing Position
Rolling mill bearing defect frequency trends (BPFO, BPFI, BSF, FTF) tracked over time for each chock and position, showing the rate of degradation progression and how far the signature has advanced through the four failure stages.
Failure Mode Frequency by Asset
Work order failure codes analyzed by frequency and production impact, maintained as a running Pareto chart. The input for root cause projects and for prioritizing PM task content reviews.
Maintenance Backlog by Priority
Open work orders ranked by asset criticality and due date. A growing backlog on critical assets is an early warning signal that resource allocation is misaligned with risk.
Spare Parts Availability for Critical Assets
Stock status for the parts that, if unavailable at failure time, extend downtime from hours to days. Tracked at the KPI level alongside asset health so parts risk and equipment risk are visible together.
Build the Reliability Dashboard Your Steel Plant Needs
iFactory AI delivers tiered reliability KPI dashboards pre-configured for steel plant asset classes, from executive production availability to engineer-level asset health scores. Book a session to see the full layout.
Steel-Specific Reliability Benchmarks
Understanding where your plant's KPIs stand relative to industry benchmarks helps prioritize improvement investment and set credible targets for reliability programs.
| KPI |
Reactive Plants |
Planned Maintenance |
Predictive AI-Enabled |
| Production Availability |
88–91% |
93–95% |
96–98% |
| Planned vs. Unplanned Ratio |
40:60 |
65:35 |
85:15 |
| Rolling Mill Bearing MTBF |
Highly variable |
Moderate improvement |
30–50% extension |
| MTTR for Critical Failures |
18–36 hours |
12–18 hours |
4–8 hours (planned) |
| PM Compliance |
Below 60% |
70–80% |
90%+ |
| Emergency Work Order Rate |
High — over 30% |
Moderate — 15–25% |
Low — under 10% |
Frequently Asked Questions
Should MTBF be tracked per asset class or as a plant average?
Per asset class — a single plant-wide average is meaningless when failure rates for a backup roll bearing, a blower, and a withdrawal roll differ by an order of magnitude. See asset-class MTBF tracking set up for your plant.
How does iFactory AI calculate remaining useful life estimates for steel plant equipment?
From current sensor trends plus historical failure data for that equipment and failure mode, projecting when the signature reaches the intervention threshold at its current rate of progression. Walk through how RUL estimation works for your critical asset types.
Can the reliability dashboard integrate with our existing maintenance management system?
Yes — iFactory AI integrates with major CMMS platforms to pull work order, PM schedule, and maintenance history data straight into the KPI calculations, no parallel data entry needed. Ask about compatibility with your specific CMMS.
Design the Reliability Dashboard Your Steel Plant Deserves
iFactory AI delivers leading and lagging reliability KPIs in a tiered dashboard built for steel plant asset classes and operating conditions. Book a session to see the full framework applied to your plant.