A senior production manager at a sterile manufacturing facility once described the moment her plant's SPC system died: "We turned on every Western Electric and Nelson rule because that is what the consultant recommended. Within two weeks, every tablet weight chart was firing three to five alerts per shift. The operators stopped reading them. The QA team stopped investigating them. Six months later, when a real special-cause signal appeared, nobody noticed." The fix is not turning the rules off — it is turning the right rules on. This page is the operations-grade reference for applying Western Electric and Nelson rules in pharmaceutical SPC, calibrated to the actual statistical reality of validated processes.
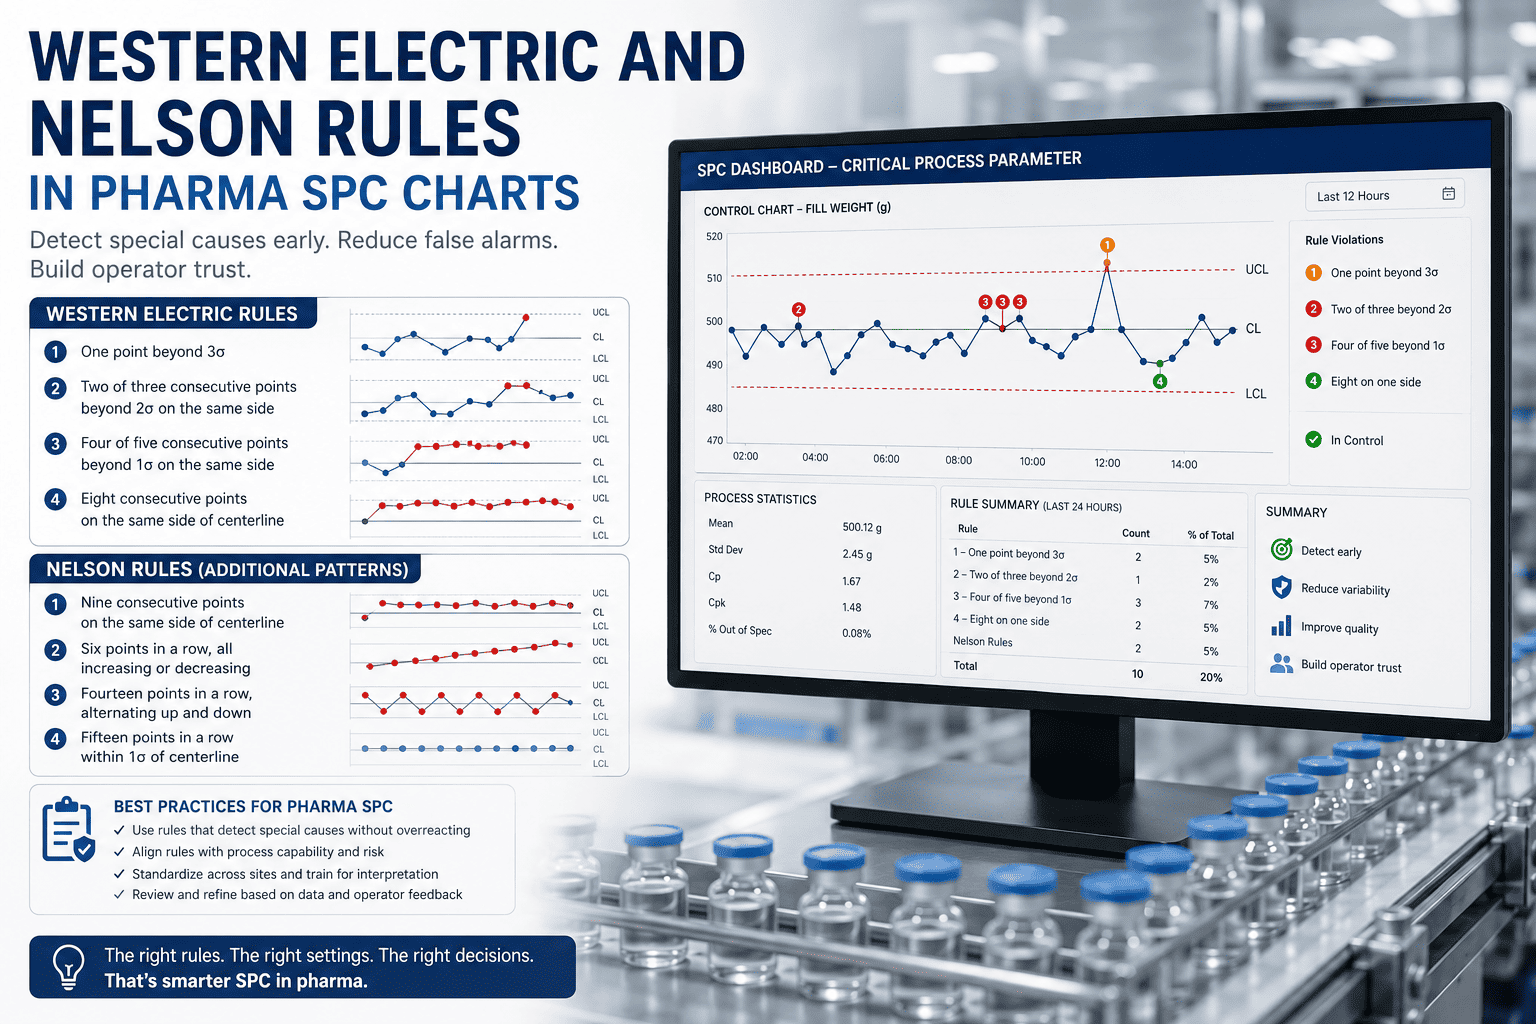
Western Electric & Nelson Rules in Pharma SPC — Which Rules, On Which Charts, And Why
Twelve rules, eight distinct patterns, four origin frameworks — and a false-alarm compounding problem that destroys operator trust in eight to ten weeks if you turn them all on. This is the calibrated reference: every rule visualized, every false-alarm rate calculated, every pharma application mapped to a specific operator response.
Two Rule Sets, One Statistical Foundation
Western Electric rules and Nelson rules are not competing frameworks — they are two generations of the same statistical idea, refined twenty-eight years apart, and partially overlapping. Knowing which rule came from where tells you which to enable for which type of pharma signal.
Western Electric Statistical Quality Control Handbook
Four rules developed inside the Western Electric Company for telephone manufacturing. Designed to detect shifts and trends in routine production processes where the data arrived in continuous streams. The four rules became the original "zones test" — partitioning a control chart into 1σ, 2σ, and 3σ zones and counting violations.
4 rules · FoundationalLloyd S. Nelson, Journal of Quality Technology
Nelson, a Bell Labs statistician, published the eight-rule extension that became the most widely cited SPC ruleset in industrial practice. Nelson's set kept Western Electric Rules 1, 2, 3, and 4 (renumbered as N1, N5, N6, N2 respectively) and added four pattern-detection rules — trend, alternation, under-dispersion, and over-dispersion.
8 rules · Operational standardThe overlap that matters
Western Electric rules are a subset of Nelson's eight. If you enable all eight Nelson rules, you have already enabled all four Western Electric rules. The decision is not "WE or Nelson" — it is which subset of the eight to enable for each pharma parameter. The next two sections give the answer.
Eight Rule Patterns — Definition, Visualization, Pharma Application
Each card below shows one rule pattern with a representative sparkline chart, the formal definition, the false-alarm rate as a standalone test, and the specific pharma signal it is designed to catch. The mini-charts show points in purple for normal, red for "violated" — read left to right, follow the pattern.
One point beyond 3σ
Pharma application: The non-negotiable rule. Always enabled on every CQA and CPP chart. Tablet weight beyond 3σ, dissolution pH excursion, sterility-related alarms all trigger here.
Nine points on one side of centerline
Pharma application: Catches slow process drift — capsule weight slowly walking up after a feeder adjustment, tablet hardness drifting after punch wear. Strong signal on validated processes.
Six points trending up or down
Pharma application: Punch-tip wear on tablet press, gradual sensor drift on weight checkers, slow viscosity change in a coating suspension. Most useful on parameters known to have time-related drift.
Fourteen points alternating up and down
Pharma application: Often signals operator/shift alternation, two-stream sampling collapsed into one chart, or alternating between two filling heads on a multi-station machine. Frequent false signal on pharma — use with caution.
Two out of three points beyond 2σ on the same side
Pharma application: The most useful early-warning rule on CQAs. Catches moderate shifts in tablet weight, fill volume, or active assay before they reach the action limit. Enable on Critical Quality Attributes by default.
Four out of five points beyond 1σ on the same side
Pharma application: Effective on slow walk-downs that Nelson 1 and 5 will not catch — gradual pH drift, slow temperature creep in a coating pan, mild but persistent humidity change in a granulator.
Fifteen points in a row within 1σ (under-dispersion)
Pharma application: The under-rated rule. A pharma process suddenly looks "too good" only when something is wrong — a stuck sensor, a sample line that has lost flow, or an operator recording target values instead of measurements. Data integrity signal.
Eight points in a row beyond 1σ on either side
Pharma application: Detects when the process variance has expanded beyond the historical baseline — typical signature of a maintenance event, a raw-material lot change, or running two suppliers' material on the same chart.
Why "All Eight Rules On" Is the Wrong Default
Each rule, run in isolation on an in-control process, has a small false-alarm probability per point. Running multiple rules simultaneously is not additive — the combined false-alarm rate compounds. The table below is why pharma operators stop trusting SPC dashboards.
| Rules enabled | Approx. false-alarm rate per point | Average Run Length (in control) | Expected false alarms per 1000 points | Operator experience |
|---|---|---|---|---|
| N1 only (3σ rule) | 0.27% | ~370 | 2 to 3 | Trusted. Every alert is investigated |
| N1 + N5 (early warning) | 0.55% | ~180 | 5 to 6 | Trusted. Alerts spaced widely enough to act on |
| N1 + N2 + N5 + N6 (zones tests) | 1.2% | ~85 | 11 to 13 | Mostly trusted. One investigation per shift |
| All 8 Nelson rules | 2.5%+ (compounded) | ~91 to 40 | 25+ | Distrusted within 8–10 weeks. Operators ignore the alerts |
Why ARL matters more than alpha
Average Run Length is the expected number of in-control samples before a false alarm fires. ARL 370 means roughly one false alarm per 370 samples — about one per month on a daily-sampled chart. ARL 91 means one false alarm per 91 samples — roughly one per week, on a chart that is in control. Operators read three or four such alarms in a row, dismiss them as noise, and stop reading the chart. That is how an SPC program dies.
Risk-Based Rule Selection — Which Rules for Which Parameter Class
ICH Q9 says quality management is risk-based. Apply the same principle to SPC rules. The matrix below maps parameter criticality to recommended rule sets. Use it as a starting reference and tune to your historical data — over-rule on a CQA is acceptable; over-rule on an operational parameter is how operator trust gets destroyed.
| Parameter class | Examples | Recommended rules | Rationale |
|---|---|---|---|
| Critical Quality Attribute (CQA) | Active assay, dissolution, sterility, content uniformity | N1, N5, N2, N6 | Maximum sensitivity to mean shift; tight ARL on the parameters that drive batch disposition |
| Critical Process Parameter (CPP) | Compression force, blend uniformity, granulation moisture, coating endpoint | N1, N5, N2 | Strong shift detection; avoids the alternation and dispersion rules that signal sampling artifacts |
| Key Performance Indicator (KPI) | Cycle time, yield, first-pass success | N1, N2, N3 | Trend detection matters more than fine zone-based signals on productivity metrics |
| Diagnostic / Operational | Room temperature, motor current, vacuum level | N1 only | Reduce false alarms on parameters that are advisory rather than dispositional |
| Data Integrity Check | Online analyser output, vision system count, cycle counter | N1, N7 | N7 catches stuck or frozen instruments — under-dispersion is the signature of "too good to be true" |
Get your existing SPC charts audited against this matrix
We pull your last six months of SPC data, run every chart through the rule-selection matrix, and deliver a per-chart recommendation — which rules to enable, which to disable, what the false-alarm rate is on each. No DCS or LIMS modification required.
- Per-chart rule recommendation
- False-alarm rate calculation
- CQA / CPP / KPI classification
- Operator response procedure
- GAMP 5 validation deliverables
- Live in 6–12 weeks, fully validated
Within-Batch vs Between-Batch — Rules Are Not Interchangeable
Pharma SPC operates on two timescales — within a single batch (continuous process monitoring) and across batches (continued process verification under FDA guidance). Rules that work brilliantly within a batch can be misleading across batches and vice versa. Mismatching the timescale and the rule set is the second-largest source of false alarms after over-ruling.
Single-batch process monitoring
Typical chart: Individuals (I-MR), X-bar R on subgrouped samples, or EWMA for slow drifts within a batch run.
Sample rate: Every 30 seconds to every 5 minutes, depending on the parameter and the line speed.
Recommended rules- N1 — single-point excursion (always)
- N5 — two of three beyond 2σ (early shift detection)
- N3 — six trending (catches tool wear within a long run)
- N4 — alternation rule fires on every alternating-feeder station
- N7 — under-dispersion is normal in a well-controlled batch
Continued process verification (CPV)
Typical chart: Batch-by-batch I-MR on end-of-batch results, or batch averages on an X-bar chart.
Sample rate: One point per batch — typically 5 to 30 points per month per parameter.
Recommended rules- N1 — single-batch out-of-spec
- N2 — nine batches on one side (process drift)
- N5 — two of three beyond 2σ (early signal)
- N6 — four of five beyond 1σ (slow walk)
- N3 — trending with few data points is noise, not signal
- N4, N7 — sample sizes too small for these to be meaningful
What Happens When a Rule Fires — Action Mapping
A rule firing is not a deviation. It is a signal that warrants investigation. The operator response should be specific to the rule that fired — different rules indicate different things, and treating every alert as a critical event is exactly how SPC programs lose credibility.
Single point beyond 3σ — Immediate action
Stop the line for any CQA. Verify the measurement (instrument check, retest). If real, initiate deviation under the QMS and trigger investigation per ICH Q9. Inform shift supervisor and QA. The 3σ rule is the only one that is dispositional on a single point.
Nine on one side — Investigate process centering
The process has shifted but is still within limits. Check for recent maintenance, raw material lot change, instrument calibration, or operator change. Do not stop the line — verify the shift is real, then plan a centering action at the next planned interval.
Six trending — Check for wear or drift
Something is slowly changing. Inspect tools for wear, check sensors for drift, verify temperatures and pressures. Project the trend forward and predict when the next limit will be crossed. This is the rule that gives you advance notice.
Two of three beyond 2σ — Early warning
The process has shifted significantly but no point has yet breached 3σ. Heightened sampling, verify the cause, prepare corrective action. This is the rule that gives you time to act before N1 fires.
Fifteen within 1σ — Check the instrument
The data is suspiciously good. Verify sample flow, sensor health, transmitter calibration. Look for a stuck instrument, a frozen analyser, or a sample line that has lost flow. Data-integrity event under ALCOA+ until proven otherwise.
Eight beyond 1σ — Process variance expansion
The process spread has increased. Check for a recent maintenance event, a new raw-material lot, or mixed-stream sampling. Often resolved by stratifying the data — splitting one chart into two will reveal which subset is driving the dispersion.
Case Study — Sterile Injectables Plant, 18 SPC Charts Re-Tuned
A mid-sized sterile manufacturer in Telangana running 18 SPC charts across three filling lines. Pre-audit: all eight Nelson rules enabled on every chart. Operators were dismissing alerts as "the system being noisy" within two weeks of any new product introduction. QA flagged the practice as a data-integrity risk during an internal audit, triggering the rule-tuning project.
| Metric | Before (all 8 rules) | After (risk-based) | Change |
|---|---|---|---|
| False alarms per chart per month | 11 to 14 | 1 to 3 | −80% |
| Real signals investigated | 2 of 5 caught (40%) | 5 of 5 caught (100%) | +150% |
| Operator dismissal rate of alerts | 78% | 9% | −88% |
| Time to acknowledge a real N1 event | 42 minutes median | 4 minutes median | −90% |
| QA-flagged data integrity concerns | 3 per quarter | 0 in 9 months | Eliminated |
What changed beyond the rule selection
The rule audit was the leading deliverable, but it was paired with three operational changes: per-rule operator response procedures published at each console, mandatory acknowledgment with reason capture on every alert, and weekly review of dismissed alerts. The rule re-tuning made the system worth listening to; the workflow changes made the operators listen.
Six-Phase Rule-Tuning Roadmap for Existing SPC Programs
Most pharma plants do not need to rebuild their SPC infrastructure — they need to tune the rule selection on the charts they already have. The six phases below take a typical 20–40 chart program from over-ruled and distrusted to risk-based and operational in five to seven months.
Chart Inventory and Classification Week 1–3
List every active SPC chart. Classify each as CQA, CPP, KPI, Diagnostic, or Data Integrity. Map to the risk-based recommended rule set. Identify the over-ruled and under-ruled candidates.
Historical False-Alarm Analysis Week 4–6
Re-run the last six months of data through the existing rule set and through the proposed risk-based set. Quantify the false-alarm reduction, the missed-signal recovery, and the time-to-detection improvement on every chart.
Operator Response Procedure Authoring Week 7–10
For each enabled rule on each chart, document the specific operator action. Mandatory acknowledgment fields, reason-capture lists, escalation thresholds. Published at each console as the on-screen response procedure.
Validation and Change Control Week 11–14
Rule changes flow through MOC referencing GAMP 5 risk assessment. URS update, validation testing against historical data, training records updated. Audit trail captures every rule enable / disable with justification.
Parallel-Run and Operator Training Week 15–20
New rule set runs alongside the existing set for four to six weeks. Operators trained on the per-rule response procedures. Daily review of any divergence between the two rule sets. Refine before cutover.
Operational Cutover and Quarterly Review Month 6+
Risk-based rule set becomes operational. Quarterly review of false-alarm rate per chart, dismissal rate, and missed signals. Rules retuned on any chart that drifts outside target performance.
Western Electric and Nelson Rules in Pharma — Operations Questions
If we disable rules, are we increasing the chance of missing a real signal?
The opposite, in practice. Over-ruling creates so many false alarms that operators stop reading them, and real signals get missed inside the noise. The case study above shows real-signal detection going from 40% to 100% after disabling rules that were not appropriate for the chart type. Fewer rules, applied to the right charts, catch more real events.
What is the difference between Western Electric and Nelson rules, and which set should we use?
Nelson is a superset of Western Electric — Nelson Rules 1, 2, 5, 6 are identical to Western Electric Rules 1, 4, 2, 3 respectively. Nelson added four pattern-detection rules (3, 4, 7, 8). Use Nelson's framework, but enable only the subset of the eight that the risk-based matrix recommends for each chart class.
How does FDA guidance on continued process verification (CPV) align with rule selection?
FDA's process validation guidance (Stage 3 CPV) expects statistical monitoring of CPPs and CQAs across batches. The between-batch chart classification in this page maps directly to CPV practice — N1, N2, N5, N6 form the operational ruleset for batch-by-batch monitoring, with documented operator response and audit trail. ICH Q9 provides the risk-based framework for which rules apply to which parameters.
Can the system run different rule sets on different charts automatically?
Yes, and it must — that is the entire point of risk-based application. Each chart is configured with its own enabled rule set, response procedure, and acknowledgment requirements. Changes to either the rule set or the response procedure flow through MOC as a validated change.
How long before operators trust the SPC system again after re-tuning?
Three to four weeks in most cases. The trust collapse is fast and the trust rebuild is also fast, provided the new rule set actually delivers low false-alarm rates and the response procedures actually drive useful action. Operators are pragmatic — they trust systems that give them signals worth acting on.
Do we need to buy NVIDIA AI servers separately?
No. The fully-loaded AI server is supplied pre-configured and pre-loaded with the SPC rule engines, risk-based chart templates, operator response procedure framework, GAMP 5 validation package, and ALCOA+ audit trail. On-premise deployment, no cloud egress. Rack it, connect power and Ethernet, and the system goes live. Cabling, LIMS / historian integration, operator training, and 24×7 remote monitoring are all included.
What is the typical timeline from contract to first re-tuned chart live?
Live in 6–12 weeks for the first phase. Three-phase delivery: weeks 1–4 — chart inventory, classification, historical analysis. Weeks 5–8 — operator response procedure authoring and validation. Weeks 9–12 — parallel-run begins, first charts cut over. Full plant cutover typically completes by month six to seven.
Right Rules. Right Charts. Right Operator Response.
Hardware + software bundle. Pre-configured NVIDIA AI server, racked and ready, on-premise — no cloud, no data egress. Pre-loaded with risk-based SPC rule templates, operator response procedure framework, GAMP 5 validation package, 21 CFR Part 11 audit trail, and ALCOA+ data integrity. Cabling, LIMS integration, validation, operator training, and 24×7 remote monitoring all included. Live in 6–12 weeks. Trusted by 1000+ industrial clients with 99.9% uptime.